Brooklyn Market Pulse ¹ July 2026
Pricing Power Firms as Momentum Cools From May’s Pace
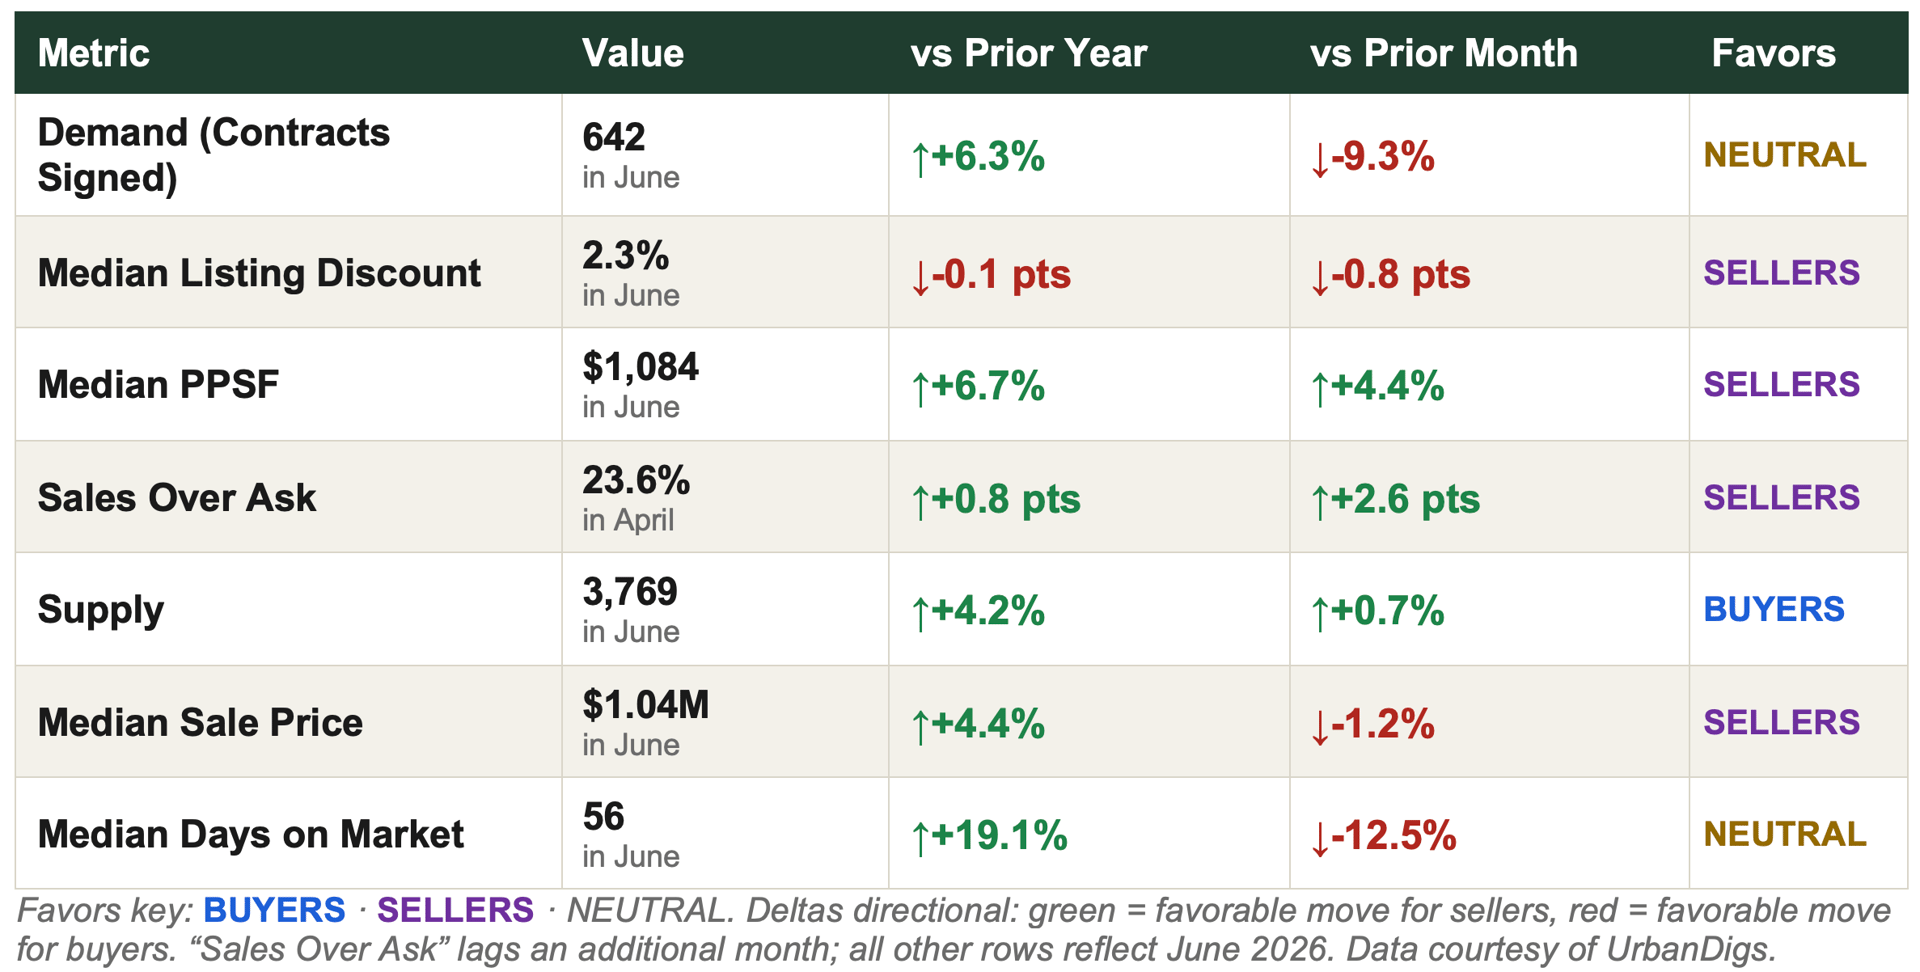
Brooklyn’s May surge didn’t fully carry into June. Signed contracts pulled back 9.3% from May’s hot pace to 642 — still up 6.3% year-over-year, but a clear step down in momentum. At the same time, the metrics that measure pricing power kept firming: median price per square foot climbed to $1,084 (+6.7% YoY, +4.4% MoM), and the listing discount compressed further to 2.3%, among the tightest readings in the metro.
Bottom line: Brooklyn is sending a genuinely two-sided signal this month. Buyers have more inventory to choose from than a year ago — the one metric where Brooklyn diverges meaningfully from Manhattan — while sellers of well-located, well-priced product are seeing some of the strongest per-foot pricing power of the cycle. June’s pullback in contract volume looks like normalization after an unusually strong May rather than a change in trend, but it’s the one data point in this report worth watching closely into July.
Market Snapshot: Five Numbers That Matter
- 642 contracts signed in June — down 9.3% from May’s surge but still up 6.3% year-over-year. A cooldown from an unusually hot month, not a reversal.
- 3,769 active listings — up 4.2% year-over-year, the clearest buyer-side signal in either borough this month.
- $1,084 median price per square foot — up 6.7% year-over-year and 4.4% from May. Per-foot pricing power is firming, not softening.
- 2.3% median listing discount — the tightest reading of any metric tracked across both boroughs this month, down on both a monthly and annual basis.
- $1.04M median sale price — up 4.4% year-over-year, holding comfortably above the $1M threshold.
Key Takeaways
- Demand cooled from an unusually strong May: contracts –9.3% MoM but still +6.3% YoY to 642. The year-over-year comparison remains the more reliable read on trend.
- Supply is Brooklyn’s clearest divergence from Manhattan: 3,769 active listings, up 4.2% YoY — genuinely more choice for buyers than a year ago, a dynamic Manhattan does not share this month.
- Per-square-foot pricing accelerated: $1,084, up 6.7% YoY and 4.4% from May — Brooklyn’s PPSF growth rate outpaced Manhattan’s this month.
- The listing discount compressed to 2.3%, among the tightest of any major NYC submarket, alongside 23.6% of April sales closing above ask.
- Median sale price held above $1M at $1.04M, up 4.4% YoY.
- Days on market fell 12.5% from May to 56, even as it sits 19.1% above June 2025 — echoing Manhattan’s pattern of faster monthly absorption against a softer annual comparison.
- A data caveat worth flagging: recorded closed-sale counts (496, –42.1% MoM) reflect public-record recording lag on the most recent month rather than a genuine activity collapse — the same caveat that applies to Manhattan’s figures this month. Contracts signed is the cleaner demand read.
Outlook
Brooklyn is sending real signals in both directions this month: rising inventory and a monthly demand pullback point toward buyers, while accelerating PPSF and a compressing discount point firmly toward sellers. Net, this reads as a market normalizing from an unusually hot spring rather than a genuine change in direction — the metric most worth tracking into July is whether contract volume re-accelerates toward May’s pace or settles into a more moderate summer rhythm.
■ For Sellers: Per-foot pricing power and the listing discount are both moving in your favor, and nearly a quarter of April sales closed above ask. Well-located, well-priced product is still commanding real competition, even with June’s softer contract count.
■ For Buyers: Brooklyn is the one borough in this report where inventory is genuinely building relative to last year. That means more selection and, on listings that have sat longer, real room to negotiate — even as the strongest assets continue to trade near or above ask.

Photo by Rihards Gederts | Howard Hanna NYC
Howard Hanna NYC Brooklyn Leverage Index
The Howard Hanna NYC Brooklyn Leverage Index tracks four market signals — supply, demand, median PPSF, and median listing discount — to gauge the balance of power between buyers and sellers. Tightening supply, accelerating demand, firming PPSF, and compressing discounts all point toward sellers; the reverse combination points toward buyers.
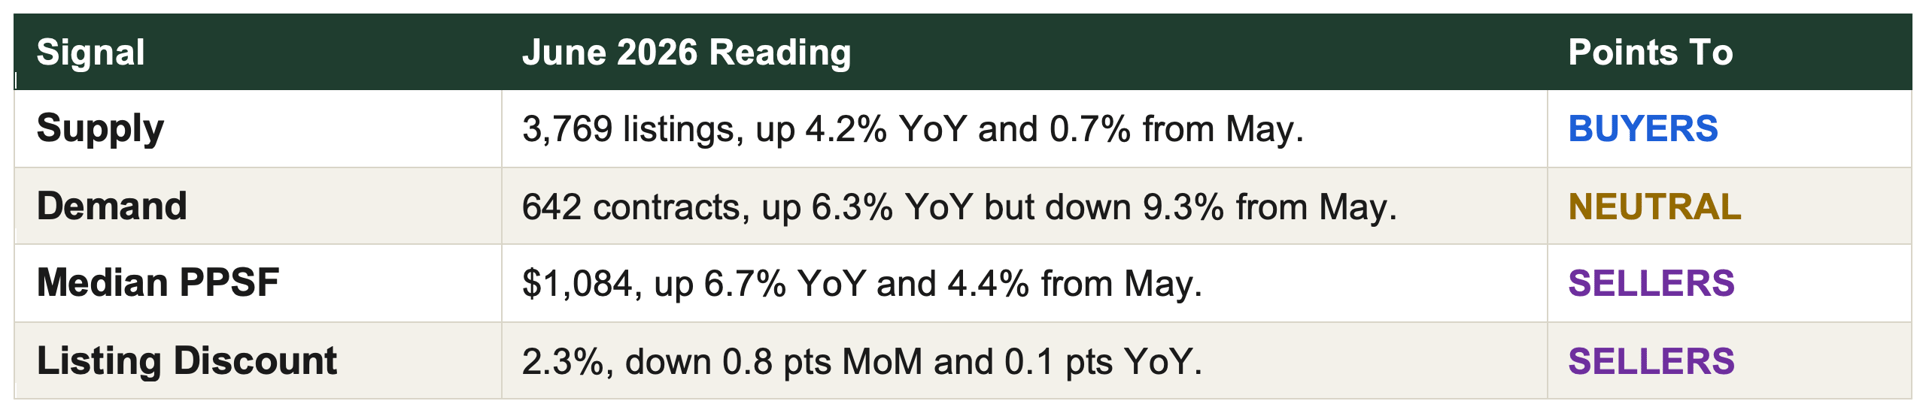
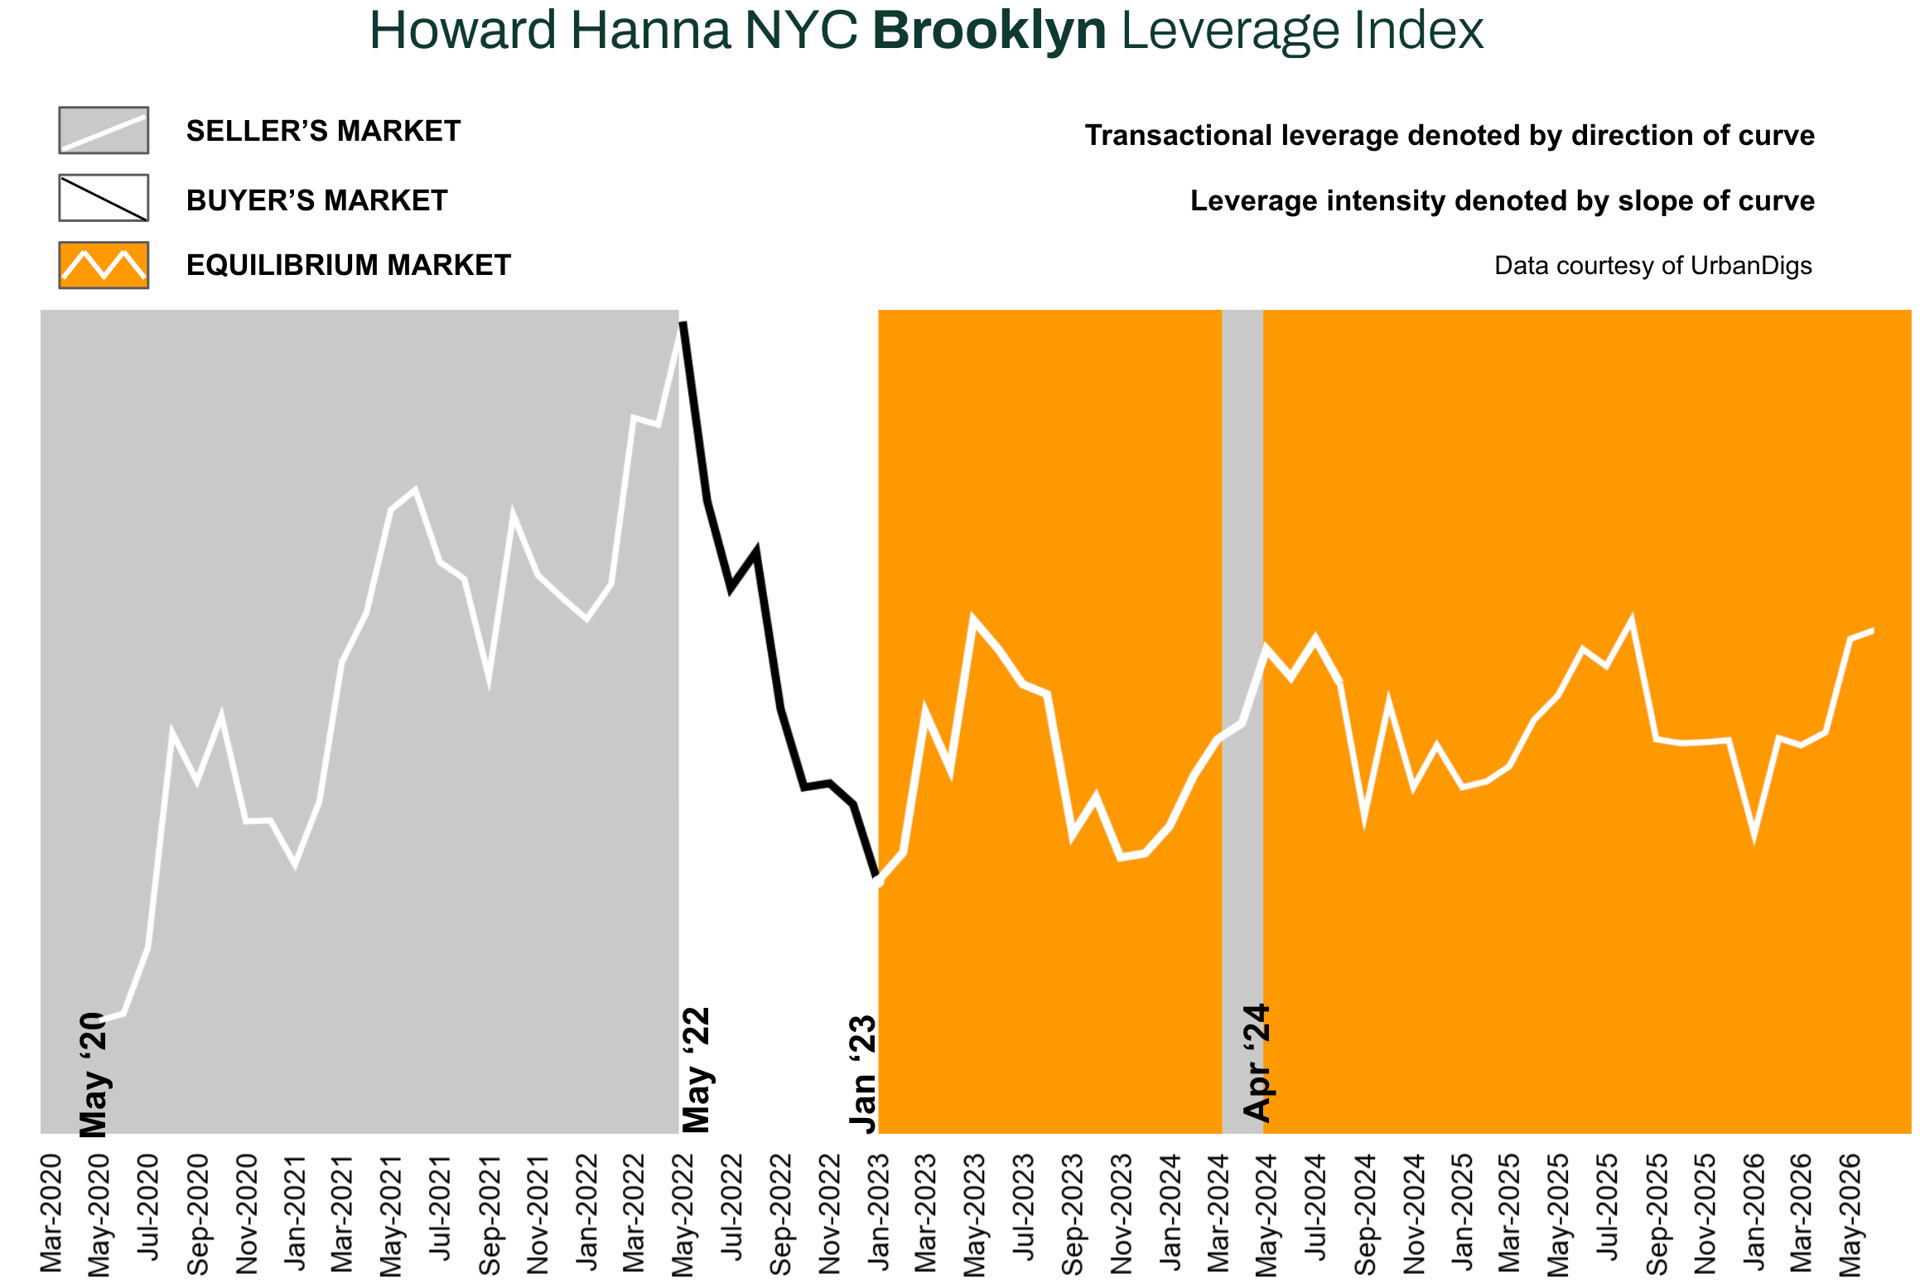
Brooklyn’s four signals are genuinely more mixed than Manhattan’s this month. Two inputs — PPSF and the listing discount — point firmly toward sellers, supply is the one clear buyer-side signal in either borough’s report, and demand itself is split: comfortably ahead of last year but down from May’s own pace. Net, Brooklyn remains seller-leaning on pricing power, but with real, data-backed room for buyers that Manhattan simply does not offer this month.
Brooklyn Supply
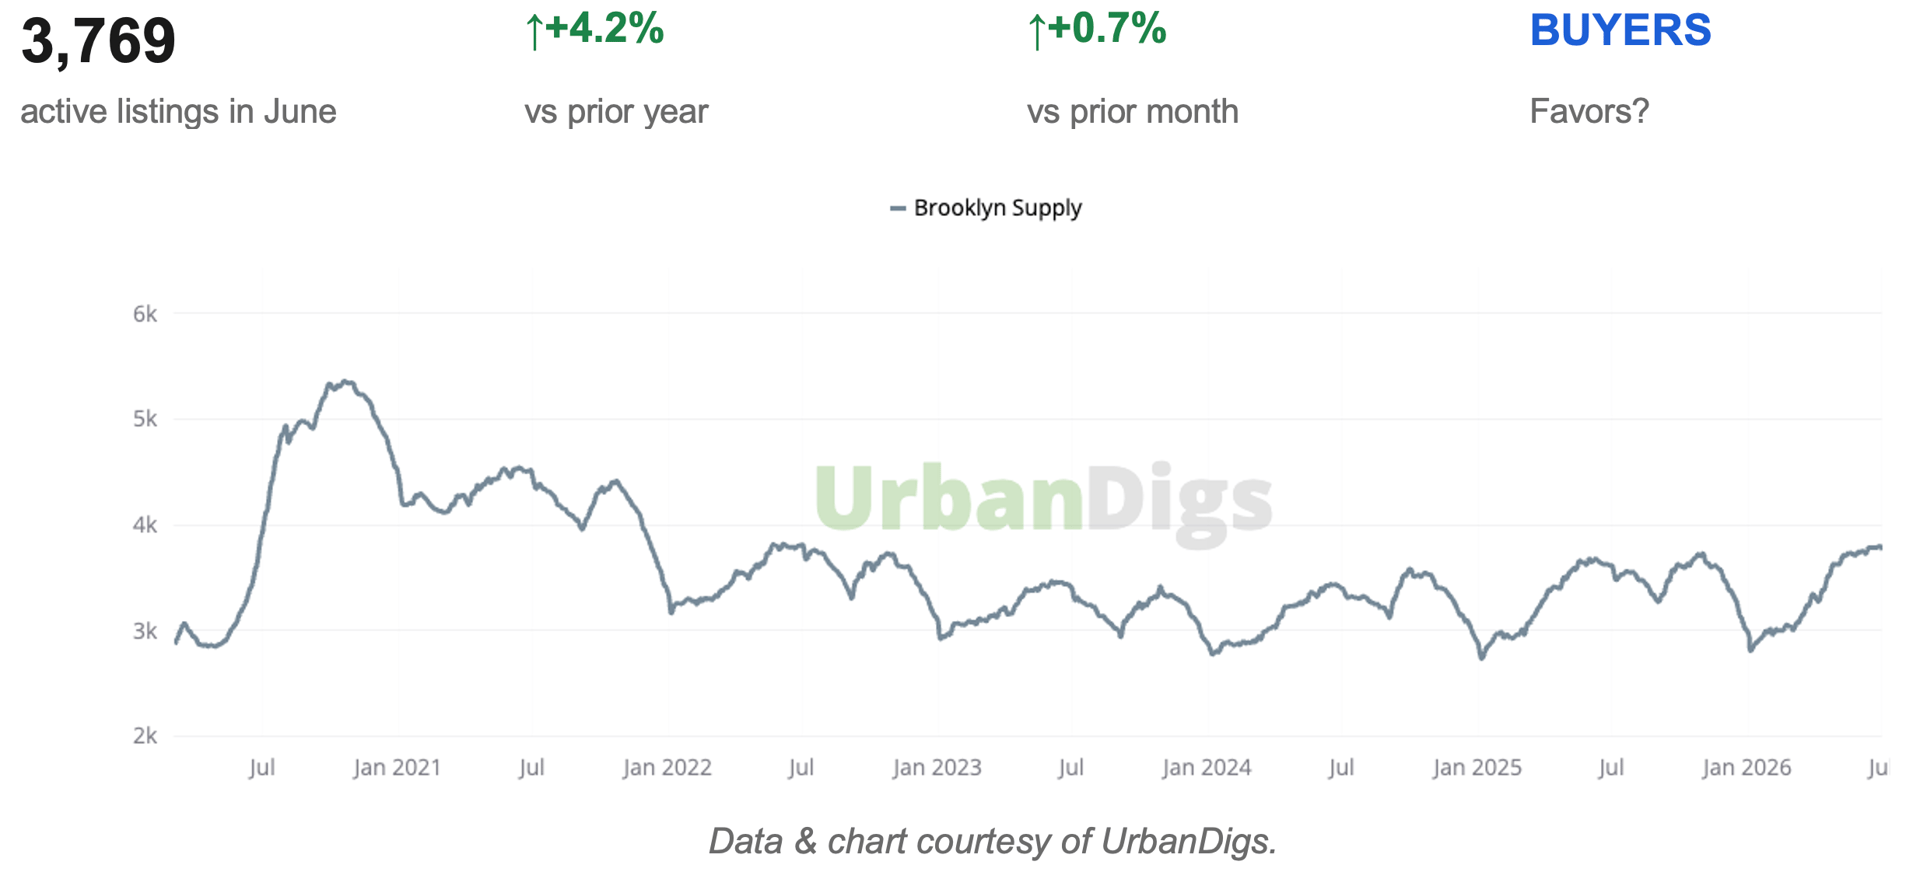
INVENTORY BUILDS FURTHER ABOVE LAST YEAR’S PACE
Active Brooklyn listings reached 3,769 in June, up 0.7% from May and 4.2% above June 2025 — a pattern Manhattan is not sharing this month. Months of inventory ticked up to 4.1, from 4.0 in May. As the chart shows, this remains well within Brooklyn’s post-2022 range, not a return to the elevated 5,000+ levels seen in 2021 — this reads as measured normalization, not oversupply.
■ Buyers: This is the more favorable inventory backdrop of the two boroughs. More listings mean more leverage, particularly on product that has been sitting.
■ Sellers: Competing inventory is genuinely higher than a year ago. Accurate pricing from day one matters more here than in Manhattan’s tighter market.
Outlook: Expect continued gradual inventory growth through the summer listing season. The key question is whether new supply keeps outpacing demand growth — if June’s contract pullback proves temporary, supply and demand could re-balance by late summer.
Brooklyn Demand

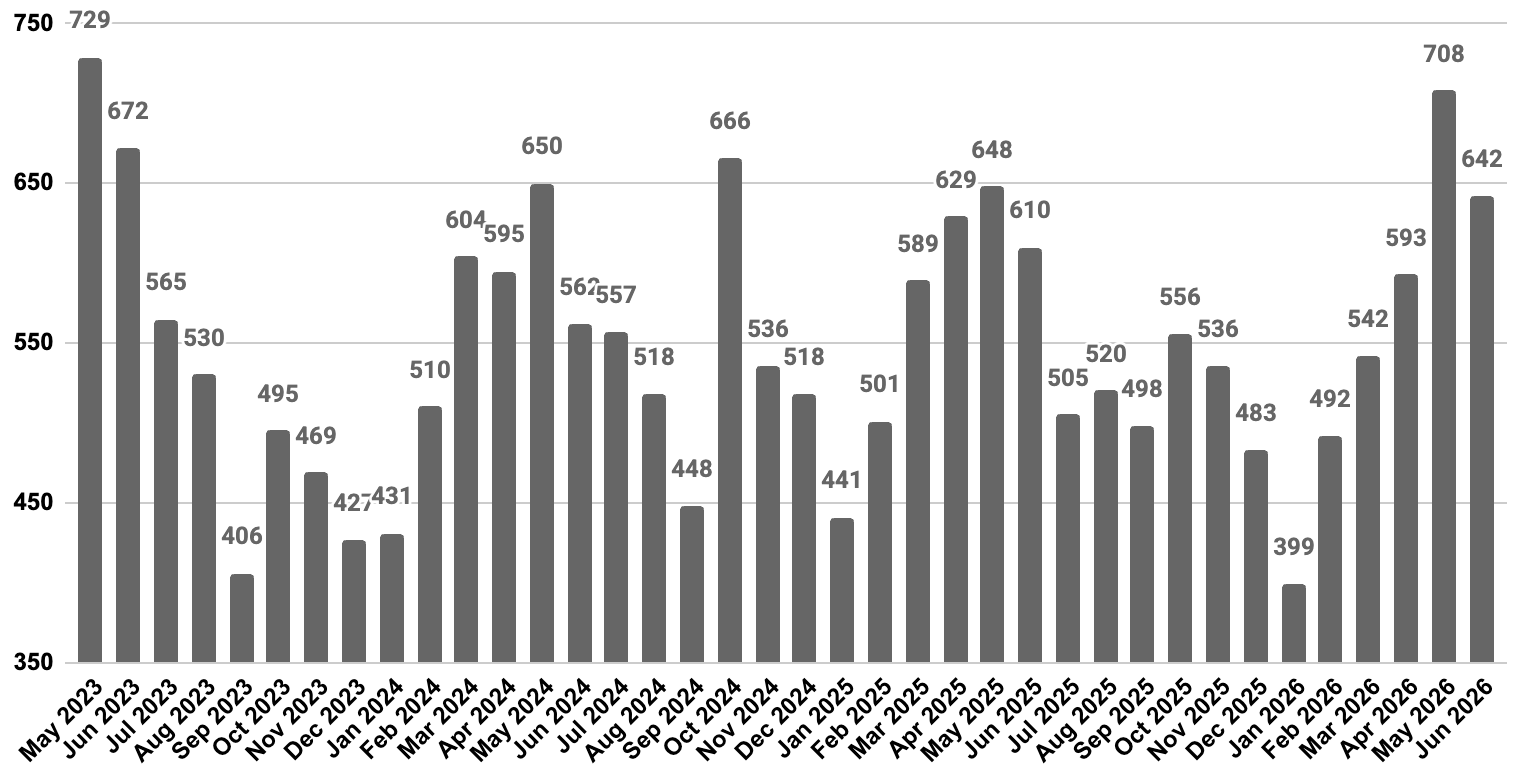
CONTRACTS COOL FROM MAY’S PACE, STILL AHEAD OF LAST YEAR
June brought 642 signed contracts, down 9.3% from May but up 6.3% year-over-year. Pending sales tell a steadier story: up 12.9% from May and 4.0% year-over-year to 2,285, suggesting the forward pipeline has not cooled to the same degree as new signings. May’s contract count looks, in retrospect, like an unusually strong month rather than a new baseline.
■ Buyers: The intensity of competition has eased somewhat from May’s peak. This is a reasonable window to move without the sharpest possible bidding pressure.
■ Sellers: The year-over-year comparison remains solidly positive. One softer month against an unusually strong prior month is not, on its own, a trend change — but it is worth pricing new listings with this month’s pace in mind, not May’s.
Outlook: Watch July’s contract count closely: a rebound toward May’s pace would confirm June was noise, while a second consecutive soft print would be the first real evidence of cooling demand in Brooklyn this cycle.
Brooklyn Median PPSF

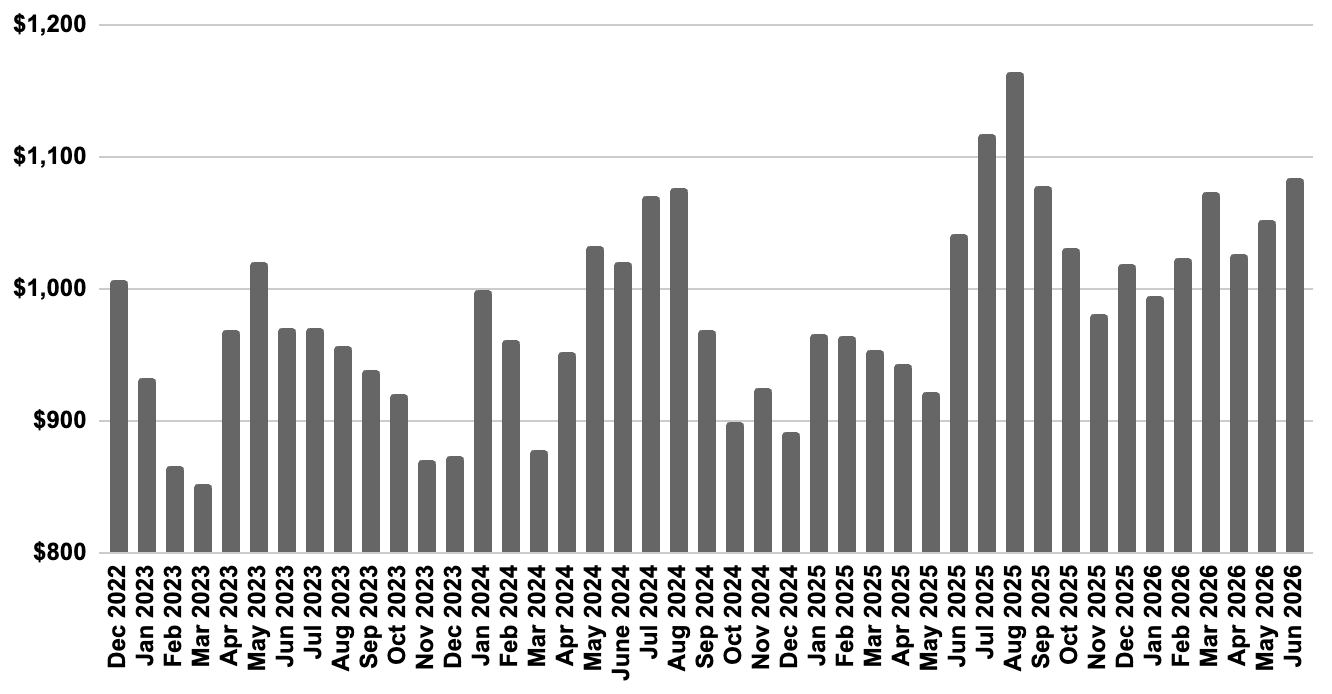
PER-FOOT PRICING ACCELERATES — BROOKLYN’S STRONGEST SIGNAL THIS MONTH
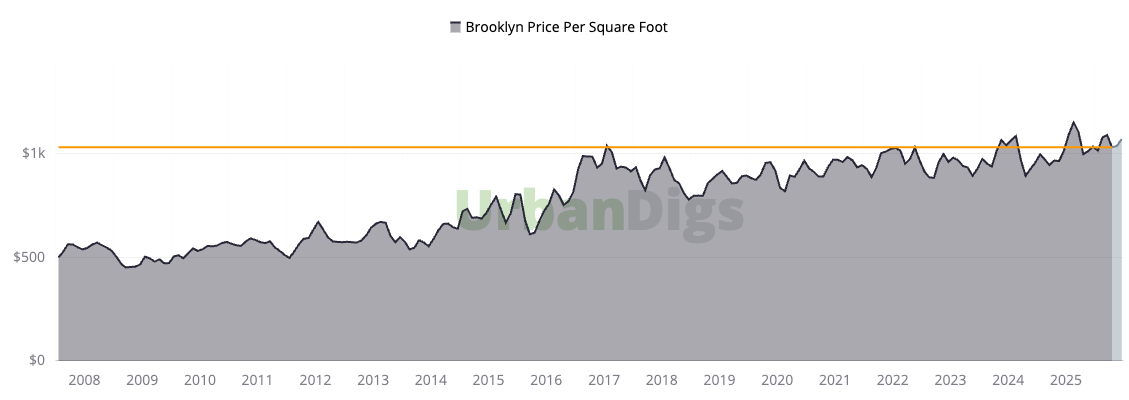
Median PPSF reached $1,084 in June, up 4.4% from May and 6.7% year-over-year — Brooklyn’s clearest and strongest seller-side signal this month, and a faster annual growth rate than Manhattan posted. Brooklyn PPSF has been on a more actively appreciating trajectory than Manhattan’s over the past decade, consistent with the borough’s ongoing re-rating as a premium destination in its own right.
■ Buyers: Per-foot pricing leverage is limited right now. Focus on asset quality and location rather than waiting for a pullback in per-foot pricing.
■ Sellers: This is the strongest pricing signal in either borough’s report this month. Premium, well-located product is capturing real momentum.
Outlook: With demand still ahead of last year and supply growth measured rather than dramatic, PPSF should hold firm through Q3 absent a broader pullback in contract activity.
Brooklyn Median Listing Discount

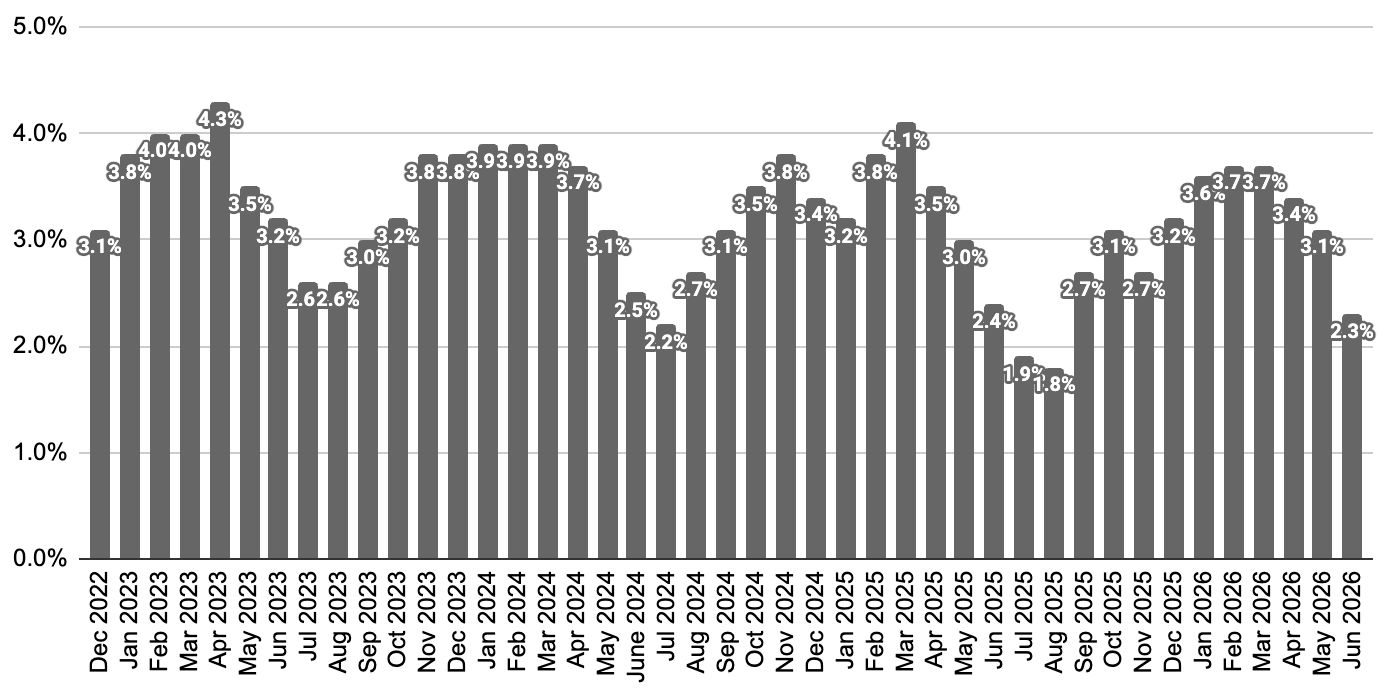
NEGOTIATING ROOM COMPRESSES TO THE TIGHTEST READING IN THIS REPORT
The median listing discount tightened to 2.3% in June, down 0.8 points from May and 0.1 points below June 2025 — the tightest reading of any metric tracked across both boroughs this month. On a $1M listing, that is roughly $23,000 of negotiating room, alongside 23.6% of April sales closing above asking price entirely.
■ Buyers: There is very little room to negotiate on well-priced, well-located listings right now. A credible, clean offer will outcompete a lowball on desirable product.
■ Sellers: Pricing power is about as strong as this report has recorded for Brooklyn. Accurately priced listings are converting at or above ask.
Outlook: Given rising supply typically pushes discounts wider, June’s further compression is a genuinely strong signal for sellers — expect the discount to hold in the low-2% to low-3% range barring a demand slowdown beyond June’s monthly dip.
Rental Remarks
ASKING RENTS FIRM AT $3,895 — UP 6.7% YEAR-OVER-YEAR
Brooklyn’s median asking rent reached $3,895 in May 2026, up 1.2% from April and 6.7% year-over-year. Active rental inventory climbed to 12,149 units (+9.9% from April) but remains 7.2% below May 2025. The discount share ticked up to 10.8% (from 9.3% in April) yet is still 9.2% below year-ago levels — modestly more negotiating room than a month ago, but a tighter market than a year ago.
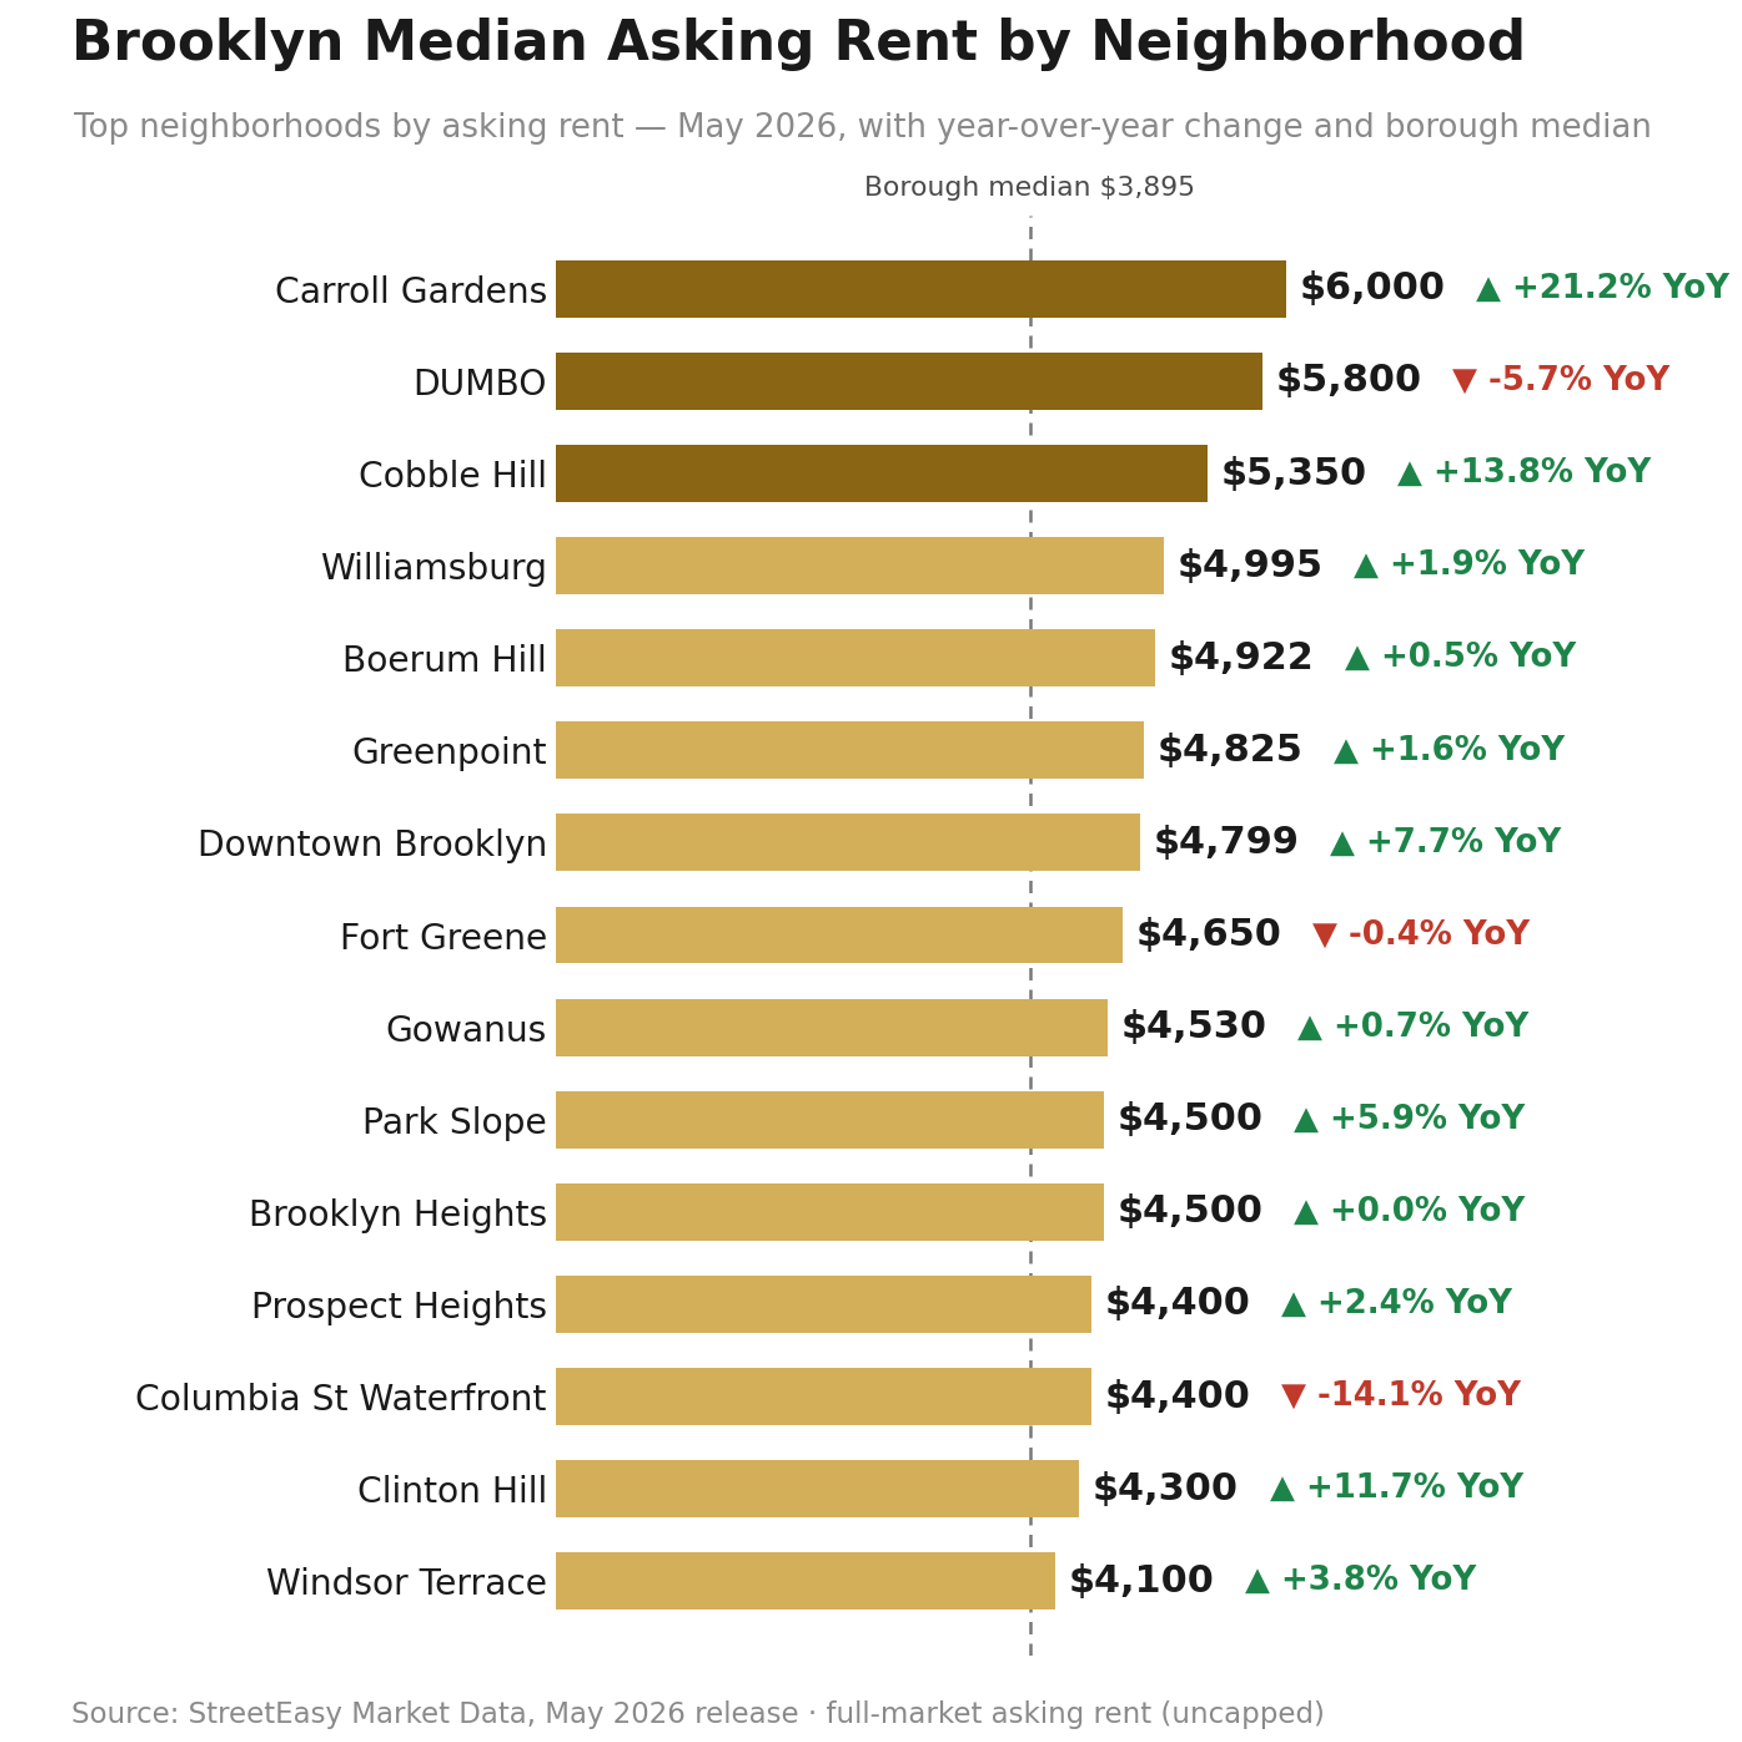
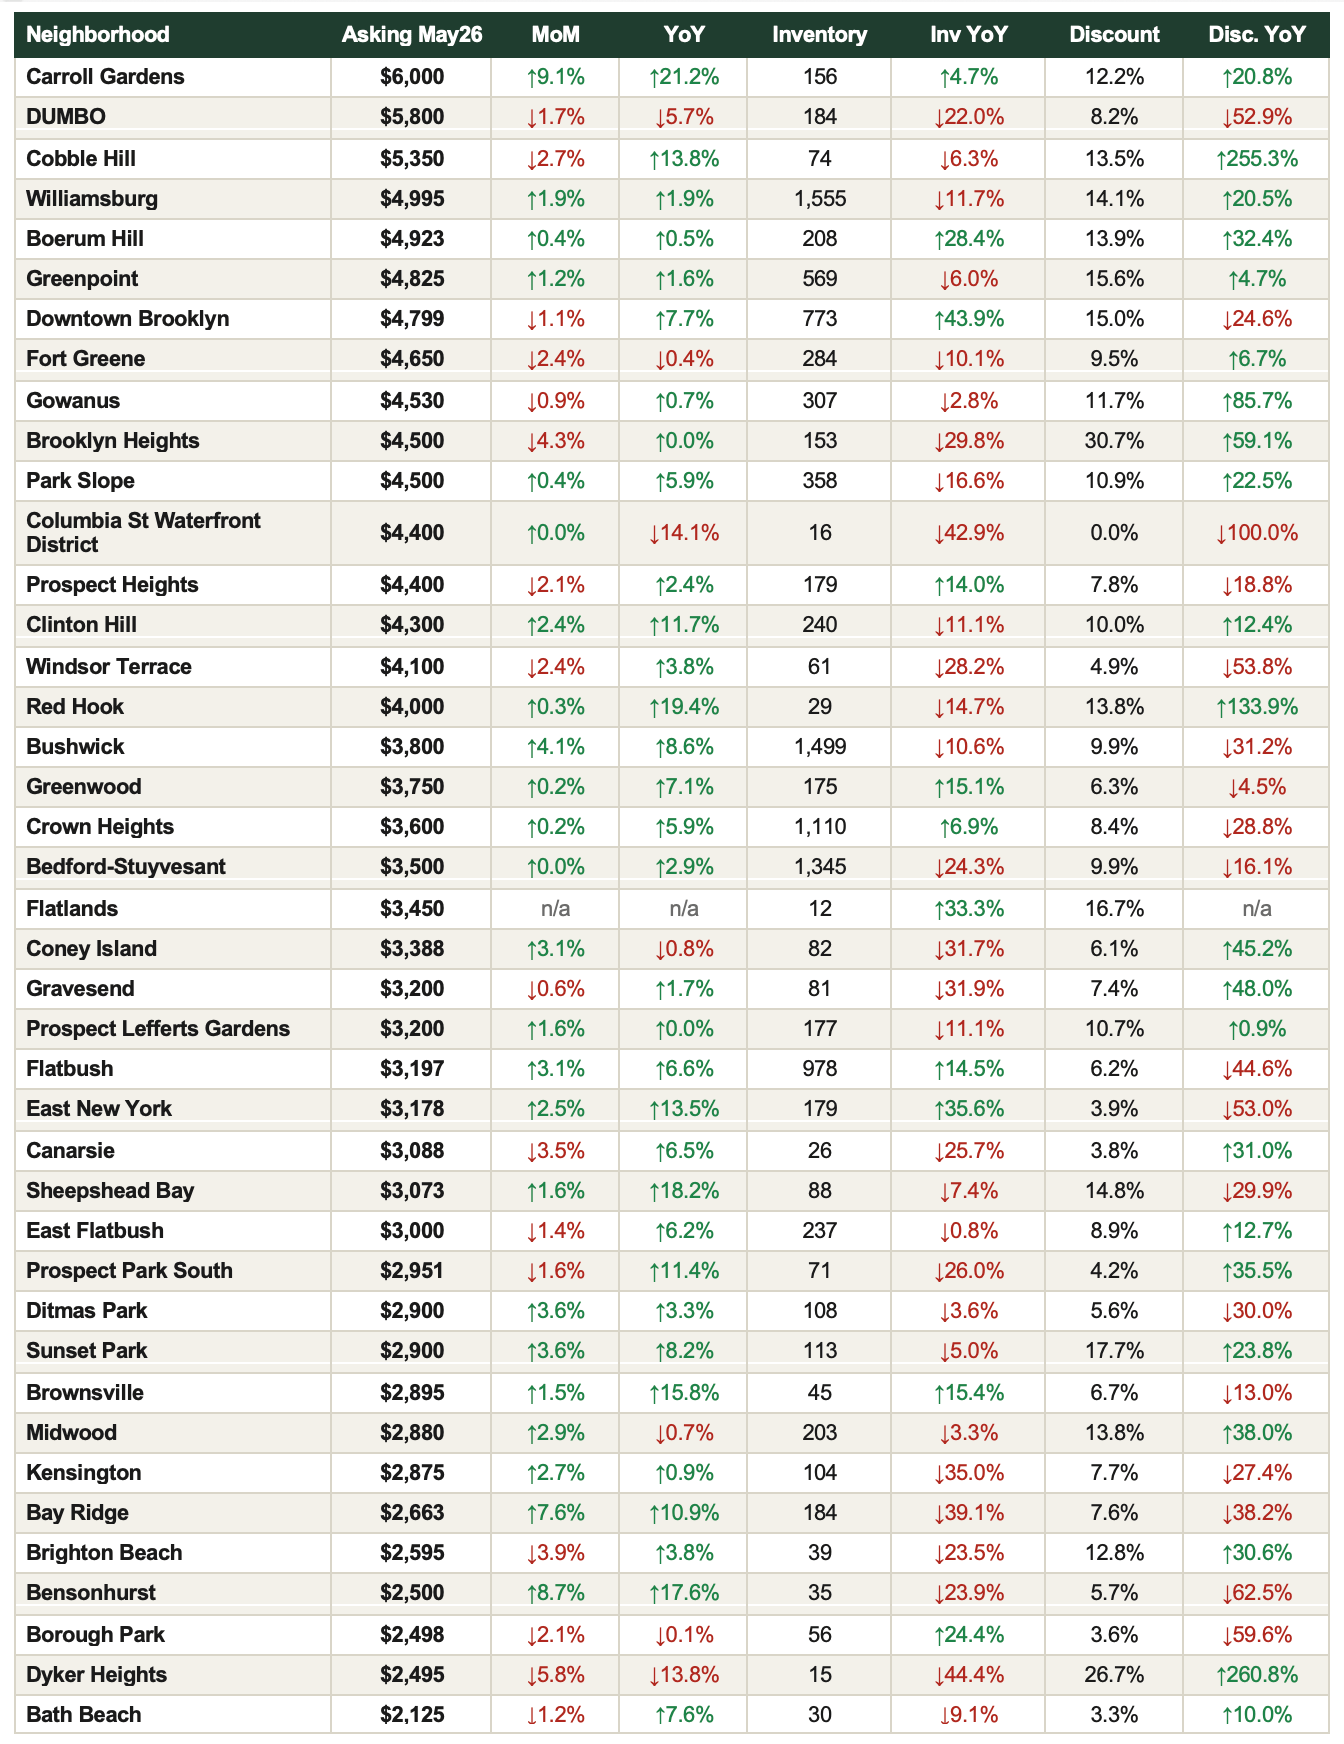
Carroll Gardens leads Brooklyn on price at $6,000 (+21.2% YoY), followed by DUMBO ($5,800) and Cobble Hill ($5,349, +13.8% YoY) — the brownstone corridor continues to command a clear premium. Williamsburg remains Brooklyn’s deepest rental pool at 1,555 active listings, followed by Bushwick (1,499) and Bedford-Stuyvesant (1,345). On the accessible end, Bath Beach ($2,125), Dyker Heights ($2,495), and Borough Park ($2,497) anchor the value end of the market, though Dyker Heights posted a notable –13.8% YoY pullback worth watching given its small (15-listing) sample.
■ For Renters: Brooklyn offers a bit more room than Manhattan — inventory is up nearly 10% from April, and the discount share ticked up slightly. Still, with 6.7% YoY rent growth and inventory still below last year, this favors moving decisively on the right unit over waiting for a meaningful pullback.
■ For Landlords: Rents are up 6.7% YoY even as Brooklyn absorbed the largest share of the city’s new rental construction. Demand is clearly keeping pace with new supply.
Outlook: Expect rents to continue firming into peak leasing season, with the pace of inventory growth (now +9.9% MoM) worth watching as the key variable — if new supply keeps building at this rate, it could be the first real test of Brooklyn’s pricing power this cycle.
Source: StreetEasy Market Data, May 2026 release · median asking rent, active rental inventory, discount share · full market, uncapped · 41 Brooklyn submarkets shown.
Mortgage Remarks
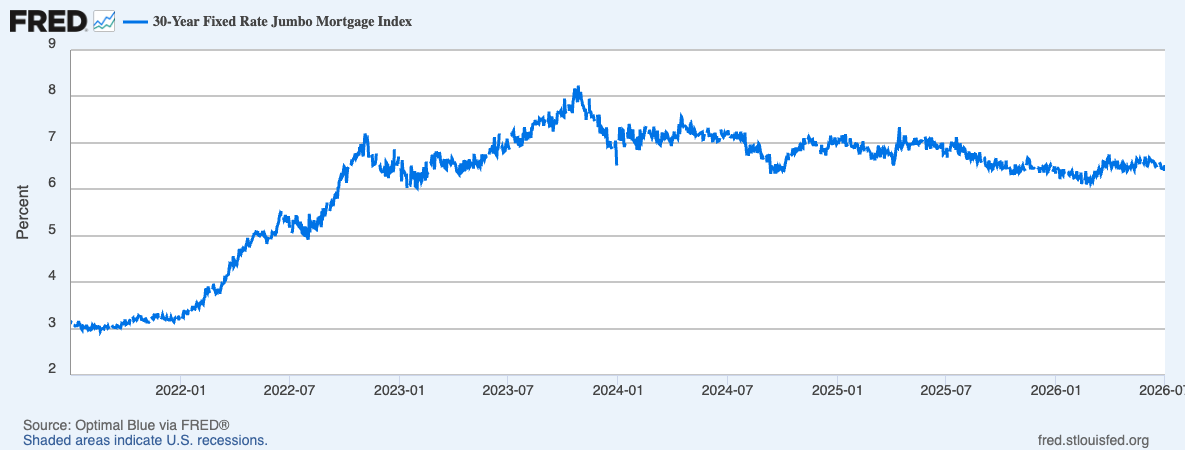
Courtesy of the Federal Reserve Bank of St. Louis (FRED) and Bank of America, Chase, and Wells Fargo.
RATES DRIFT HIGHER — A MORE DIRECT CONSTRAINT FOR BROOKLYN’S BUYER POOL
Average 30-year jumbo mortgage rates were running in the 6.5%–6.7% range as of late June 2026, up modestly from roughly 6.1% earlier this year, following the Federal Reserve’s June 17 decision to hold its benchmark rate at 3.50%–3.75% for a fourth straight meeting — a hold paired with a notably more hawkish tone under new Chair Kevin Warsh.
Updated Fed projections now lean toward rates ending 2026 higher rather than lower, with inflation expectations revised up and markets pricing roughly a 25-basis-point hike by October. Brooklyn’s buyer pool is more financing-dependent than Manhattan’s on average, so this rate backdrop is a more direct constraint here — which makes June’s continued strength in PPSF and the listing discount notable: demand for the right product is holding even as financing costs firm.
■ Buyers: Rates are a real cost at Brooklyn price points. Get pre-approved and understand your payment at 6.5%+ before you shop, rather than anchoring to the lower rates seen earlier this year.
■ Sellers: Despite firmer rates, well-priced listings are still converting quickly and often above ask — demand strength is outrunning the rate headwind for now.
Outlook: With the Fed’s dot plot now tilted toward a possible hike, expect jumbo rates to hold in the mid-6% range or drift slightly higher through Q3 absent a clear downside inflation surprise.
Investor Insights
Currency and International Demand
As in Manhattan, the FX backdrop has reversed from earlier in the year: the U.S. dollar has strengthened, with the dollar index breaking above 100 in June — its highest level since May 2025 — after the ECB’s June 11 rate hike was outweighed by a more hawkish Federal Reserve. EUR/USD has eased to roughly 1.14–1.15 and GBP/USD sits near 1.34. Brooklyn draws a smaller share of international buyers than Manhattan, so this shift is a secondary factor here, but it does modestly reduce the currency-driven appeal of Brooklyn’s new-development pipeline for European and UK capital relative to earlier in 2026.
Domestic Investors and Yield
Brooklyn’s combination of accelerating per-foot appreciation (+6.7% YoY) and a meaningfully lower entry price than Manhattan continues to support a compelling rental-yield and capital-growth case. At a $3,895 median asking rent against a $1.04M median sale price, the rent-versus-buy math remains more favorable in Brooklyn than in Manhattan, even after accounting for June’s firmer mortgage-rate backdrop.
New This Month: The Investor Yield Map
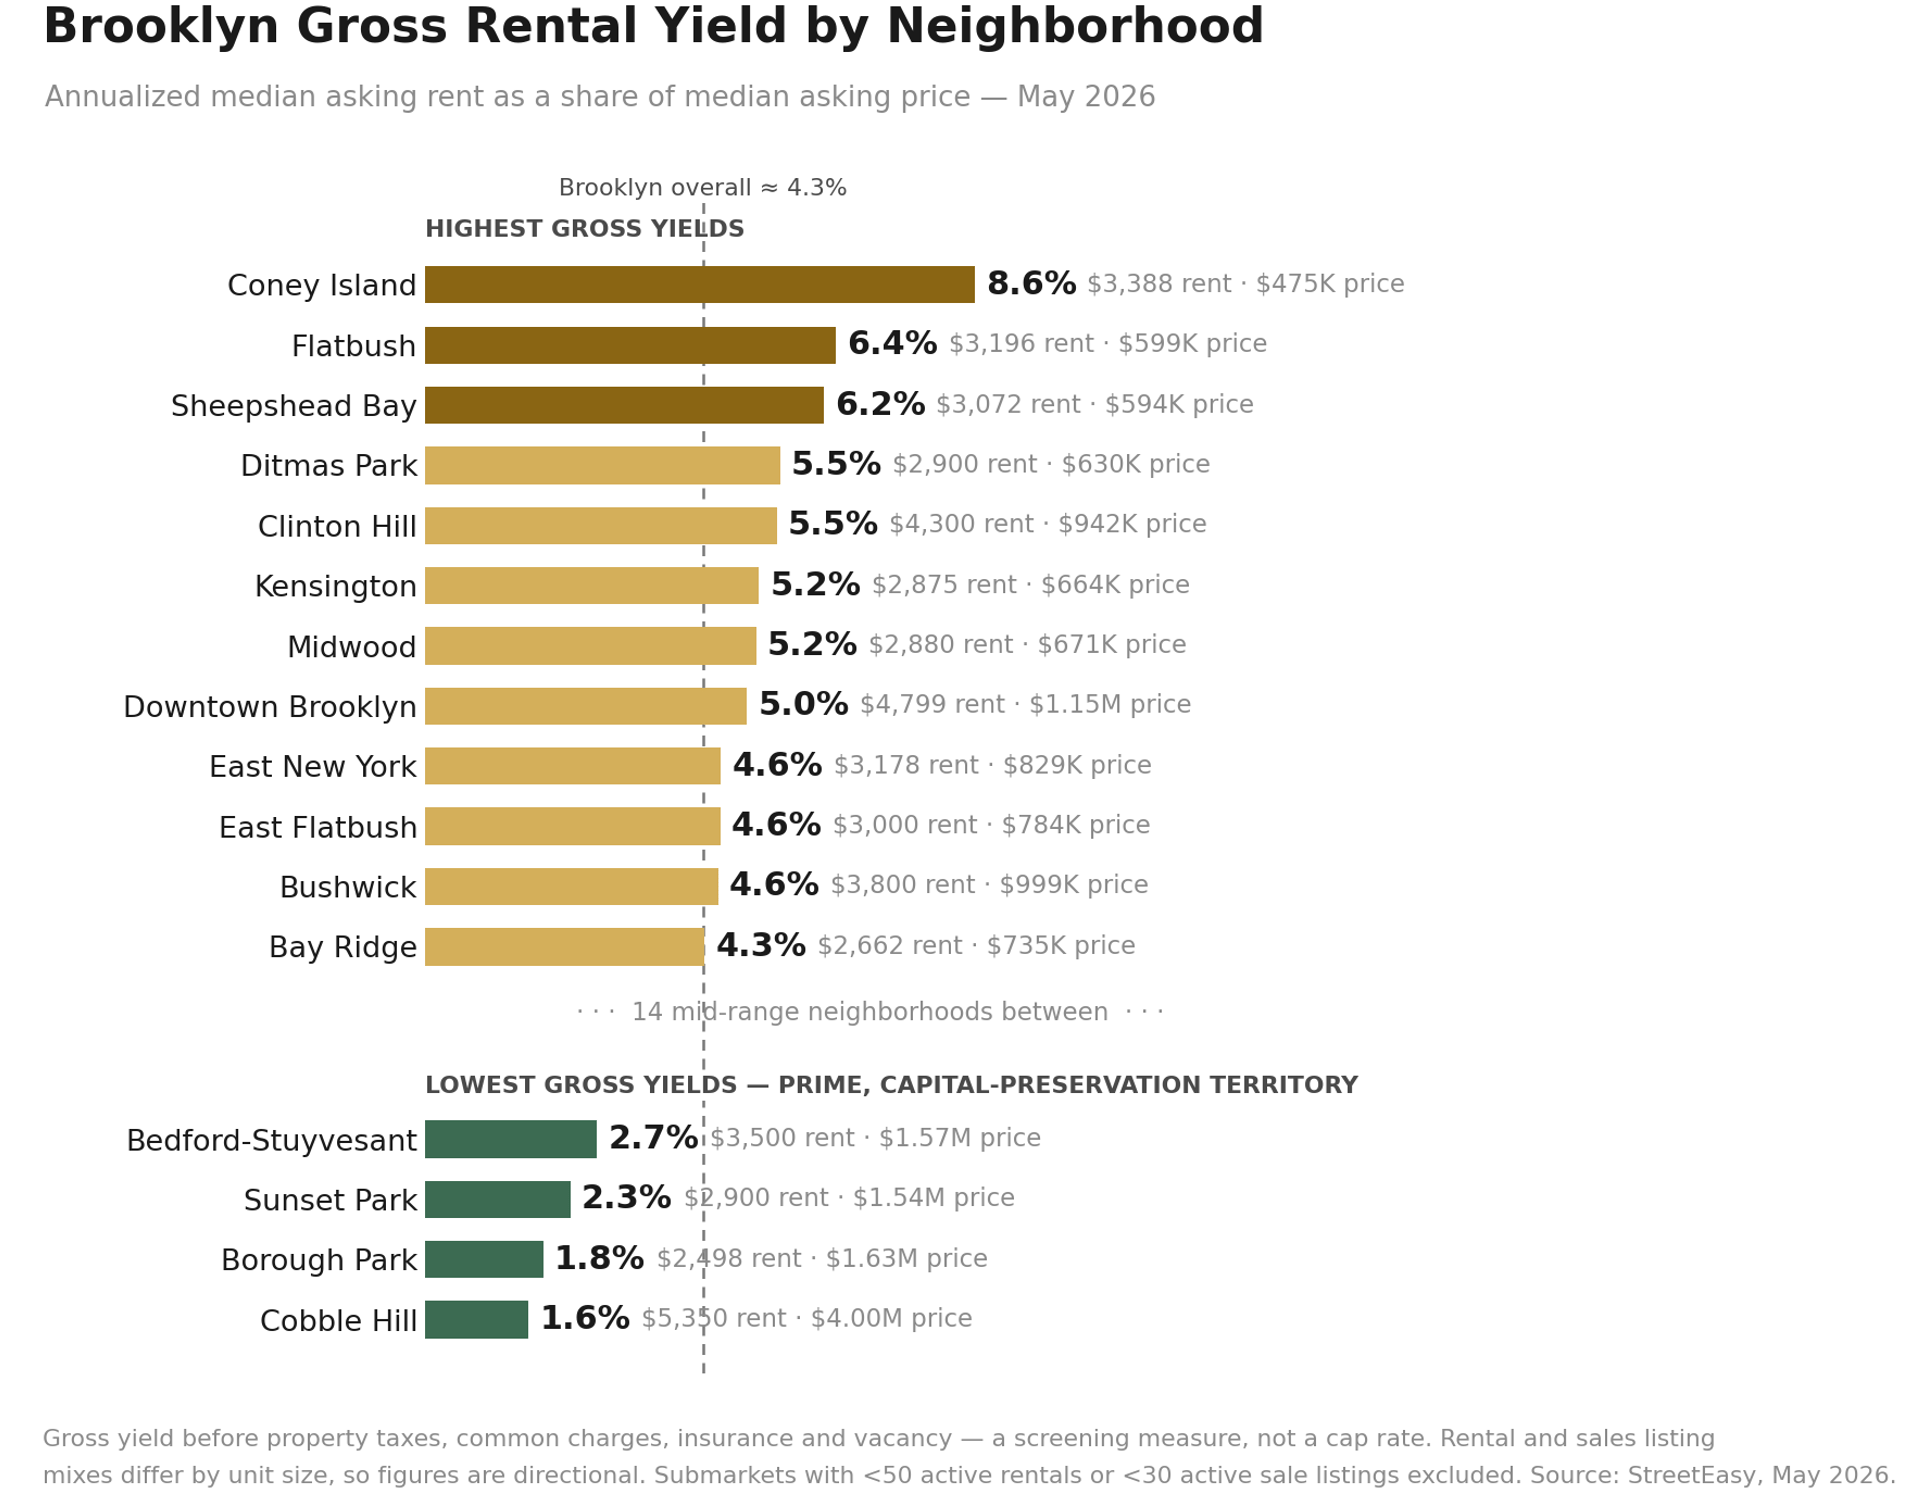
For the first time in this report, we have mapped gross rental yield — annualized median asking rent as a share of median asking price — across every Brooklyn submarket with meaningful listing depth, and the result is sharper than Manhattan’s map: the borough screens at roughly 4.3% gross, marginally above Manhattan, but with a far wider spread underneath. Coney Island tops the entire city at 8.6% gross ($3,388 median rent against a $475K median ask), followed by a southern value corridor — Flatbush (6.4%), Sheepshead Bay (6.2%) and Ditmas Park (5.5%) — where entry prices around $600K carry rents near $3,000.
The most interesting single reading is Clinton Hill at 5.5%: a prime-adjacent brownstone neighborhood delivering yields normally found much deeper in the borough. At the bottom, Cobble Hill (1.6%) posts the lowest qualifying reading in either borough — brownstone-belt sale prices against apartment rents — alongside Borough Park (1.8%) and Sunset Park (2.3%), where townhouse-heavy sale stock produces the same compression. That mix effect is real, but so is the premium buyers pay for those blocks.
The Brooklyn PPSF Story
Brooklyn’s median PPSF has appreciated from a post-financial-crisis trough near $700/sf in the mid-2010s to a sustained $900–$1,100 range over the past several years, currently $1,084. Unlike Manhattan’s decade-long plateau, Brooklyn’s PPSF trajectory has been more actively upward — consistent with the borough’s ongoing re-rating as a primary destination rather than a Manhattan alternative. June’s 6.7% annual gain, the strongest pricing signal in either borough this month, confirms that trajectory remains intact.
References
1. Sales and pricing data — Supply, Demand, PPSF, Listing Discount, Median Sale Price, Days on Market, Leverage Index inputs: UrbanDigs, June 2026 actuals.
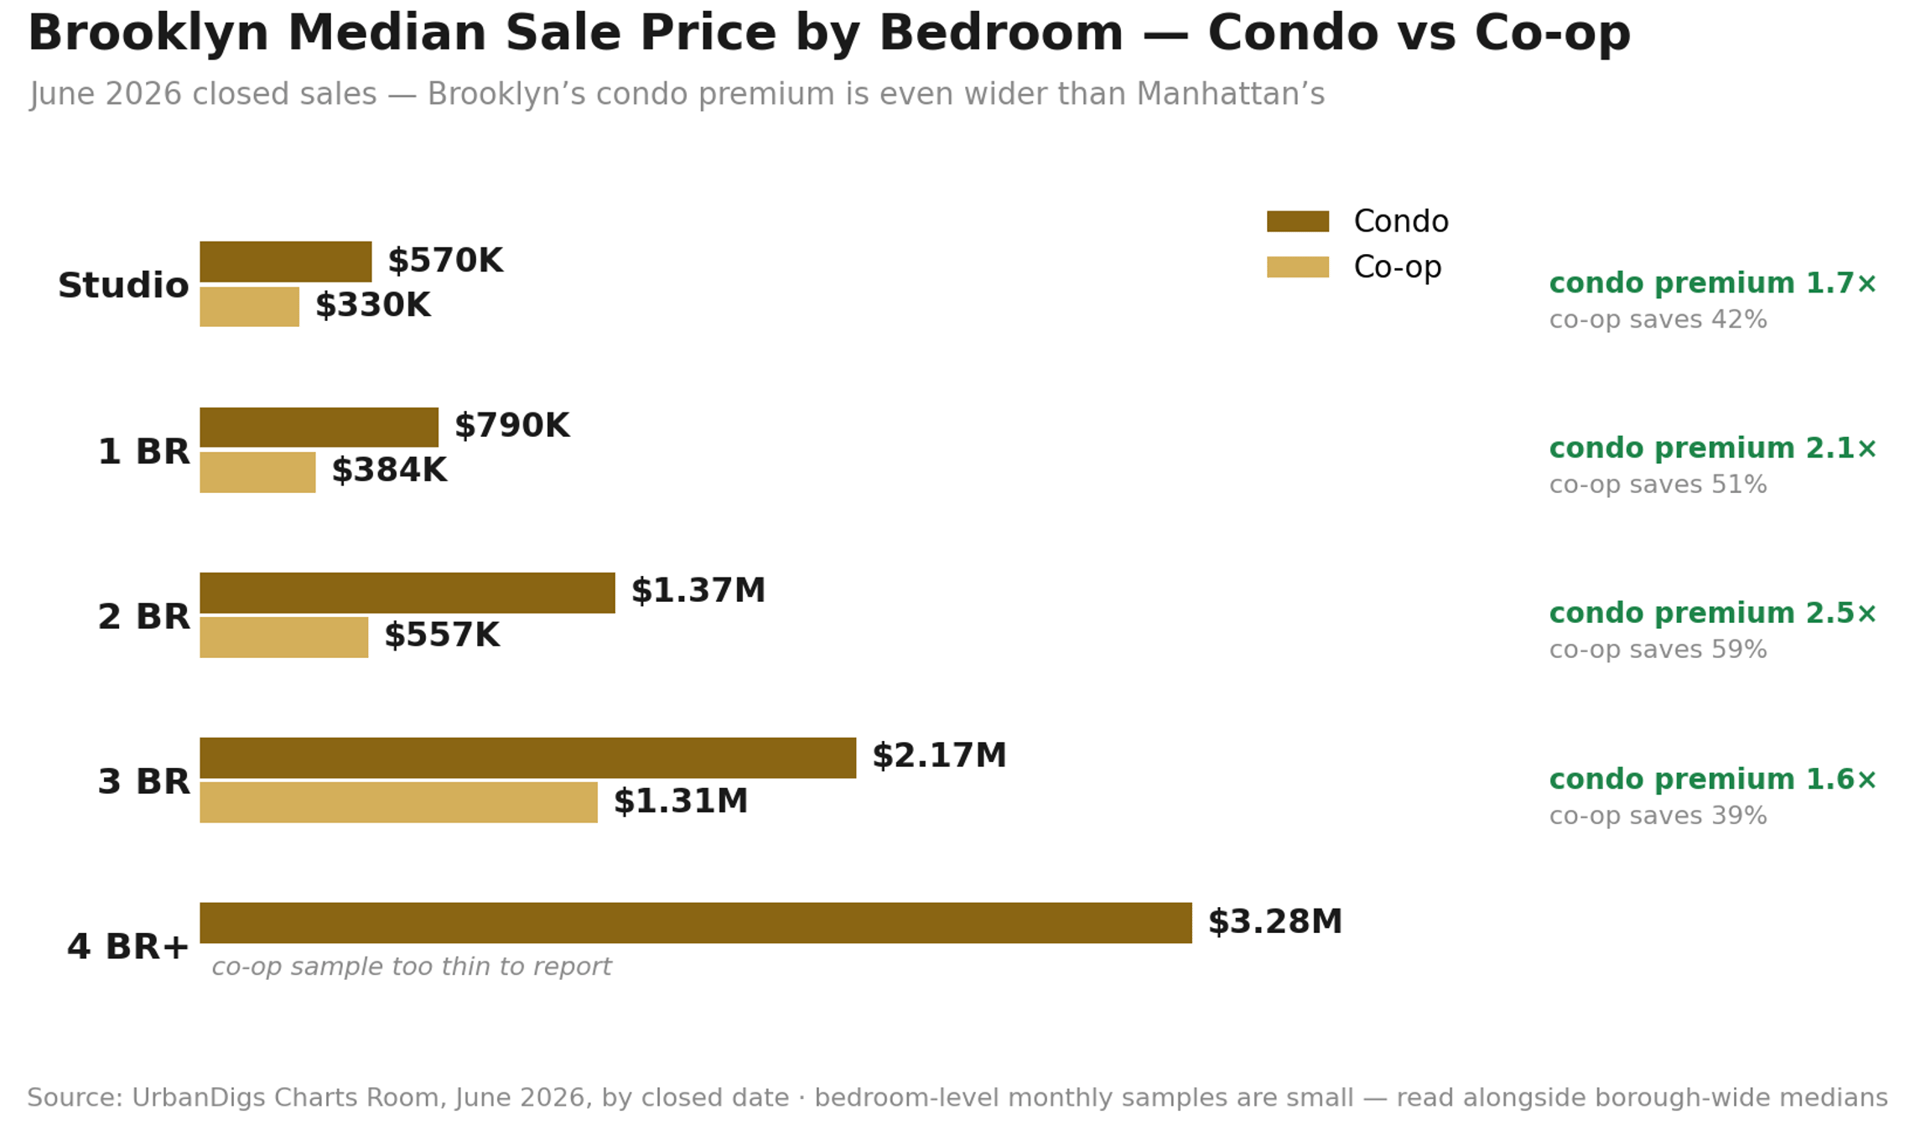
2. Bedroom-level median sale price (Condo and Co-op): UrbanDigs Charts Room, 5-year monthly series, by closed date.
3. Rental data (asking rent, inventory, discount share, neighborhood table): StreetEasy Market Data, May 2026 release.
4. Sales cross-check by neighborhood: StreetEasy Market Data, May 2026 release.
5. Mortgage rate data: Optimal Blue via Federal Reserve Bank of St. Louis (FRED); Bank of America, Chase, Wells Fargo.
6. Federal Reserve policy: Federal Reserve Board, FOMC statement, June 17, 2026. https://www.federalreserve.gov/newsevents/pressreleases/monetary20260617a.htm
7. Currency data: EUR/USD, GBP/USD, and U.S. Dollar Index market data, as of late June 2026.
8. Gross rental yield: annualized StreetEasy median asking rent ÷ median asking price, by neighborhood, May 2026 release. Screening measure; thin submarkets excluded (see chart footnote).