
Brooklyn Market Pulse ¹ — June 2026
Demand Surges, Sellers in Control
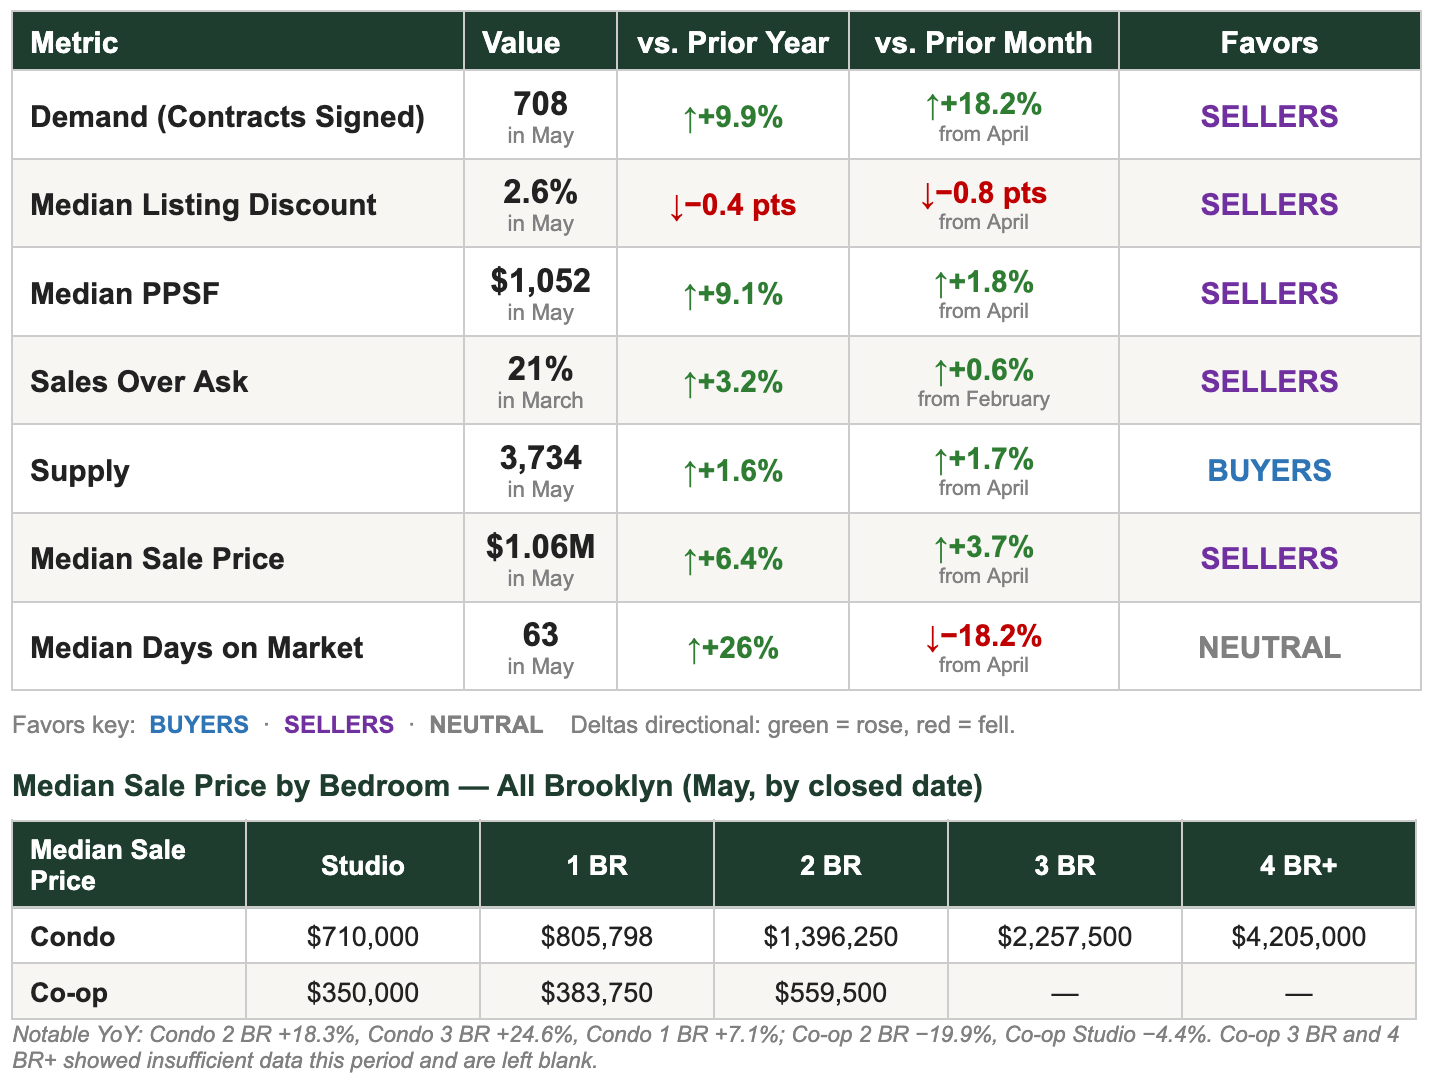
Brooklyn's spring market accelerated in May. Contracts jumped +18.2% from April and +9.9% year-over-year, median price per square foot climbed to $1,052 (+9.1% YoY), and 21% of recent sales closed above ask. With listing discounts at just 2.6% and days-on-market falling sharply, the borough is firmly seller-leaning — even as overall activity sits modestly below its own seasonal average.
Bottom line: Brooklyn ran hot in May — contracts up 18% on the month, per-foot prices up 9% on the year, and just 2.6% negotiating room, among the tightest in the city. The nuance worth watching: a couple of forward indicators (the UrbanDigs Market Pulse and flat year-over-year pending sales) suggest the borough may be near its seasonal ceiling rather than still climbing.
MARKET SNAPSHOT: FIVE NUMBERS THAT MATTER
-
708 contracts signed in May — up +18.2% from April and +9.9% year-over-year. Demand accelerated on both axes.
-
3,734 active listings — up 1.7% from April and 1.6% YoY. Inventory is building modestly off a historically lean base.
-
$1.06M median sale price — up +6.4% YoY and +3.7% from April. Appreciation is broad-based.
-
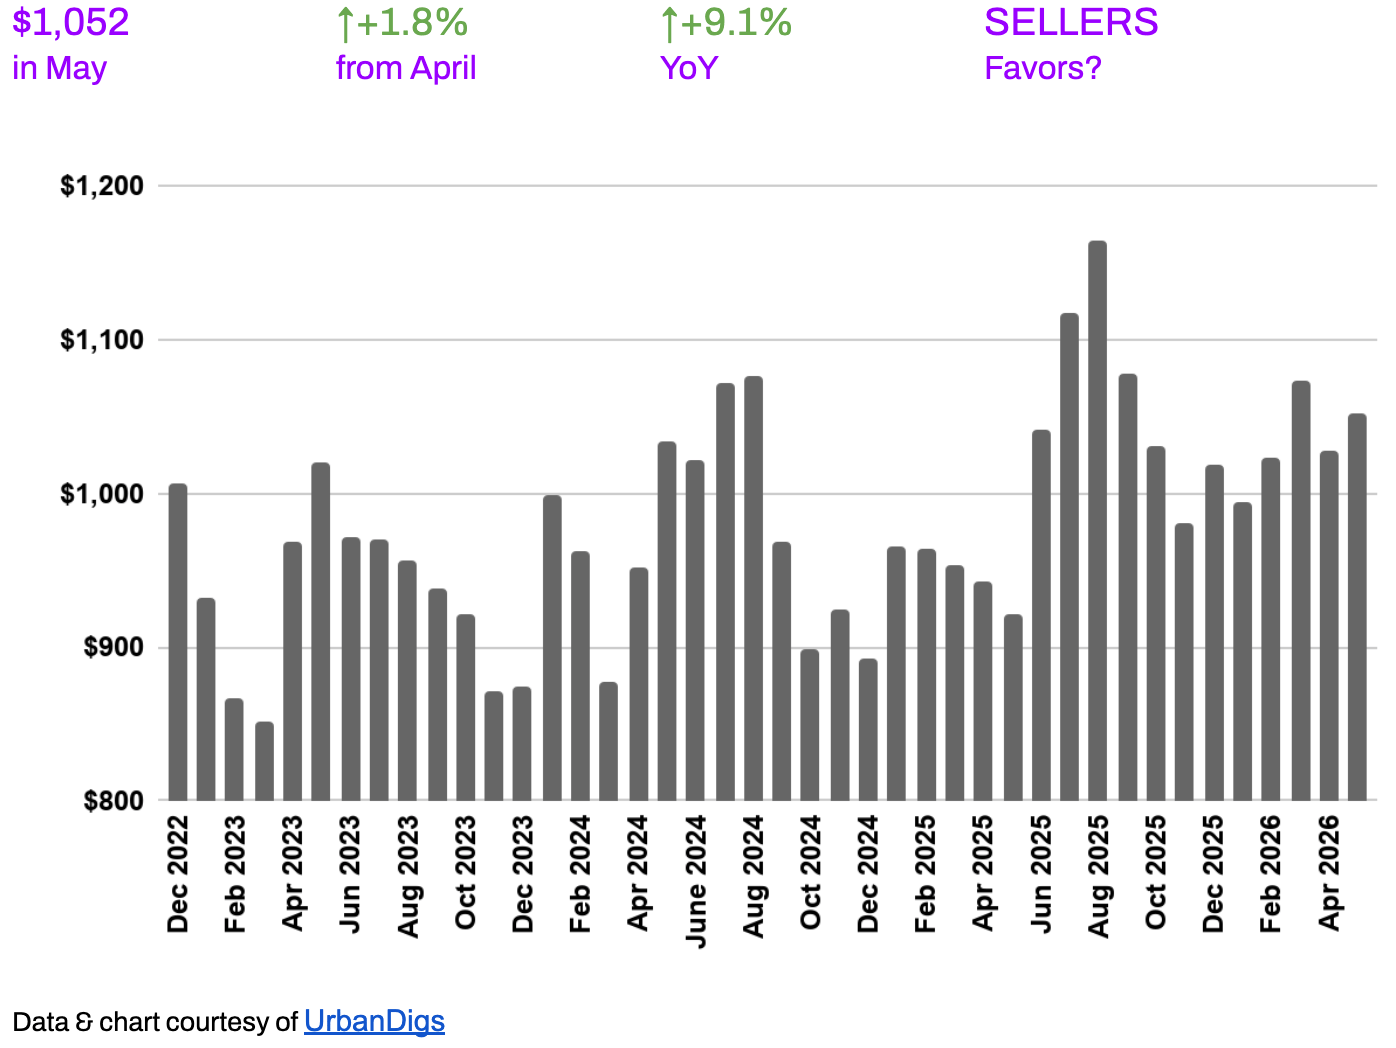
$1,052 median price per square foot — up +9.1% YoY and +1.8% from April. Per-foot pricing is firmly higher.
-
2.6% median listing discount — down 0.8 pts from April and 0.4 pts YoY. Among the tightest negotiating margins in the metro.
KEY TAKEAWAYS
-
Demand surged: 708 contracts, +18.2% MoM and +9.9% YoY — rising on both axes, a clean seller signal.
-
PPSF at $1,052 is up +9.1% YoY — Brooklyn per-foot pricing is outpacing Manhattan's growth rate this month.
-
Median sale price $1.06M, up +6.4% YoY — steady, broad appreciation.
-
Listing discounts compressed to 2.6% — among the tightest in the metro; well-priced listings clear fast.
-
21% of sales (March data) closed above ask, +3.2 pts YoY — intense competition for desirable product.
-
Days on market fell to 63 (−18.2% MoM) though still +26% YoY — a sharp seasonal acceleration.
-
Counter-signal: the UrbanDigs Market Pulse reads −0.4 (below seasonal averages), and pending sales are flat YoY (−0.5%) despite a +22% MoM jump — strong, but possibly near a seasonal ceiling.
OUTLOOK
Brooklyn enters summer firmly seller-leaning: demand, pricing, and competition are all up year-over-year, and negotiating room is among the tightest in the metro. The watch items are the slightly-below-seasonal Market Pulse and flat YoY pending sales — signs that, while strong, the market may be near its seasonal ceiling rather than still accelerating.
For sellers: conditions are excellent for well-prepared, accurately priced listings — many are clearing above ask.
For buyers: leverage is limited; lead with clean, competitive offers on the right asset rather than waiting for discounts that aren't materializing.

Photo by Rihards Gederts | Howard Hanna NYC
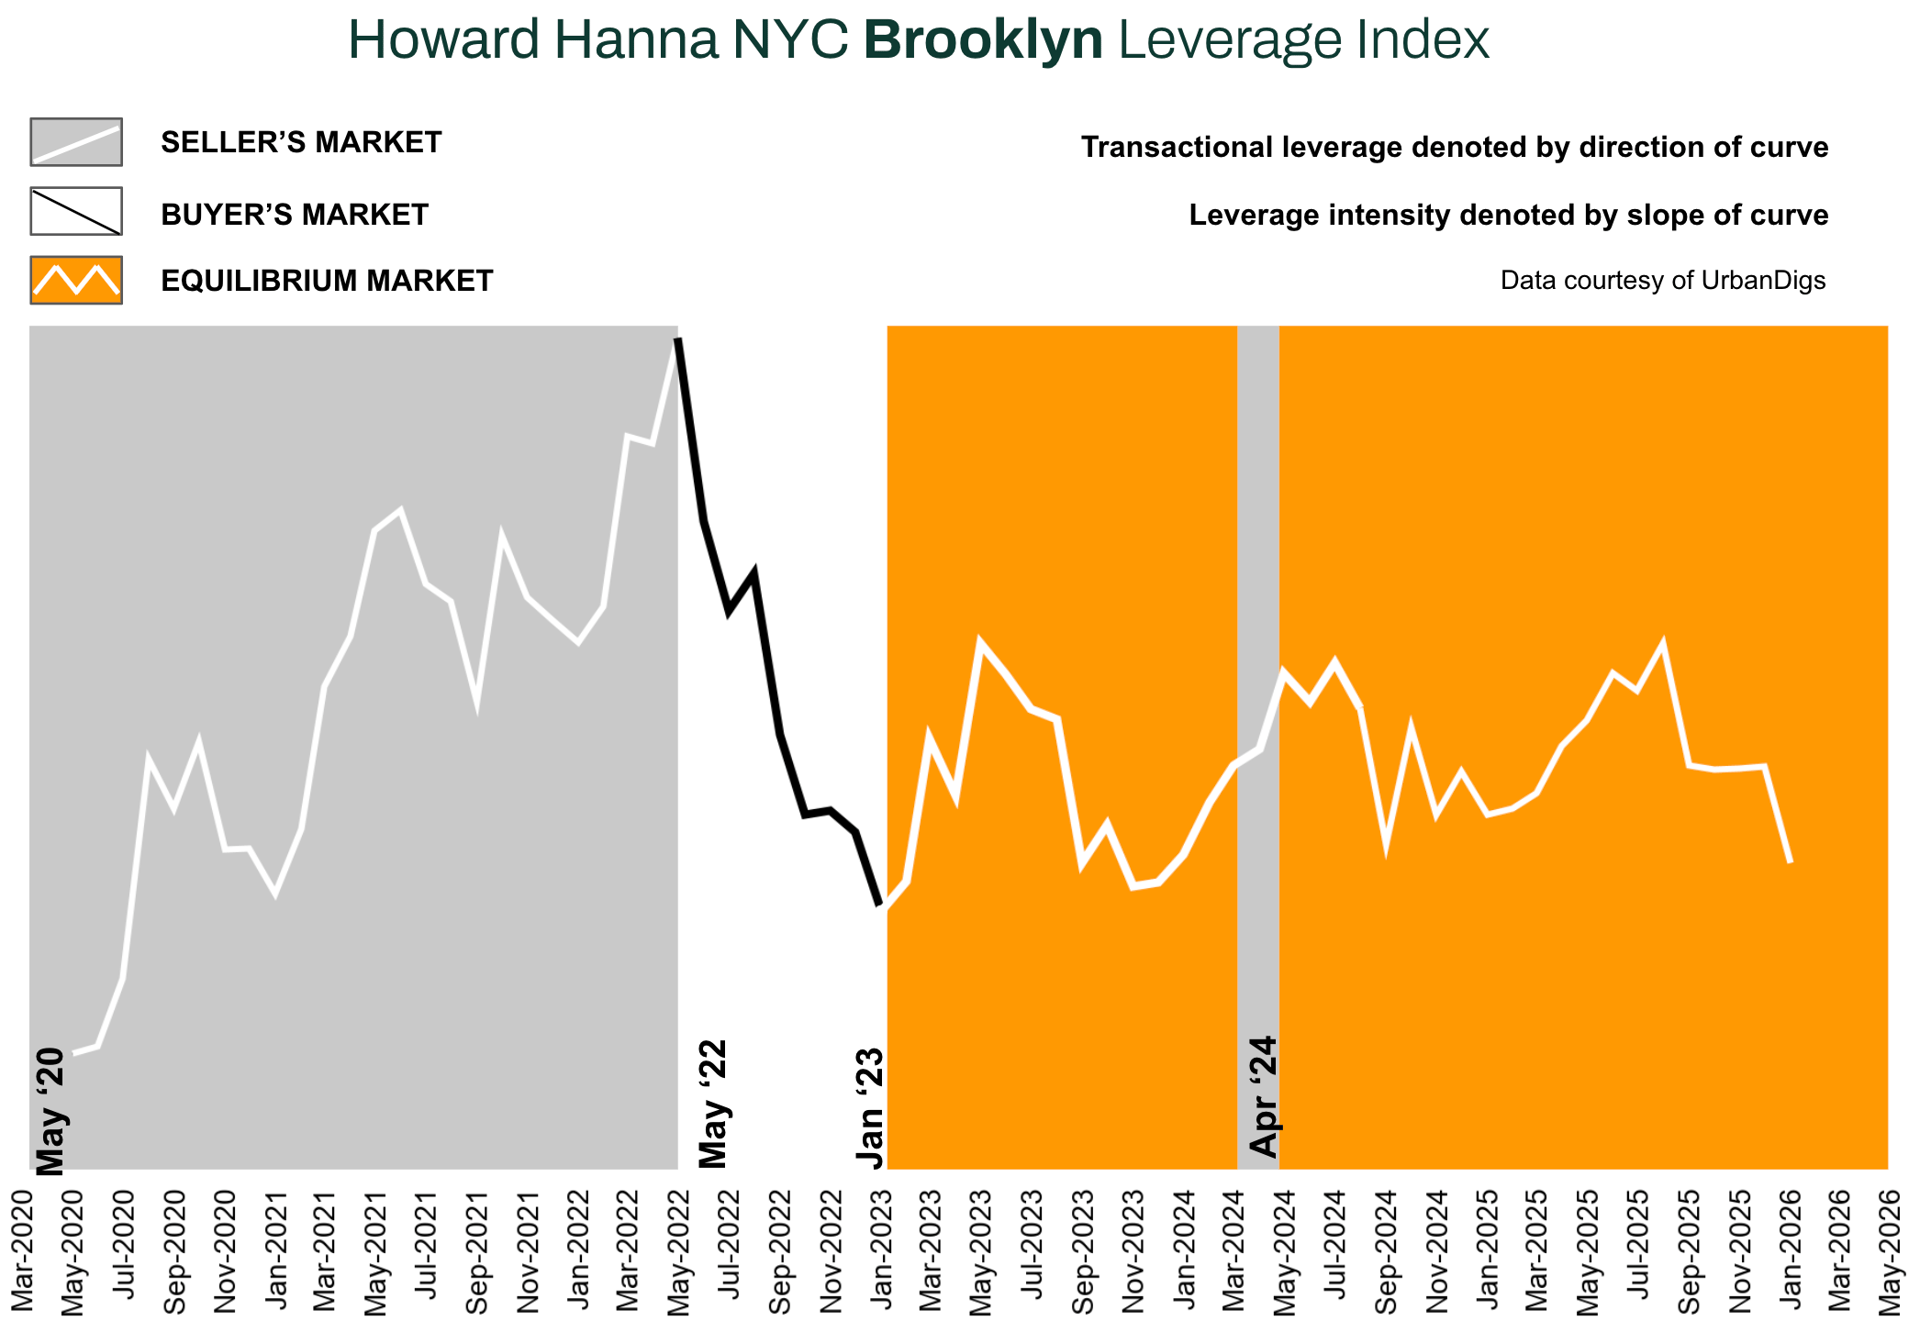
Howard Hanna NYC Brooklyn Leverage Index
The Howard Hanna NYC Brooklyn Leverage Index² blends four market signals - supply, demand, median price per square foot, and median listing discount - to capture the balance of power between buyers and sellers.
Direction Matters:
-
An upward-sloping curve = seller’s market
-
A downward-sloping curve = buyer’s market
-
The steeper the slope, the stronger the advantage for either side
In May 2026, all four core signals point seller-leaning: demand rose on both axes (+18.2% MoM, +9.9% YoY), PPSF firmed (+9.1% YoY), discounts compressed to 2.6%, and supply remains historically lean despite a slight uptick. The net read is a clearly upward, seller-leaning slope — firmer than Manhattan's this month. The lone caution is the slightly-below-seasonal Market Pulse (−0.4), which suggests a strong market that may be near a seasonal ceiling.
Brooklyn Supply
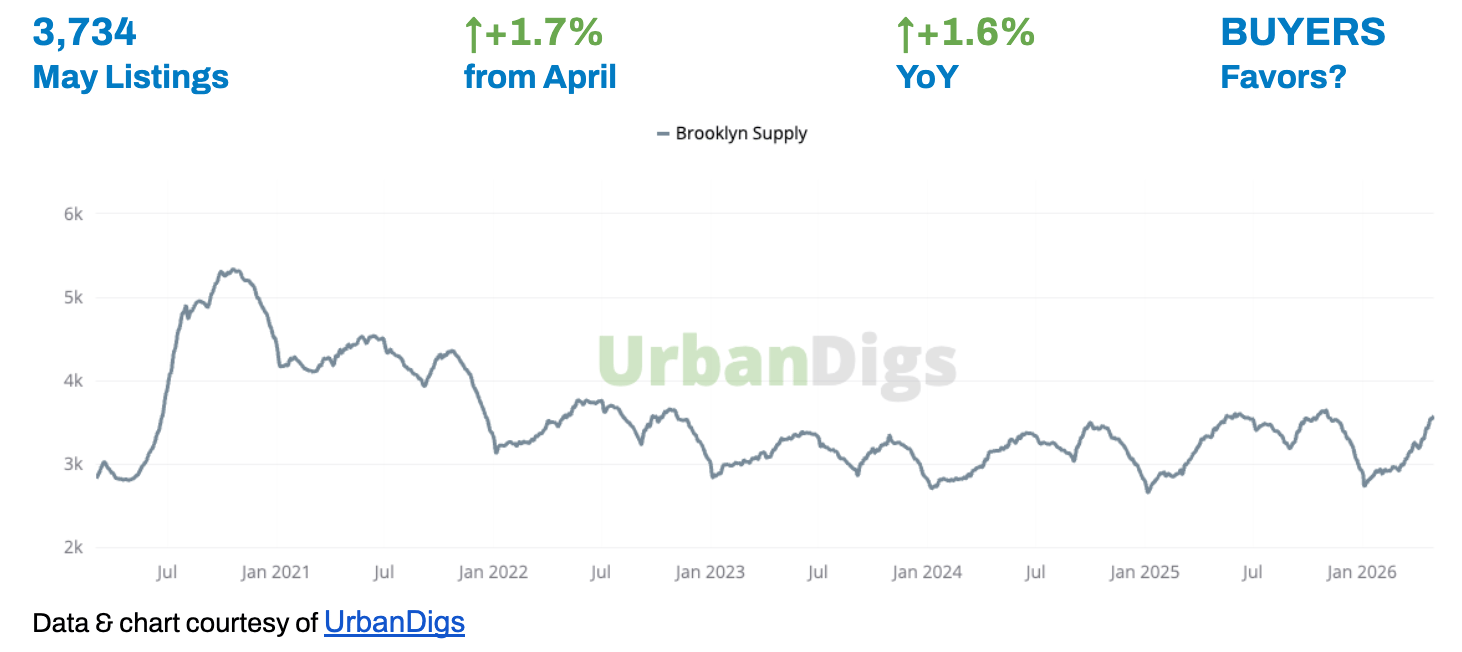
SUPPLY BUILDS MODESTLY OFF A LEAN BASE
Active listings rose +1.7% from April to 3,734 in May, also +1.6% YoY — both axes up, the one metric leaning buyer this month. But the increase is marginal and Brooklyn inventory remains historically low. New listings fell to 1,008 (−11.5% MoM), net inventory contracted (−13), and months of inventory is just 4.0.
Because both axes agree (rising), supply tilts modestly BUYERS — though the margin is slim and easily reversed by the surging demand.
🟦 Buyers: A touch more selection than a year ago, but the absolute pool is still thin — don't expect inventory to create leverage on its own.
🟪 Sellers: Competing inventory is barely higher YoY; with demand surging, well-priced listings still clear quickly.
Outlook: Expect modest seasonal building through summer.
Brooklyn Demand
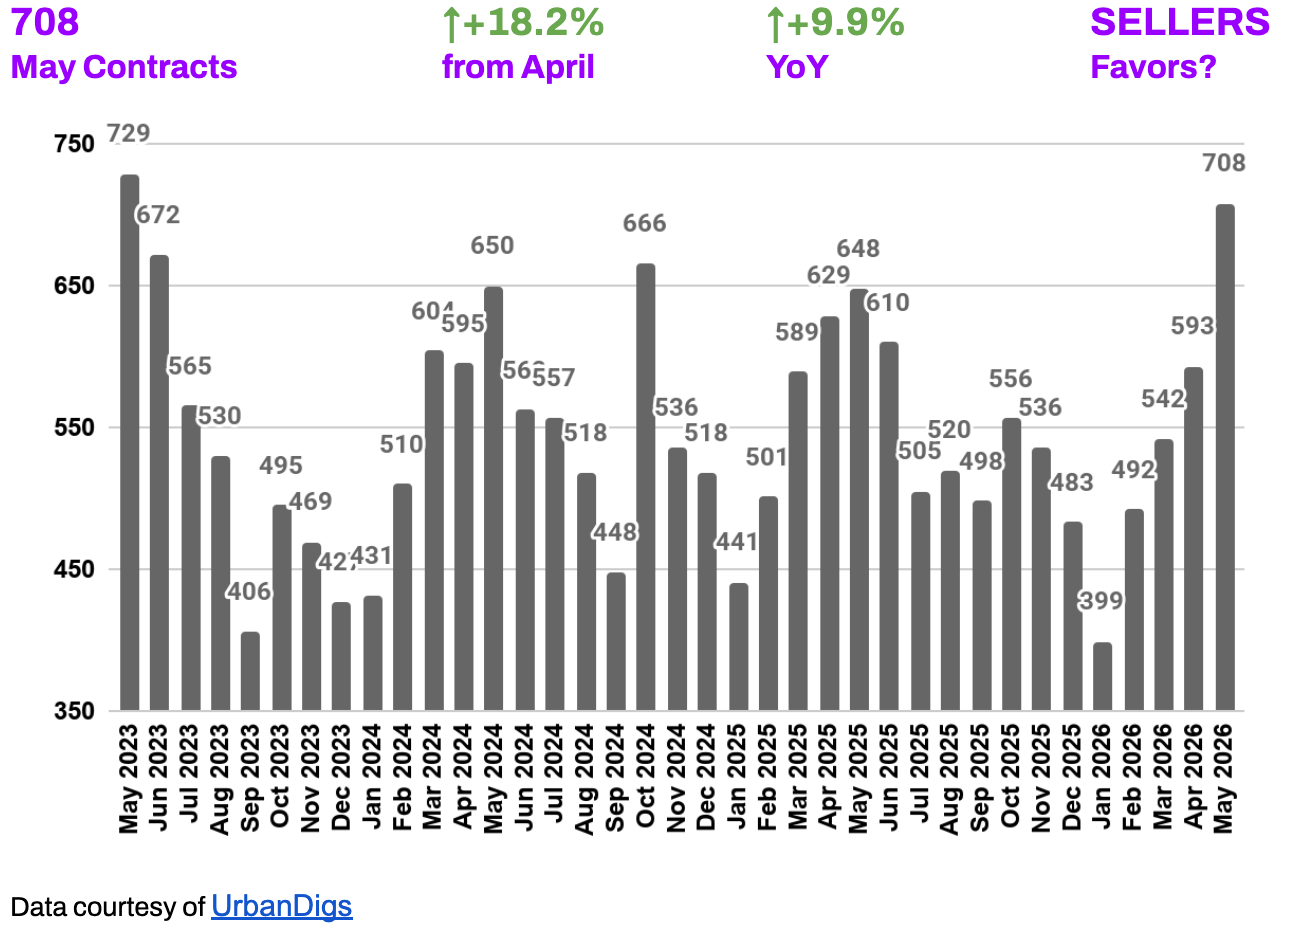
DEMAND SURGES — UP 18% ON THE MONTH
May brought 708 signed contracts — up +18.2% from April and +9.9% YoY, rising sharply on both axes. Rising demand on both axes is a clean seller signal.
Pending sales jumped +22% MoM to 2,115, though they sit roughly flat YoY (−0.5%) — the surge is strong but concentrated in the current month rather than building over last year.
🟦 Buyers: Competition is intensifying — the spring window is fully open and waiting carries real cost.
🟪 Sellers: Demand is rising on both axes and discounts are thin; properly priced listings are clearing fast, often above ask.
Outlook: Activity should hold near these levels into summer, though flat YoY pending sales suggest the borough may be near its seasonal peak rather than still accelerating.
Brooklyn Median PPSF
PER-FOOT PRICING FIRM — UP 9% YOY
Median price per square foot reached $1,052 in May, up +1.8% from April and +9.1% YoY — firm on both axes and well ahead of Manhattan's growth rate this month. Brooklyn per-foot pricing has trended steadily higher over the past decade and has held above the $1,000 threshold on a sustained basis.
🟦 Buyers: Per-foot value is rising — leverage is limited; focus on asset quality and location rather than waiting for price relief.
🟪 Sellers: Strong per-foot momentum supports confident, market-aligned pricing; premium product is achieving top results.
Outlook: With demand surging and supply lean, PPSF should stay firm through summer absent a rate or confidence shock.
Brooklyn Median Listing Discount
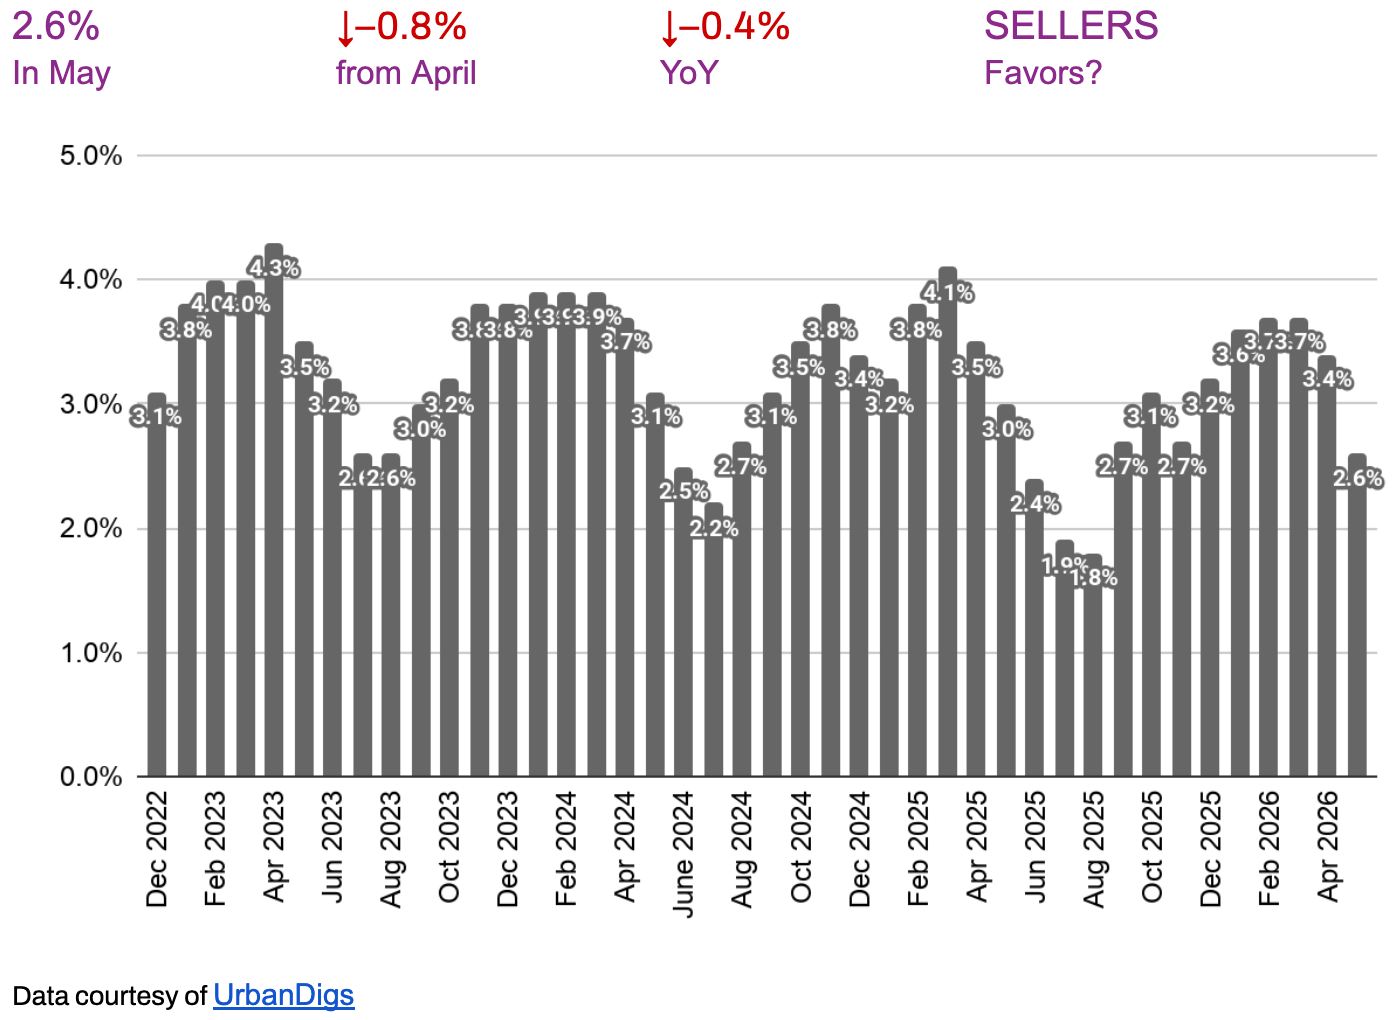
NEGOTIATING ROOM AMONG THE TIGHTEST IN THE METRO — 2.6%
The median listing discount compressed to 2.6% in May — down 0.8 pts from April and 0.4 pts YoY, among the tightest readings in the metro. With 21% of recent sales closing above ask, the gap between list and trade has nearly closed for well-priced inventory.
🟦 Buyers: There is very little room to negotiate — lead with a credible, clean offer rather than a deep opening cut.
🟪 Sellers: Pricing power is strong; accurate pricing is converting at or above ask. Don't over-pad the list price.
Outlook: With demand surging and supply lean, expect discounts to stay in the low-to-mid 2% range near term.
RENTAL REMARKS
RENTS FIRM, INVENTORY TIGHTENS — ASKING UP 6.8% YOY
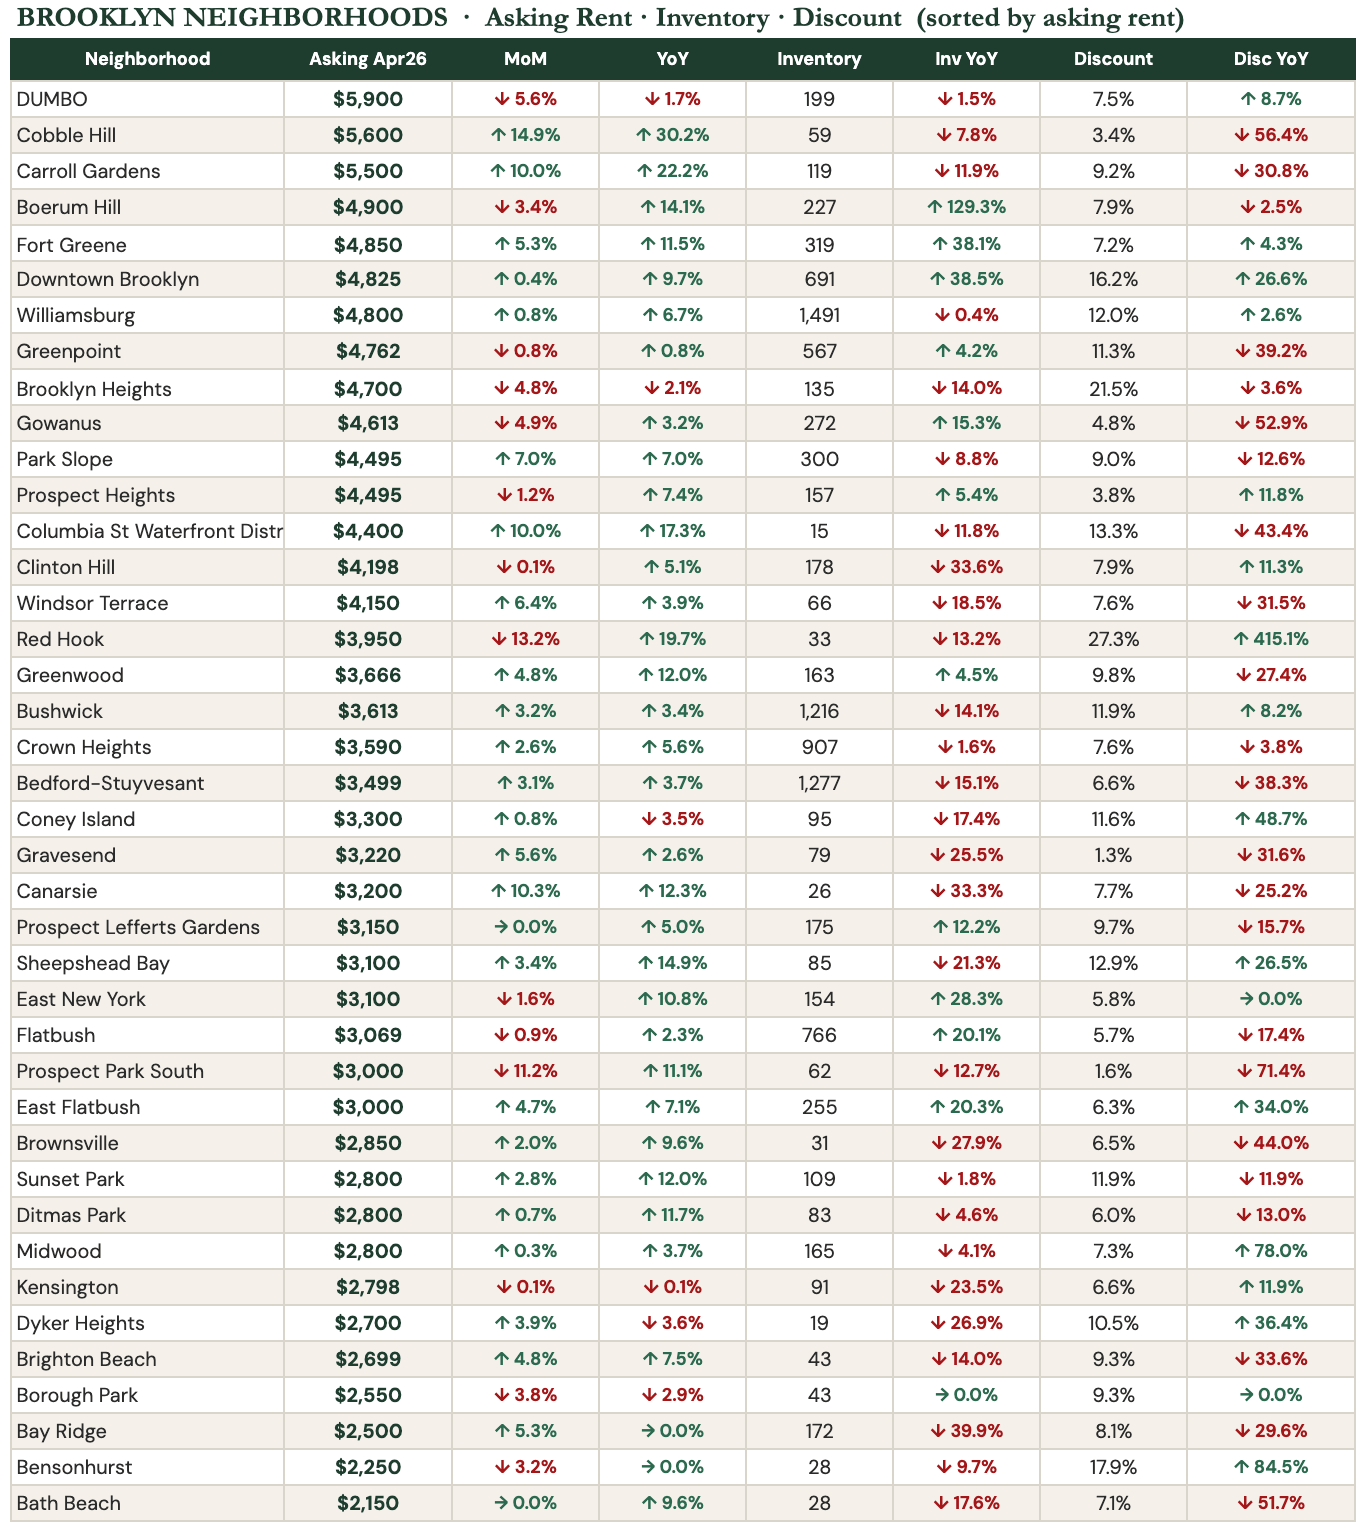
Brooklyn's median asking rent reached $3,845 in April — up 2.5% from March and 6.8% year-over-year. Active rental inventory fell 2.0% year-over-year to 10,920 units, and the share of listings cutting price dropped sharply to just 9.4% (−8.7% YoY) — among the lowest discount shares in the city and a clear sign of firm demand.
Prime brownstone Brooklyn leads on price: DUMBO ($5,900), Cobble Hill ($5,600), and Carroll Gardens ($5,500). The most negotiating room sits in Red Hook (27% of listings discounted), Brooklyn Heights (22%), and Downtown Brooklyn (16%). Bedford-Stuyvesant ($3,499), Crown Heights ($3,590), and Bushwick ($3,613) anchor the accessible mid-market.
🟦 For Renters: Tight, but slightly more negotiable than Manhattan. Inventory is down 2.0% YoY and only 9.4% of listings are cutting price — move decisively. Red Hook, Brooklyn Heights, and Downtown Brooklyn offer the most room to negotiate.
🟪 For Landlords: Favorable. Asking rents are up 6.8% YoY, inventory is tightening, and price cuts are rare (9.4% discount share, down sharply YoY). Demand is firm heading into peak season.
Outlook: Landlord-leaning through summer 2026. The StreetEasy Rental Price Index is up 4.6% YoY with the 13-month uptrend intact. As in Manhattan, the main risk is mortgage-rate relief pulling renters toward buying; absent that, rents stay firm through at least Q3 2026.
Source: StreetEasy Market Data, April 2026 release (full-market asking inventory) · median asking rent, active rental inventory, discount share.³
MORTGAGE REMARKS
RATES HOLD NEAR 6.6% — A REAL FACTOR FOR BROOKLYN BUYERS
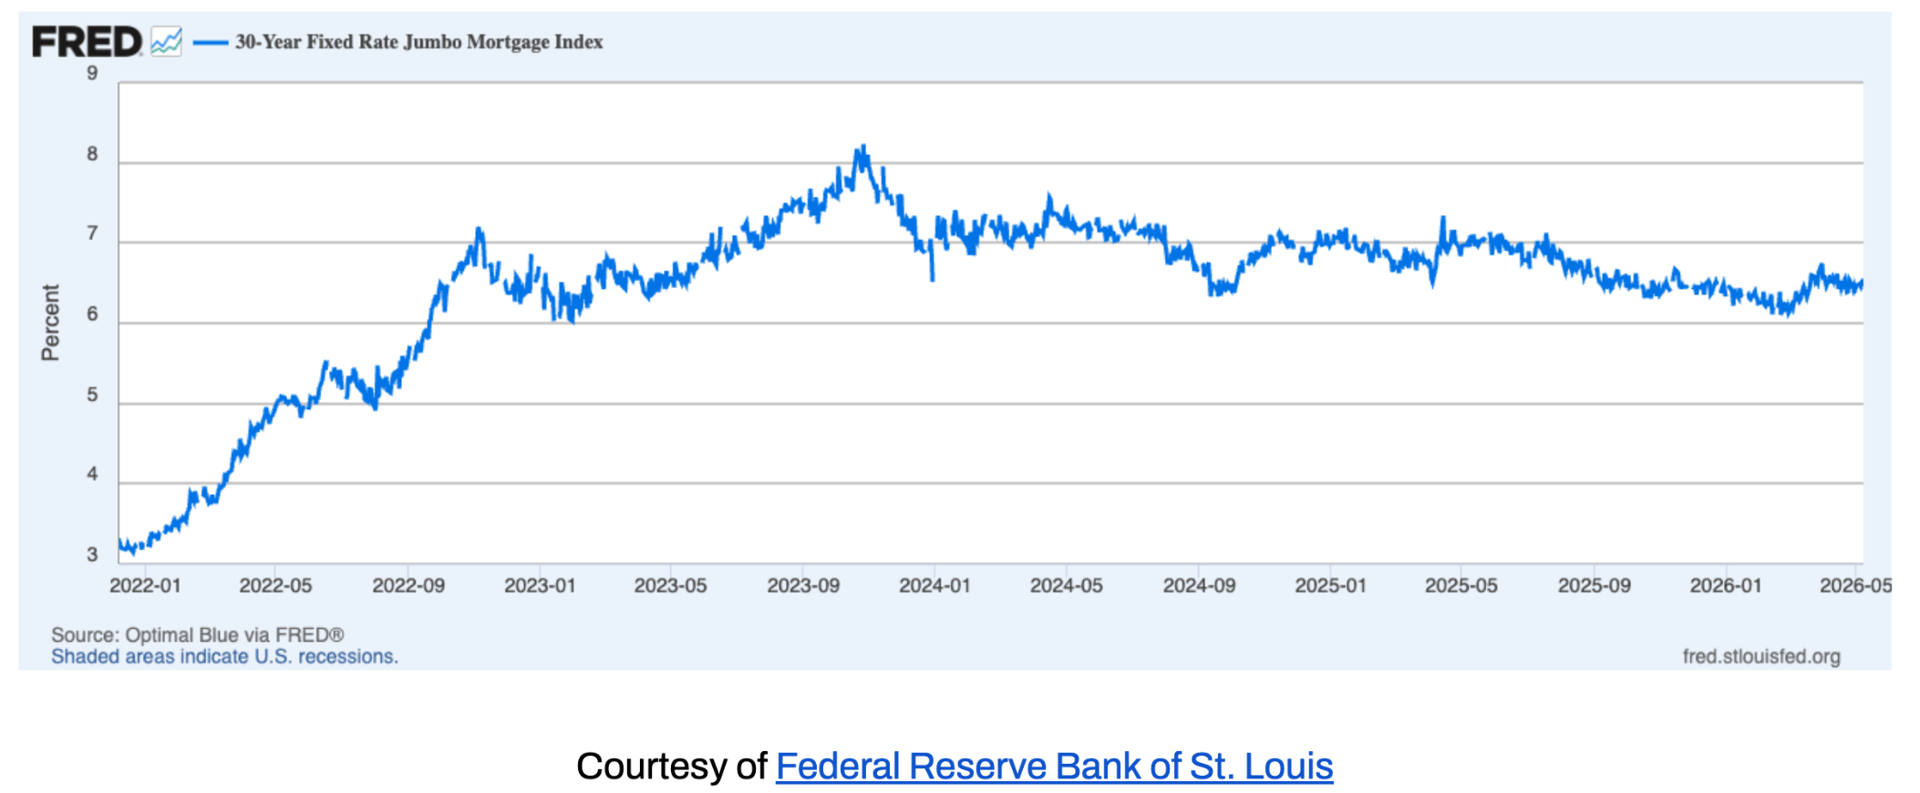
Average 30-year jumbo rates were hovering around 6.6%⁴ as of late May, with effective APRs near 6.6%⁵ — up from May and about 50 basis points above the winter low near 6.1%. Brooklyn's buyer pool is more financing-dependent than Manhattan's, so this level is a more direct constraint here.
Even so, demand surged in May despite rates — a sign of resilient underlying demand and the borough's relative affordability versus Manhattan.
🟦 Buyers: Rates are a real cost at Brooklyn price points, but the data shows buyers are transacting anyway; well-priced inventory is clearing.
🟪 Sellers: Demand strength is outrunning the rate headwind — accurately priced listings are still converting at or above ask.
Outlook: The path depends on inflation and labor data; a move toward 7% or a drift back toward 6% are both possible. Locking early on the right asset remains prudent.
INVESTOR INSIGHTS
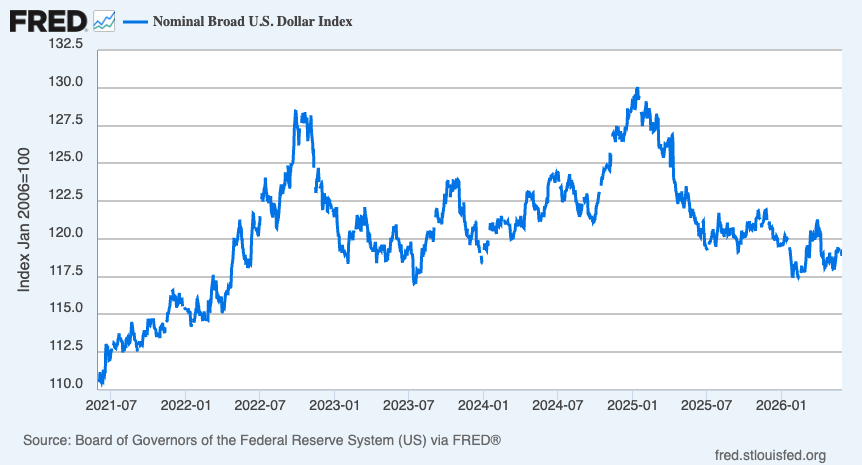
Currency and International Demand
With the U.S. dollar notably weaker against major currencies over the past year (see the Broad Dollar Index above), New York real estate is effectively cheaper for international buyers. Brooklyn draws fewer foreign buyers than Manhattan, so the FX tailwind is a secondary factor here — but it supports the high end of the borough's new-development market.
Domestic Investors and Yield
Brooklyn's combination of strong per-foot appreciation (+9.1% YoY) and relative affordability versus Manhattan continues to support a compelling rental-yield and capital-growth case. At a $3,845 median asking rent (+6.8% YoY) against a $1.06M median sale price, the rent-versus-buy math is increasingly competitive for buyers with sufficient capital.
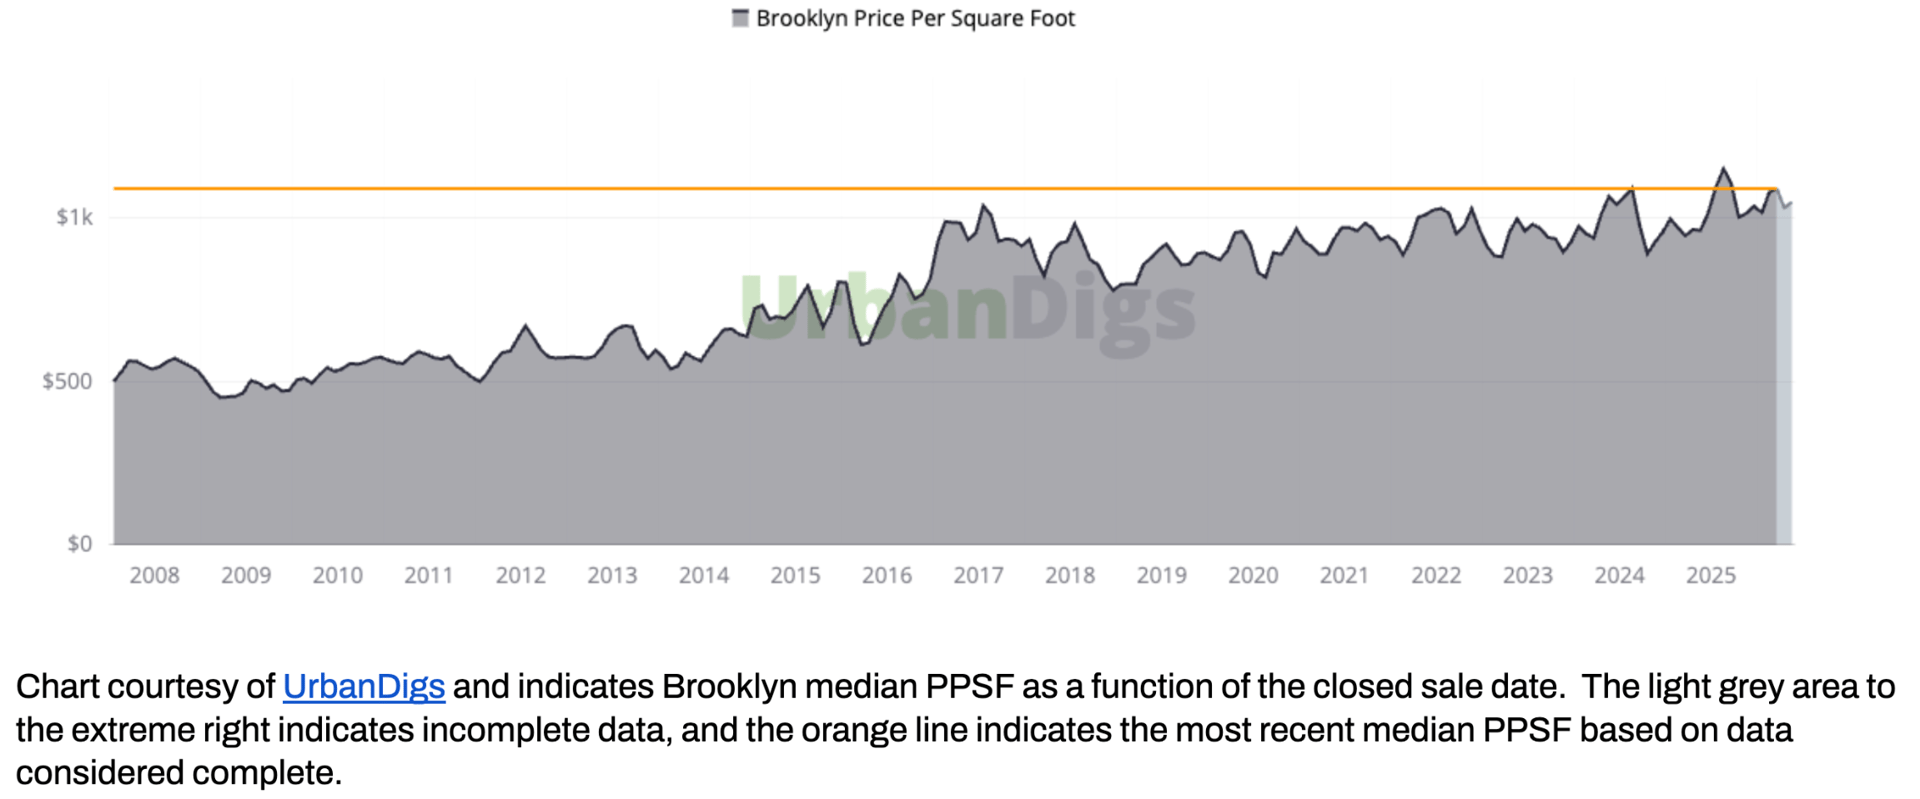
THE BROOKLYN PPSF STORY
After steadily appreciating from a post-financial-crisis trough toward $700 per square foot in the mid-2010s, Brooklyn's median PPSF has established itself in the $900–$1,100 range over the past several years — currently at $1,052, reflecting a strong May transaction mix. Unlike Manhattan, where PPSF has traded in a notably tight band for over a decade, Brooklyn's PPSF has a more active appreciation trajectory, driven by the ongoing re-rating of the borough as a premium residential destination in its own right rather than a Manhattan alternative.
References
1. Data courtesy of UrbanDigs
2. According to the Howard Hanna NYC Brooklyn Leverage Index
3. Data courtesy of StreetEasy Data Dashboard
4. Data courtesy of Federal Reserve Bank of St. Louis
5. JUMBO mortgage rate APR data courtesy of Bank of America, Chase, and Wells Fargo
6. Cover Photo by Rihards Gederts.
If you would like to chat about the most recent market activity,
feel free to contact us at [email protected] or connect with one of our Advisors.
Howard Hanna NYC brings the nation’s largest independent and family-owned brokerage to New York City, uniting the strength of a national network with the insight and sophistication of a local firm. Formed through joining forces with Elegran Real Estate, Howard Hanna NYC delivers a seamless, full-service experience backed by more than 15,000 agents across 500 offices in 14 states. The firm’s forward-thinking, agent-first culture continues to shape the future of real estate across Manhattan and the Tri-State area.Learn more at www.howardhannanyc.com.