Spring 2026: A Market Finding Its Footing
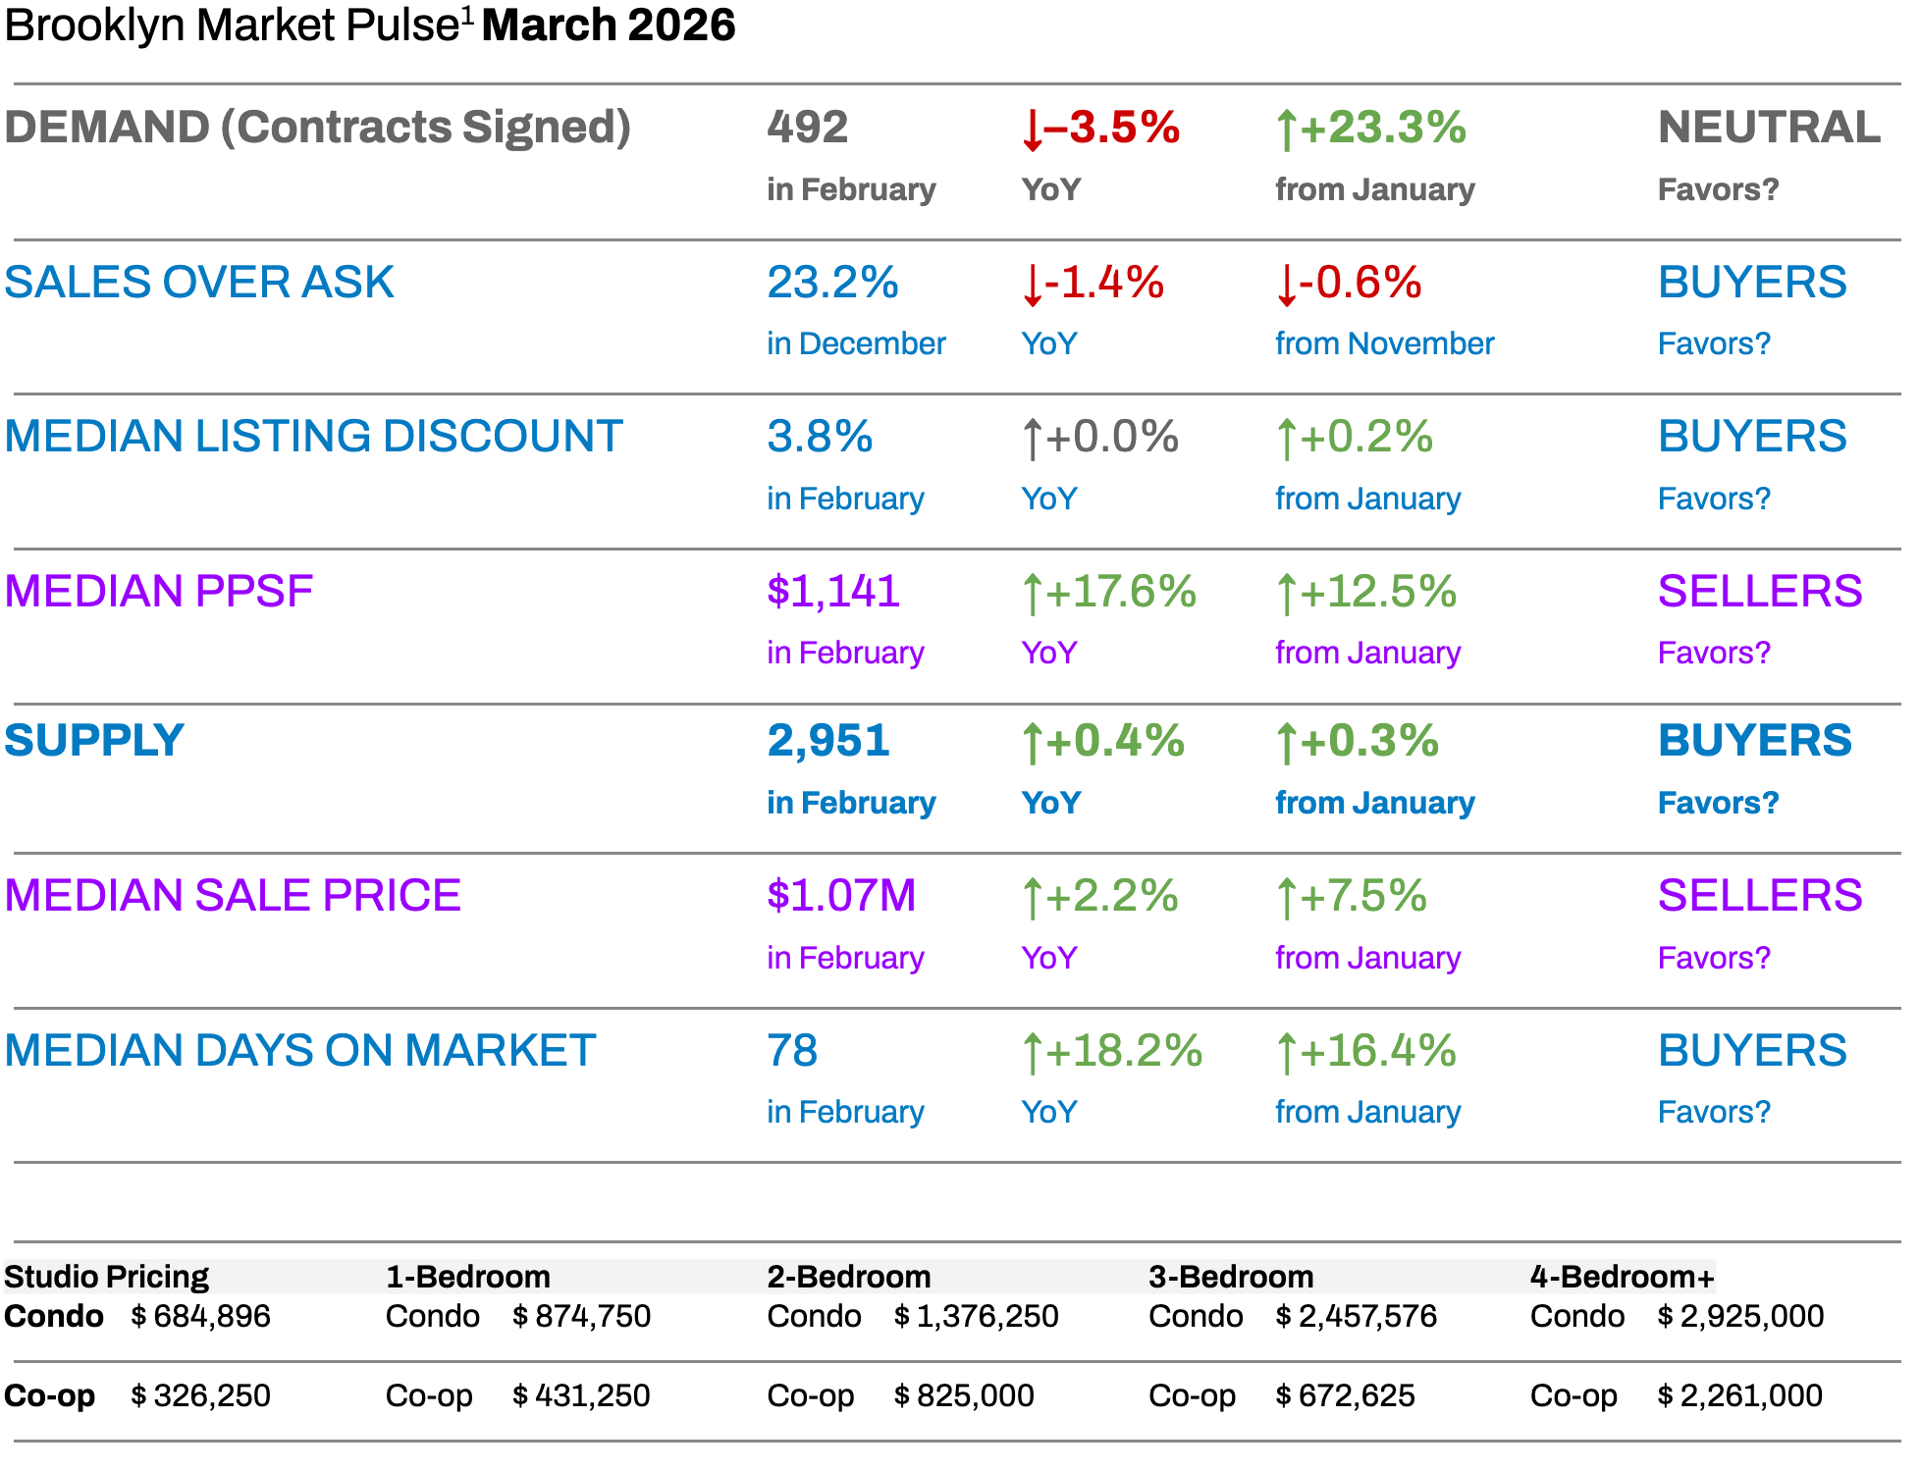
Brooklyn entered spring 2026 with a market profile that is more nuanced than Manhattan's, but no less important to understand. The Howard Hanna NYC Brooklyn Leverage Index² moved modestly in February, with two of its four key signals — supply and listing discounts — favoring buyers, one in neutral territory (demand), and one clearly in sellers' favor (median PPSF). The result is a market that is more balanced than the outer boroughs have been in several years, with selective pockets of strength and genuine opportunity on both sides of the transaction.
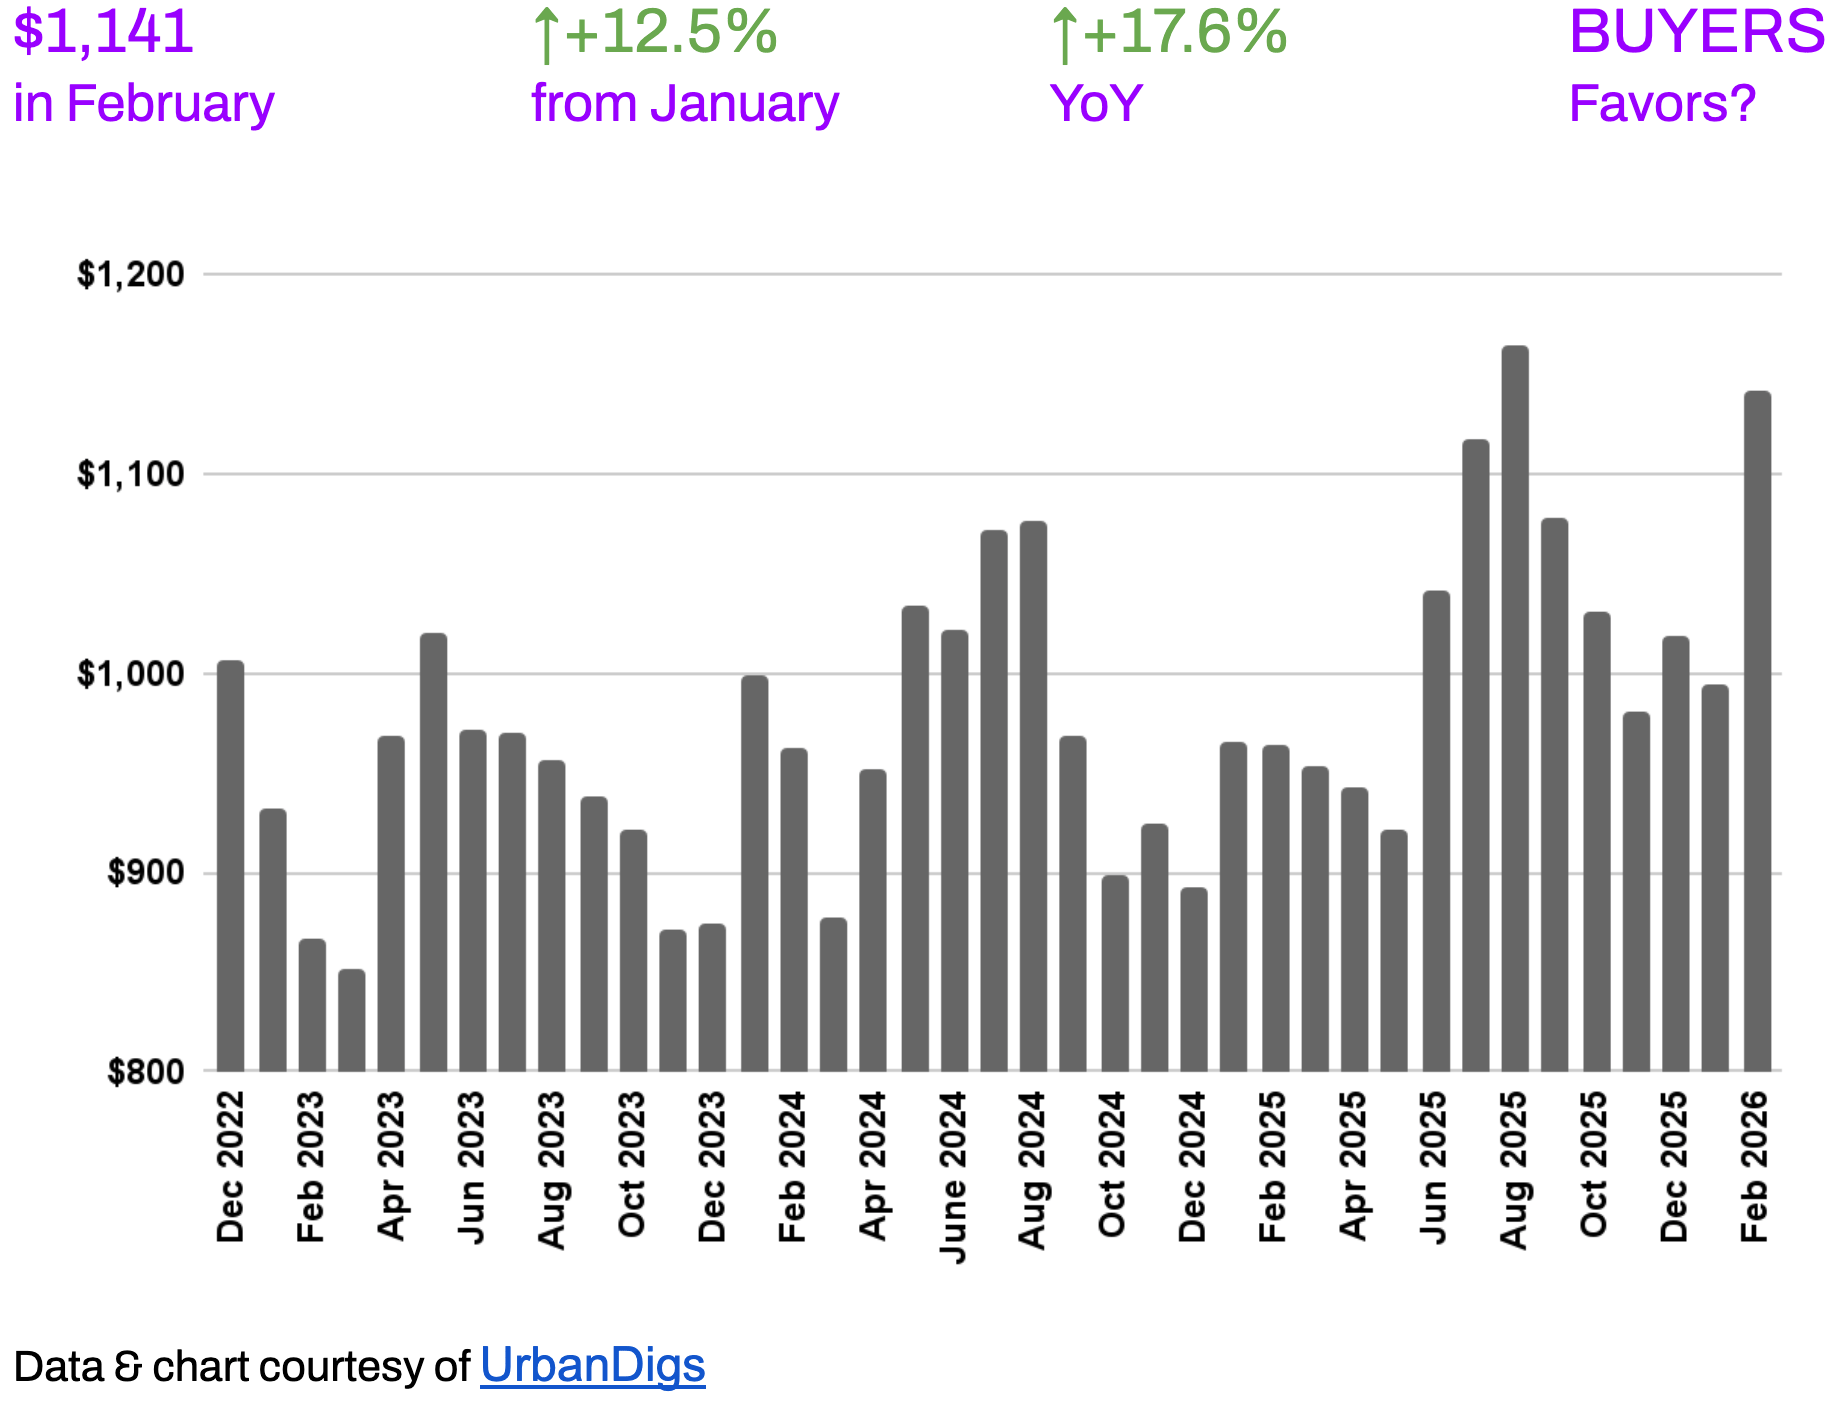
What stands out most in February is the dramatic acceleration in price per square foot. Brooklyn's median PPSF surged to $1,141 — up +17.6% year-over-year and +12.5% month-over-month. That kind of PPSF momentum, in the context of still-elevated listing discounts and rising days on market, tells a specific story: the market is repricing upward at the aggregate level, but buyers retain meaningful negotiating leverage on individual transactions. For sellers, the data validates strong pricing ambitions. For buyers, it underscores the cost of waiting.
Market Snapshot: Four Numbers That Matter
-
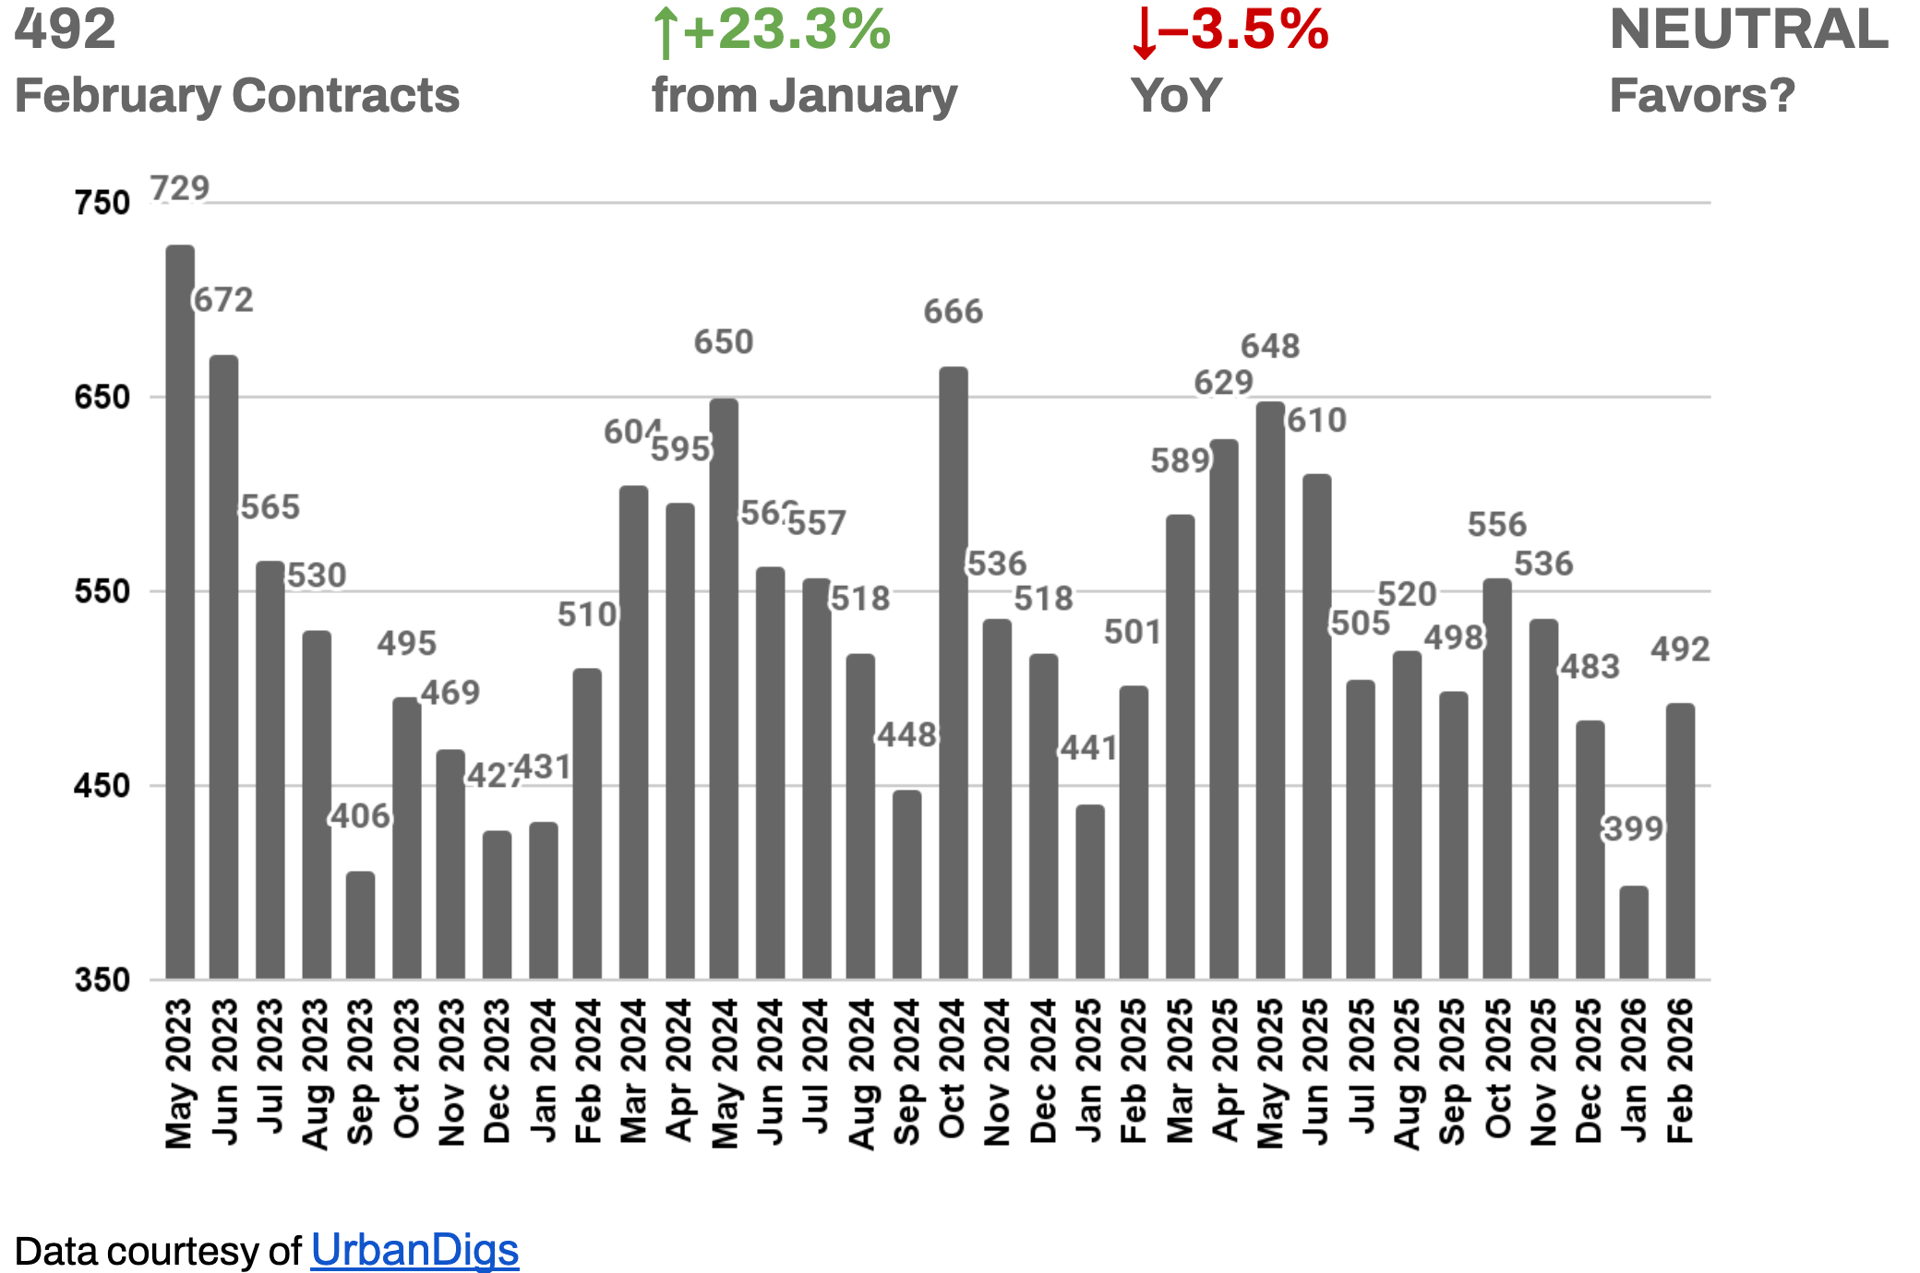
492 contracts signed in February — a +23.3% month-over-month rebound signaling early spring demand, though still –3.5% below February 2025.
-
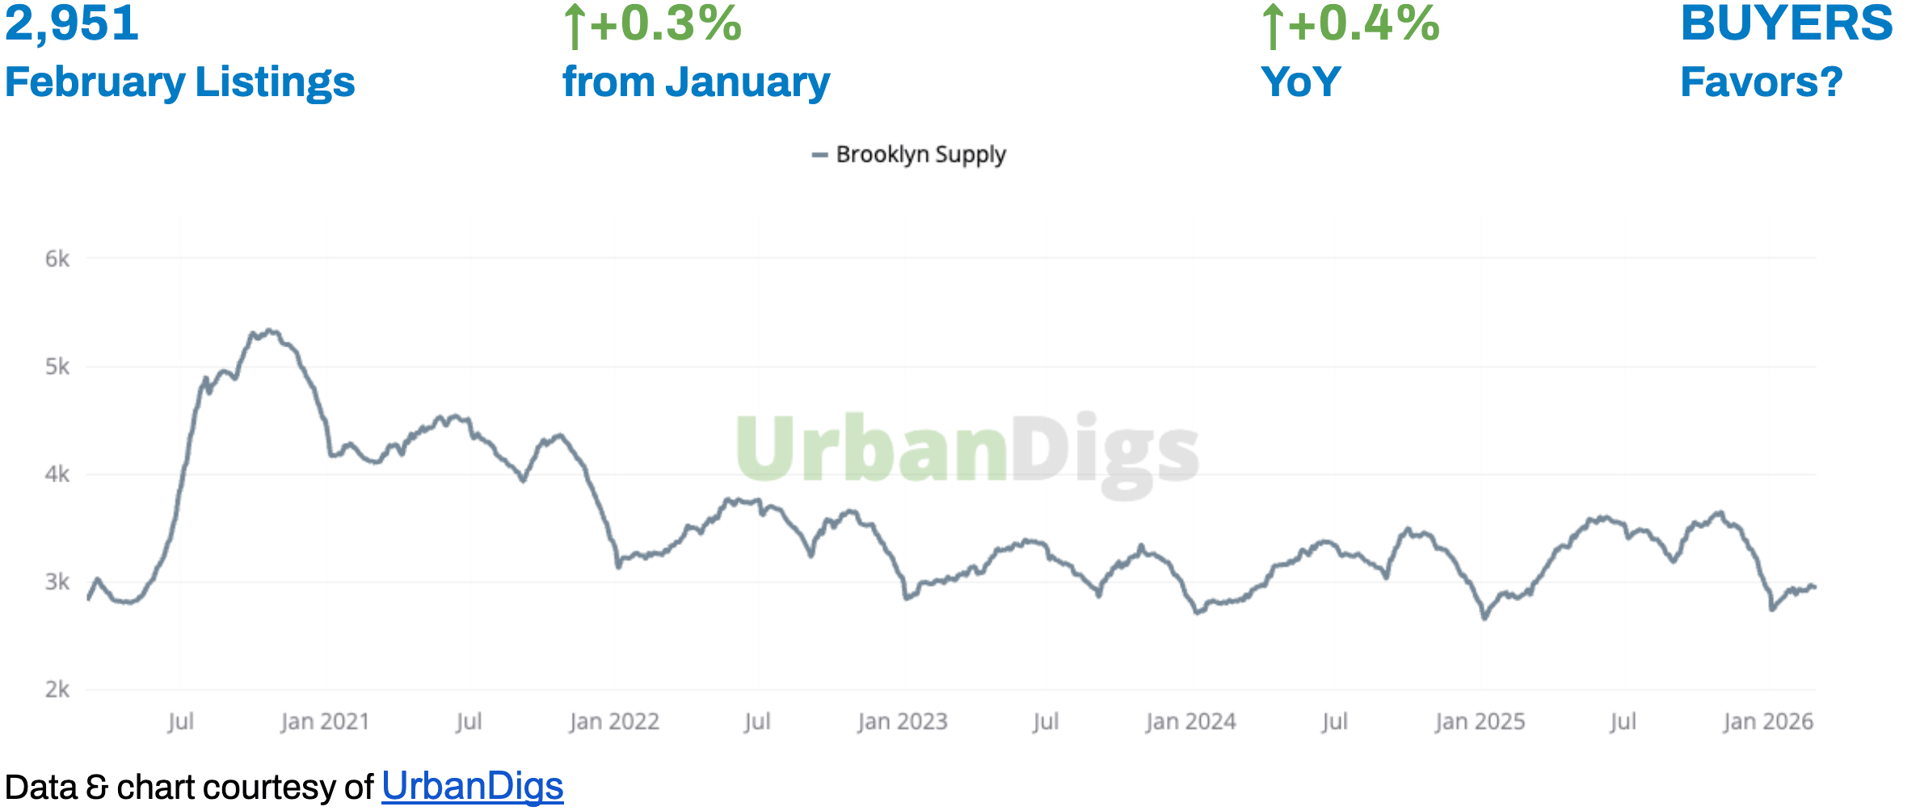
2,951 active listings — up slightly year-over-year by +0.4%, giving buyers marginally more selection than last spring.
-
Median PPSF: $1,141, up +17.6% YoY — the single most powerful pricing signal in this report, and the clearest evidence that Brooklyn values are adjusting upward.
-
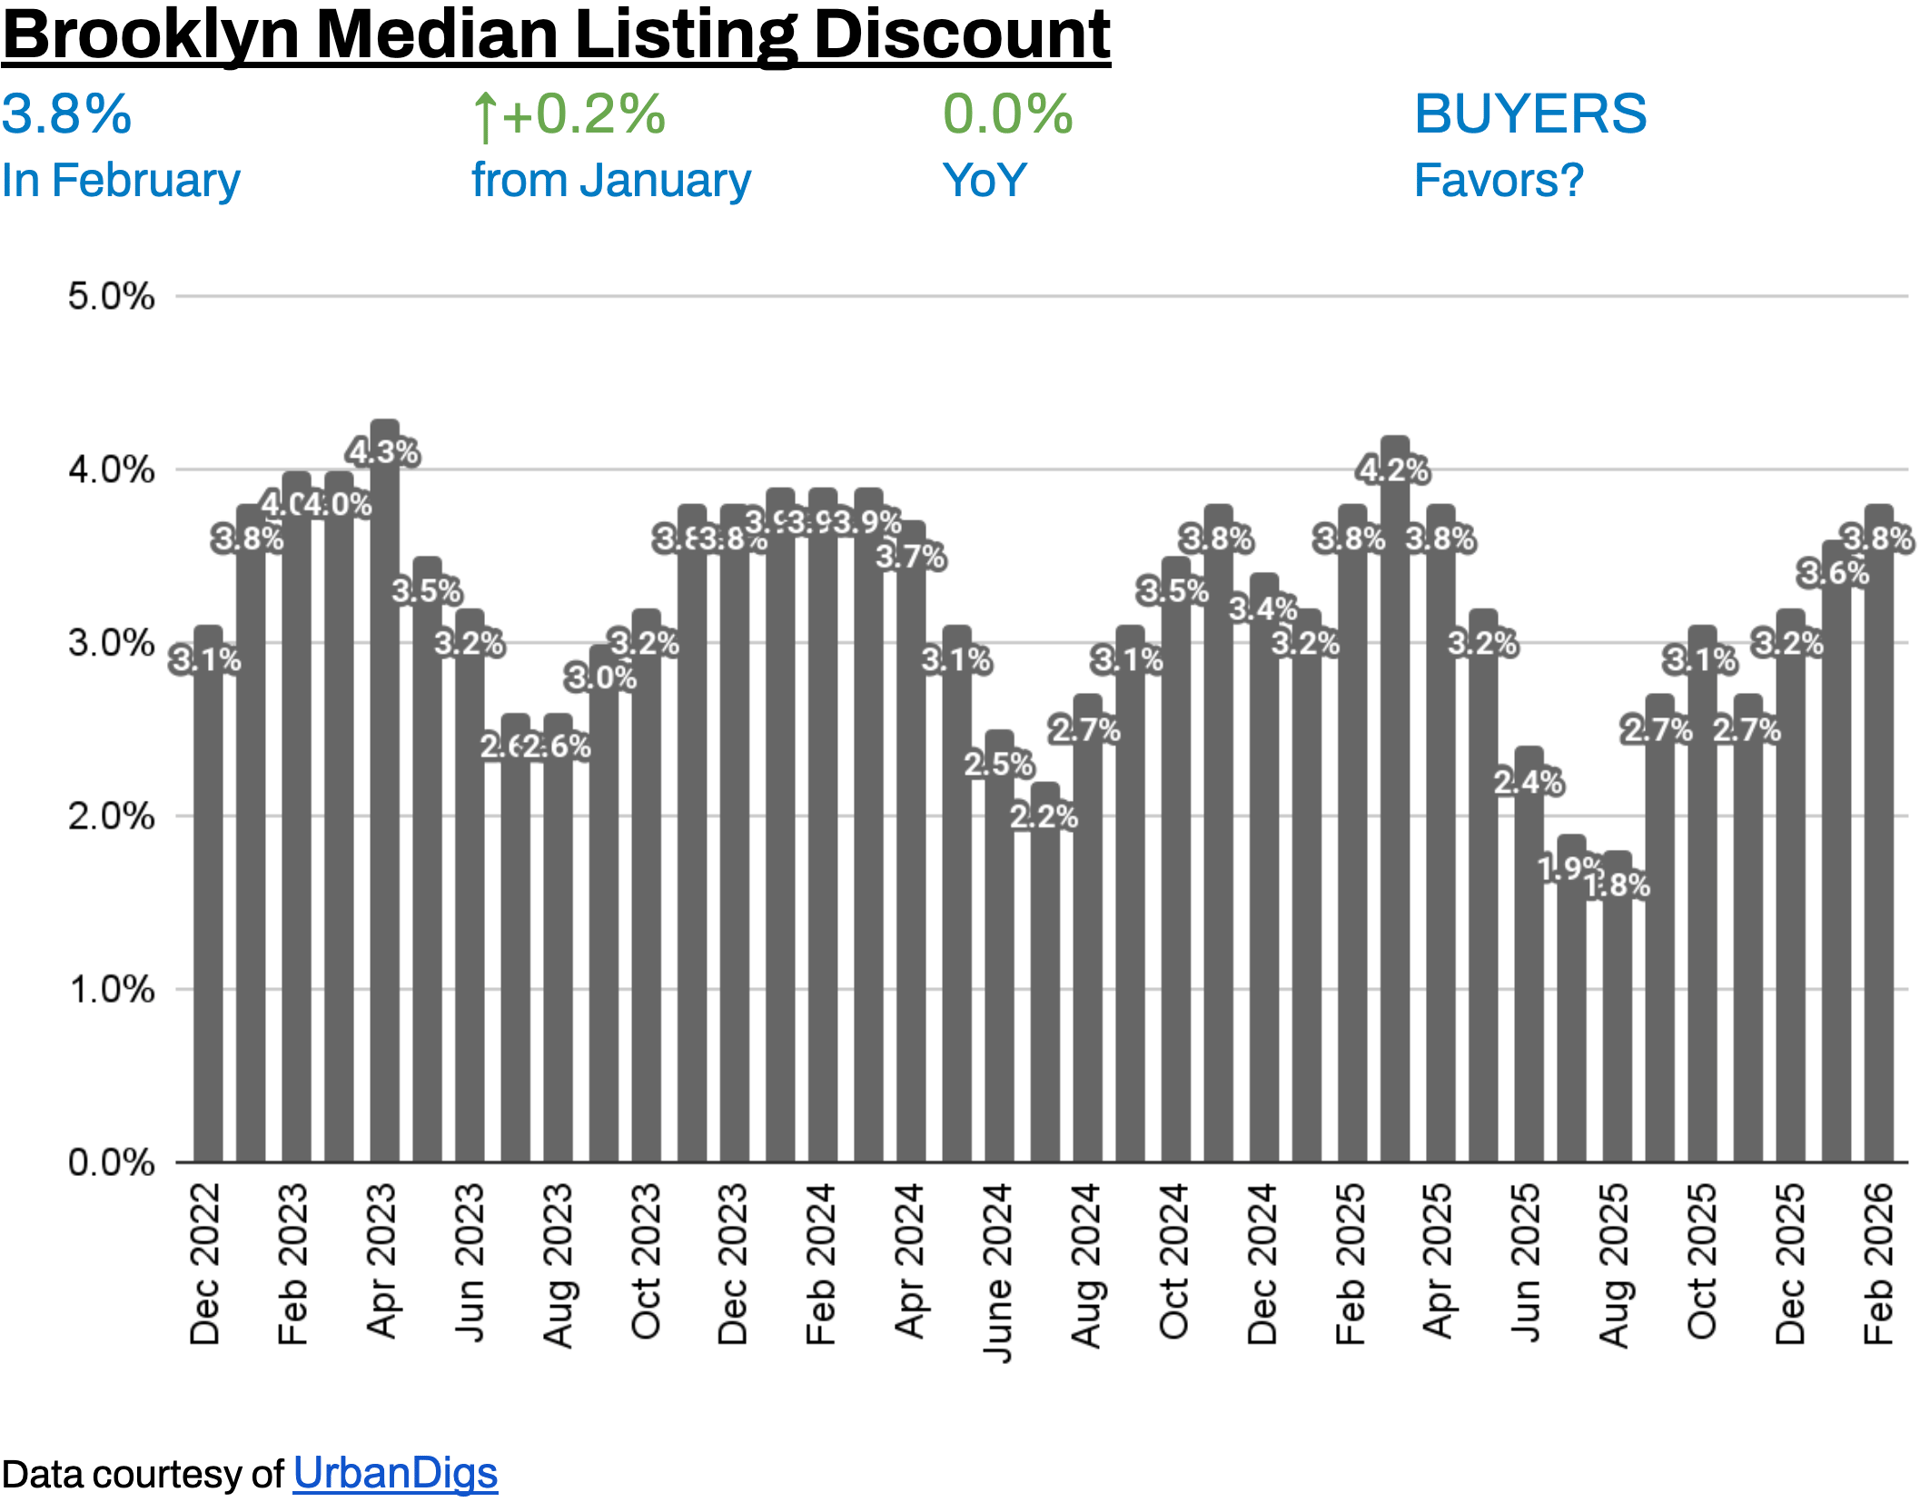
Median Listing Discount: 3.8% — slightly wider than prior months, meaning homes are selling at approximately 96.2 cents on the dollar. Buyers are extracting more from negotiations than in comparable Manhattan submarkets.
Key Takeaways
• Supply edged up +0.4% YoY to 2,951 active listings — slightly above last year, offering buyers modestly more choice than in 2025.
• Contract activity rebounded +23.3% MoM to 492 signed contracts, confirming the seasonal re-engagement of buyers as February closed.
• Median PPSF surged to $1,141, up +17.6% YoY — the standout data point of February and a clear seller-side price signal.
• Listing discounts widened to 3.8%, near the widest levels in recent memory, signaling buyers retain meaningful negotiating power.
• Days on market rose to 78 days (+18.2% YoY), indicating sellers need patience and buyers have more time to evaluate options than a year ago.
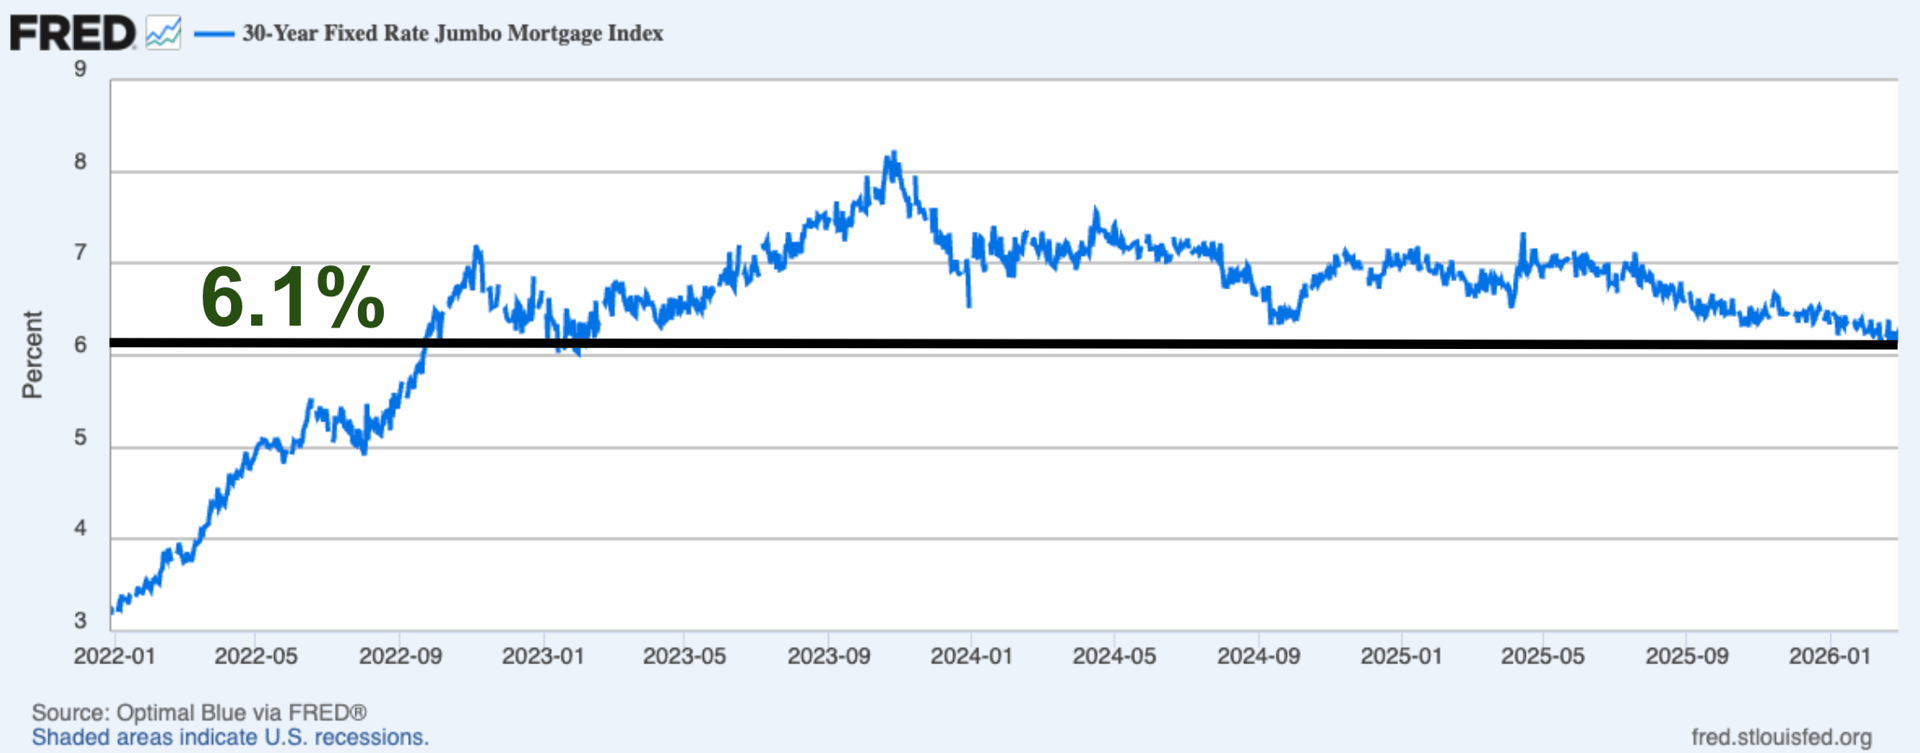
• Mortgage rates stabilized near 6.1%, reducing rate-shock psychology and allowing buyers to make decisions based on life circumstances rather than rate timing.
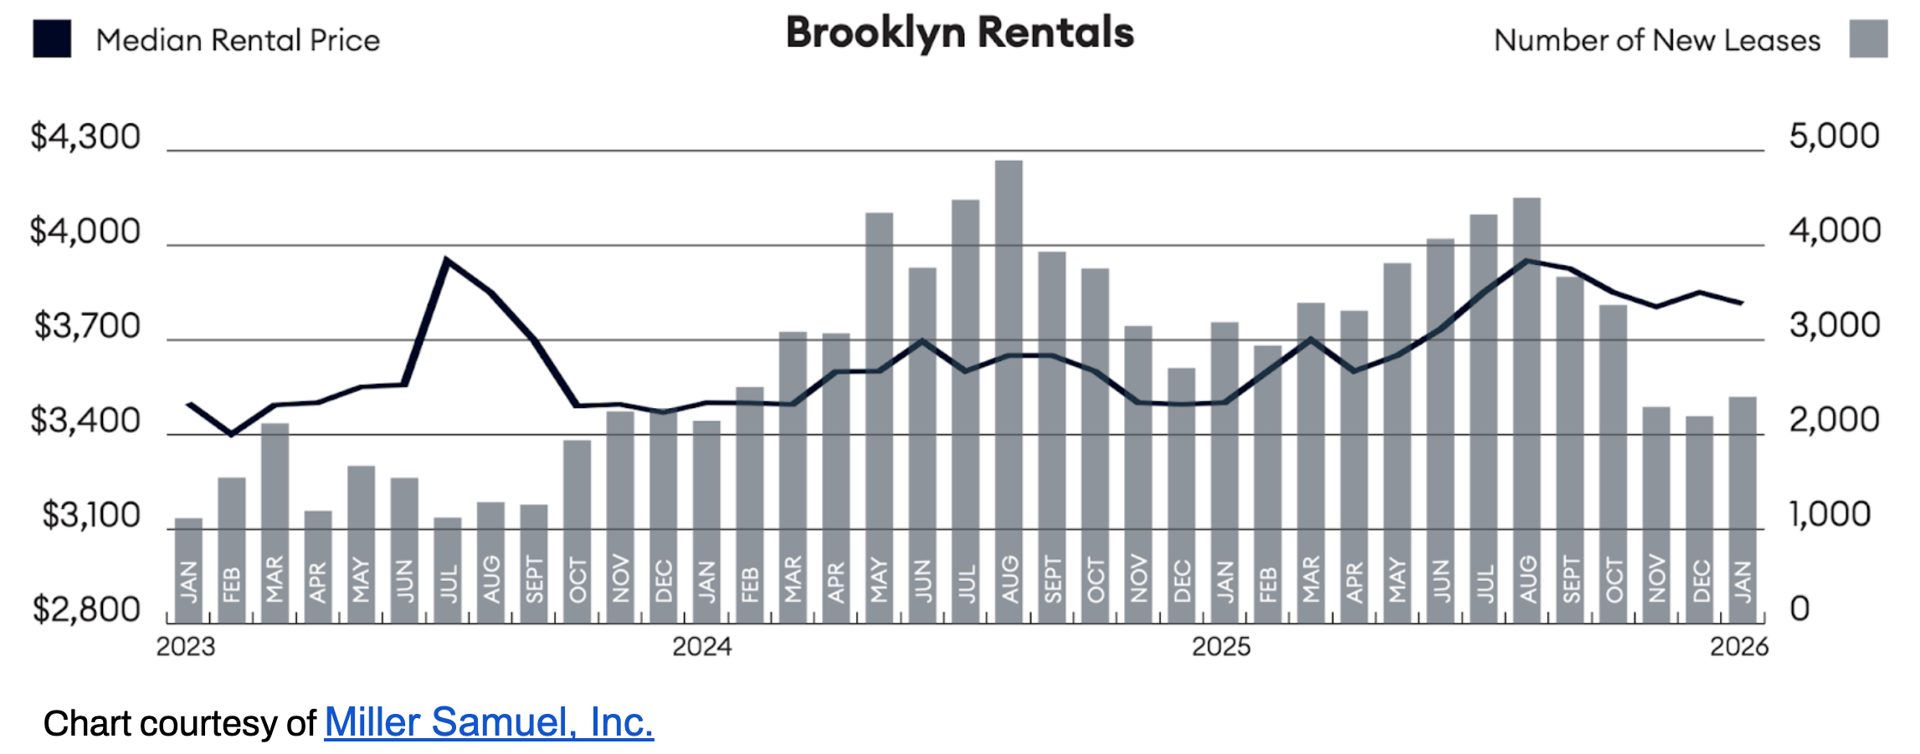
• Brooklyn median rent reached approximately $3,814 in January, up roughly +9% YoY, reinforcing the financial logic of ownership at the entry level.
Outlook
Spring 2026 in Brooklyn is shaping up as a buyer-leaning market with a strong price floor. The combination of rising PPSF and wider-than-normal listing discounts is unusual — it suggests that list prices are being set ambitiously, while actual transaction prices reflect more negotiation. Sellers who price realistically from day one will outperform those who test the ceiling and are forced to reduce.
Buyers who have been waiting for conditions to improve should note that inventory is only marginally above last year's levels. Any meaningful acceleration in demand — which the February contract rebound hints at — could absorb available supply quickly. The window of relative buyer leverage may be shorter than it appears.
Both buyers and sellers who act decisively in the first eight weeks of spring are historically best positioned. 2026 is unlikely to be an exception.

Photo by Rihards Gederts | Howard Hanna NYC
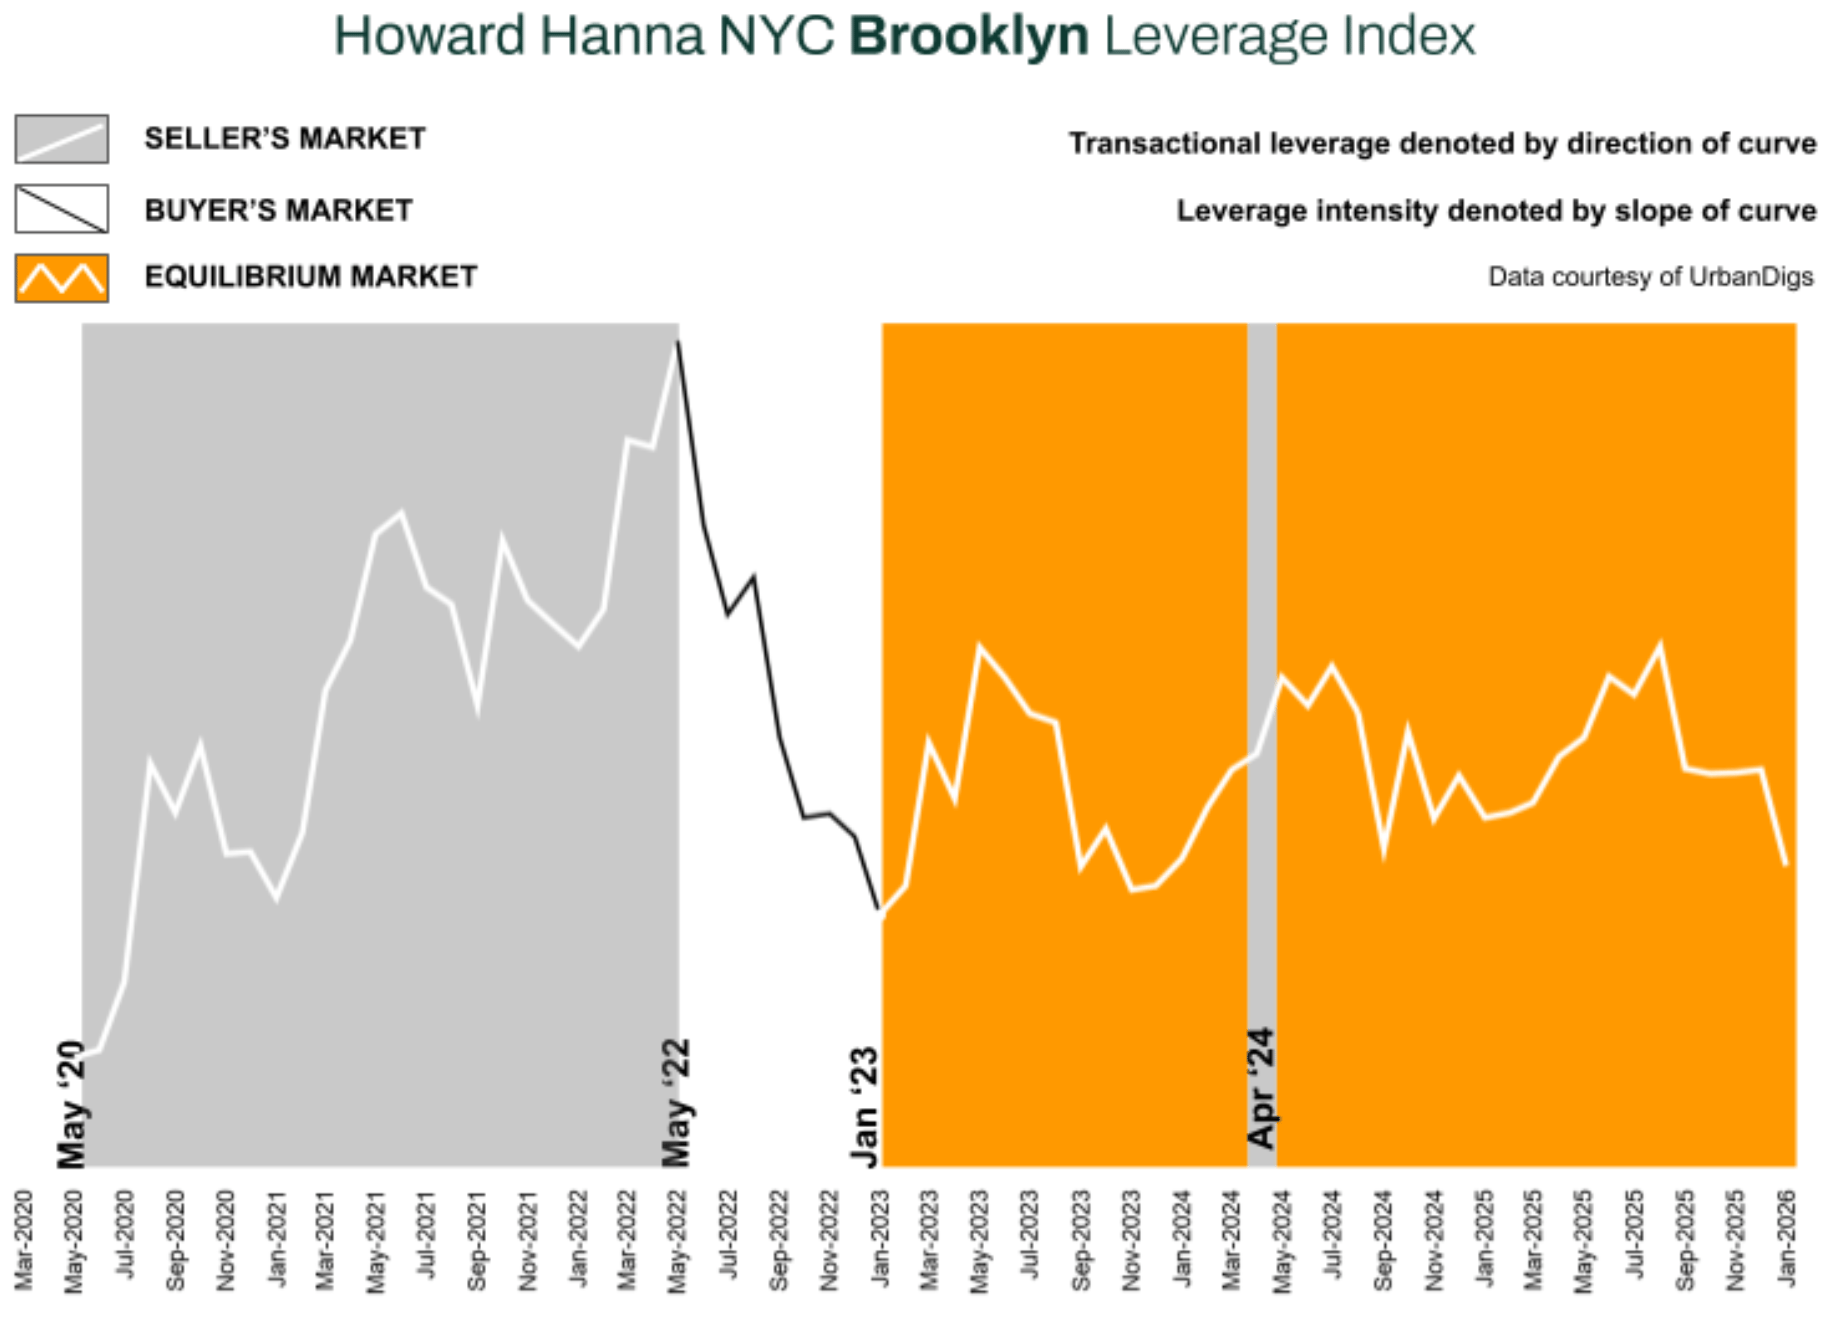
The Howard Hanna NYC Brooklyn Leverage Index blends four market signals - supply, demand, median price per square foot, and median listing discount - to capture the balance of power between buyers and sellers.
Direction Matters:
-
An upward-sloping curve = seller’s market
-
A downward-sloping curve = buyer’s market
-
The steeper the slope, the stronger the advantage for either side
In February 2026, the Howard Hanna NYC Brooklyn Leverage Index moved modestly toward buyer territory. Of its four core inputs: supply and listing discounts clearly favor buyers; demand sits in neutral territory, leaning slightly buyer-ward given the YoY contraction in contracts; and median PPSF is the single seller-side signal — and a strong one. The net reading: a market that is more balanced than it appears from the headline PPSF number, with genuine two-sided opportunity.
Brooklyn Supply
Brooklyn Supply: Inventory Edges Higher Into Spring
Brooklyn inventory rose modestly in February, reaching 2,951 active listings — up +0.3% month-over-month and +0.4% year-over-year. Unlike Manhattan, where inventory remains structurally below 2025 levels, Brooklyn has returned to — and marginally exceeded — prior-year supply. This gives buyers a slightly wider selection heading into spring, without creating any sense of oversupply.
The modest YoY increase reflects a gradual normalization of seller behavior following years of constrained listing volumes. More sellers are testing the market as confidence returns, but the pace remains measured rather than aggressive.
🟦 Buyers: Modestly more inventory than last year offers slightly better selection, but conditions remain far from a buyer's abundance. Act on well-priced listings before spring demand absorbs available stock.
🟪 Sellers: Structural undersupply that defined 2024 is no longer your primary tailwind. Pricing discipline from day one is essential. Correctly priced listings continue to transact efficiently; overpriced ones are sitting.
Outlook: Inventory is expected to continue rising gradually through Q2 as more sellers time their spring entries. A material oversupply scenario remains unlikely, but the shift in dynamics compared to 2024 warrants realistic pricing expectations from sellers.
Brooklyn Demand
Brooklyn Demand: Contracts Rebound From January Slowdown
February marked a meaningful recovery from the seasonal slowdown of January, with 492 contracts signed — a +23.3% month-over-month increase. The rebound confirms that buyer interest remained present throughout the winter and is accelerating as spring approaches. However, the year-over-year picture is less bullish: demand remains 3.5% below February 2025, placing the reading in neutral territory rather than signaling a full demand recovery.
🟦 Buyers: Momentum is building, but this is not yet a highly competitive market for most property types. Well-prepared buyers with financing in place are well-positioned to negotiate constructively, particularly on listings with extended days on market.
🟪 Sellers: The demand recovery supports patient, disciplined pricing. February's rebound is an early signal, not a guarantee. Listings that generate early showing activity are most likely to transact close to ask; stale listings are increasingly vulnerable to discount pressure.
Outlook: Contract activity is expected to increase further through March and April as the spring cycle gains momentum. A meaningful improvement in the YoY comparison will likely require rates to stabilize or nudge lower, or a sustained uptick in new listings that brings more quality inventory to market.
Brooklyn Median PPSF
Brooklyn Median PPSF: Price Per Square Foot Surges — The Standout Signal of February
Brooklyn's median price per square foot reached $1,141 in February — up +12.5% from January and +17.6% year-over-year. This is the single most striking data point of the month, and it reflects a genuine structural repricing rather than a compositional shift in closed sales.
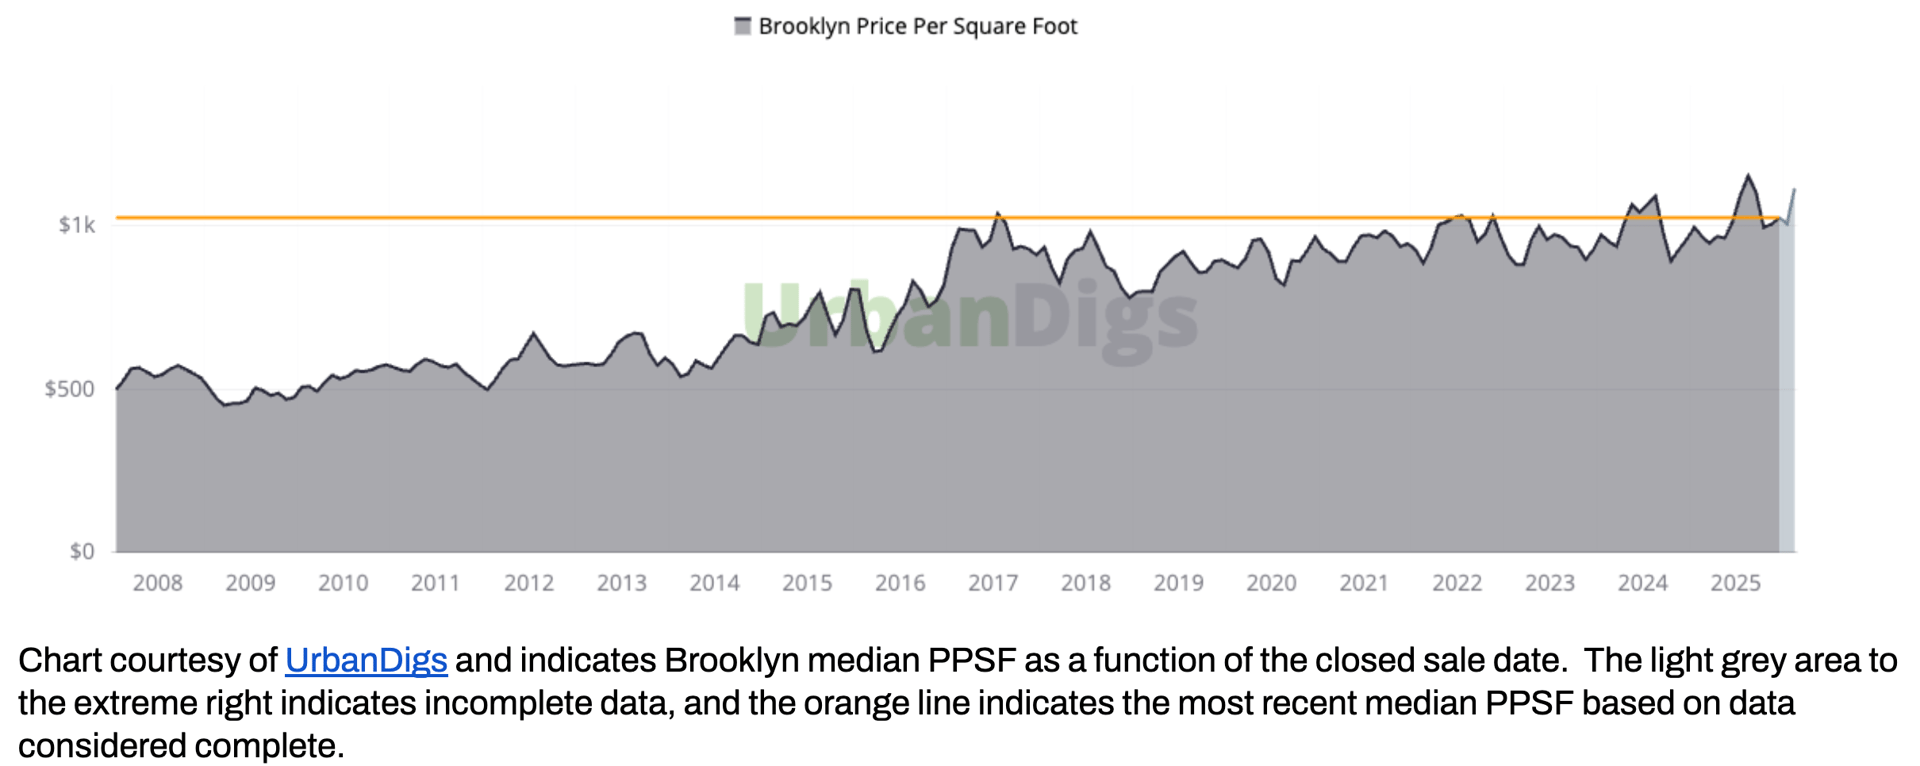
Brooklyn's PPSF has followed a disciplined long-term appreciation path — rising from approximately $500/sf post-financial crisis to roughly $1,000/sf by 2017, and now approaching $1,141/sf. Unlike many high-growth U.S. metros that experienced sharp boom-bust cycles, Brooklyn has demonstrated measured expansion and periodic consolidation — structural resilience that makes the current PPSF acceleration meaningful rather than alarming.
The gap between PPSF appreciation (+17.6% YoY) and median sale price appreciation (+2.2% YoY) suggests that the composition of closed sales is shifting toward smaller units — a pattern often seen early in a recovery cycle as entry-level buyers re-engage before larger, higher-priced transactions follow.
🟦 Buyers: Do not interpret rising PPSF as a reason to wait. Price appreciation at the PPSF level typically precedes broader median price appreciation by several months. Buyers entering now at current levels may be ahead of a wider upward repricing cycle.
🟪 Sellers: The PPSF data validates ambitious pricing, particularly for well-located, move-in-ready properties. Pair aggressive list prices with professional staging and transparent marketing — the PPSF trend supports the ask, but execution determines the outcome.
Outlook: PPSF is expected to hold near current levels or firm modestly through Q2 as spring demand absorbs quality inventory. Any acceleration in new listing volume could moderate the pace of appreciation; constrained supply will sustain it.
Discounts Widen — Buyers Extracting More at Negotiation
The median listing discount widened to 3.8% in February, up from approximately 3.6% in January. Homes are now selling for approximately 96.2 cents on the dollar of last asking price. While this may appear modest in absolute terms, the trend is meaningful: listing discounts in Brooklyn are wider than in Manhattan (where the equivalent figure is 4.4% but the market dynamics are more seller-leaning), and wider-than-normal discounts signal that sellers are conceding more during negotiations.
Discount compression is typically one of the earliest indicators of a leverage shift. In Brooklyn's case, the absence of compression — and the marginal widening — confirms that buyers retain real negotiating power in February, despite the PPSF surge. This reflects a market where list prices may be ambitious relative to what buyers are willing to pay, resulting in post-negotiation outcomes that discount more from the original ask.
🟦 Buyers: The current discount environment rewards structured, well-supported offers. Buyers who come in with comparable sale data and a clear value rationale are finding sellers more receptive than headline PPSF numbers might suggest. Don't leave negotiation value on the table.
🟪 Sellers: Wider discounts are a signal to revisit your pricing strategy. Listings that require significant post-offer negotiation are often the result of initial overpricing. Market-aligned pricing from day one compresses days on market and produces better net outcomes than high-list, high-discount transactions.
Outlook: If spring demand strengthens meaningfully, listing discounts may begin to compress — particularly for well-priced listings in high-demand neighborhoods. A weakening in demand, or a surge in new listings, would sustain or widen the current discount environment through Q2.
RENTAL REMARKS
Rental Strength Continues to Underpin Ownership Demand
Brooklyn's rental market remained historically tight through the year-end and into early 2026. January median rent reached approximately $3,814 — down –0.9% month-over-month (normal seasonal softness) but up a striking +9.0% year-over-year. All major price trend indicators continued to exhibit robust annual growth. Both new lease signings and available listing inventory declined year-over-year, maintaining the structural imbalance that has kept Brooklyn rents elevated.³
Bidding wars in the rental market remained elevated, with more than three in ten leases signed above asking price. This metric, which tracks the urgency of rental demand, is a leading indicator of broader housing conditions: when rentals are this competitive, the conversion from renting to buying becomes more financially attractive at the entry level — particularly as the gap between monthly rental and ownership costs narrows.
🟦 Renters: Affordability remains the primary challenge. Speed, preparation, and pre-approval are essential — particularly for studios and one-bedrooms in prime neighborhoods. Consider whether ownership now makes more financial sense than continued renting at these elevated levels.
🟪 Landlords: Fundamentals remain firmly favorable. Tight vacancy, rising asking rents, and sustained bidding war activity support both rental income stability and the underlying asset value of Brooklyn residential real estate.
Outlook: Unless rental inventory expands meaningfully in spring — which current listing volume trends do not support — rental pricing is expected to remain firm through mid-2026. The buy-vs.-rent math will continue to tighten, creating a further tailwind for ownership demand in the $800K–$1.5M segment.
MORTGAGE REMARKS
Mortgage Rate Stability Is Reducing Friction
Mortgage conditions have become more predictable. By the end of February, average 30-year jumbo rates were hovering around 6.1%⁴, with effective APRs close to 6.0%⁵. That is meaningfully lower than the peaks above 7% seen in 2025 and, more importantly, far less volatile.
While rates remain elevated compared to the ultra-low period of 2020–2021, the stabilization near the 6% range has reduced the “rate shock” psychology that defined much of 2023 and early 2024. Buyers today are adjusting expectations rather than waiting for a dramatic drop, and transaction timing is increasingly driven by life decisions rather than attempts to anticipate Federal Reserve policy.
Outlook: Absent a material change in inflation or labor data, rates are likely to remain range-bound near current levels through mid-2026. Stability — not sharp declines — is the more probable scenario.
INVESTOR INSIGHTS
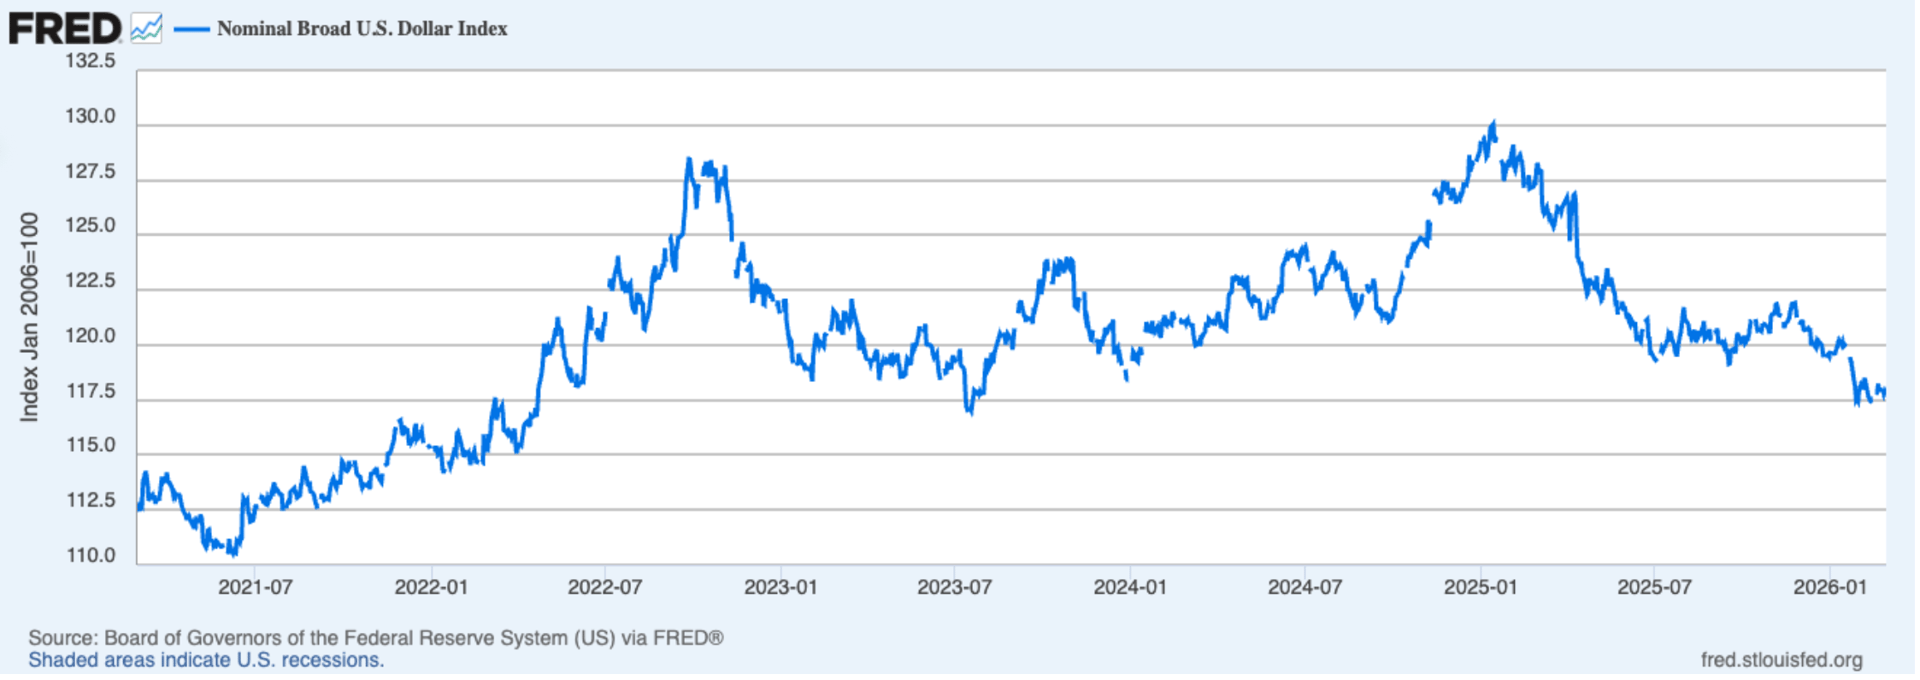
A weakening U.S. dollar is quietly improving the purchasing power of international buyers — particularly those from the Eurozone, the U.K., and other major economies where currencies have strengthened 10%+ against the dollar over the past year. For a European buyer, Brooklyn real estate has effectively become more affordable in local-currency terms without any change in asking prices. This is a meaningful, underappreciated tailwind for international demand in Brooklyn luxury and ultra-luxury segments.
Domestic investors remain cautious. With investment mortgage rates hovering around 6.1% and stabilized rental yields in the 3–4% range, risk-adjusted returns for traditional condo and co-op investments are currently uninspiring. As a result, capital deployment is increasingly disciplined and underwriting-driven rather than momentum-based.
National Housing Context: What the HMI Tells Us
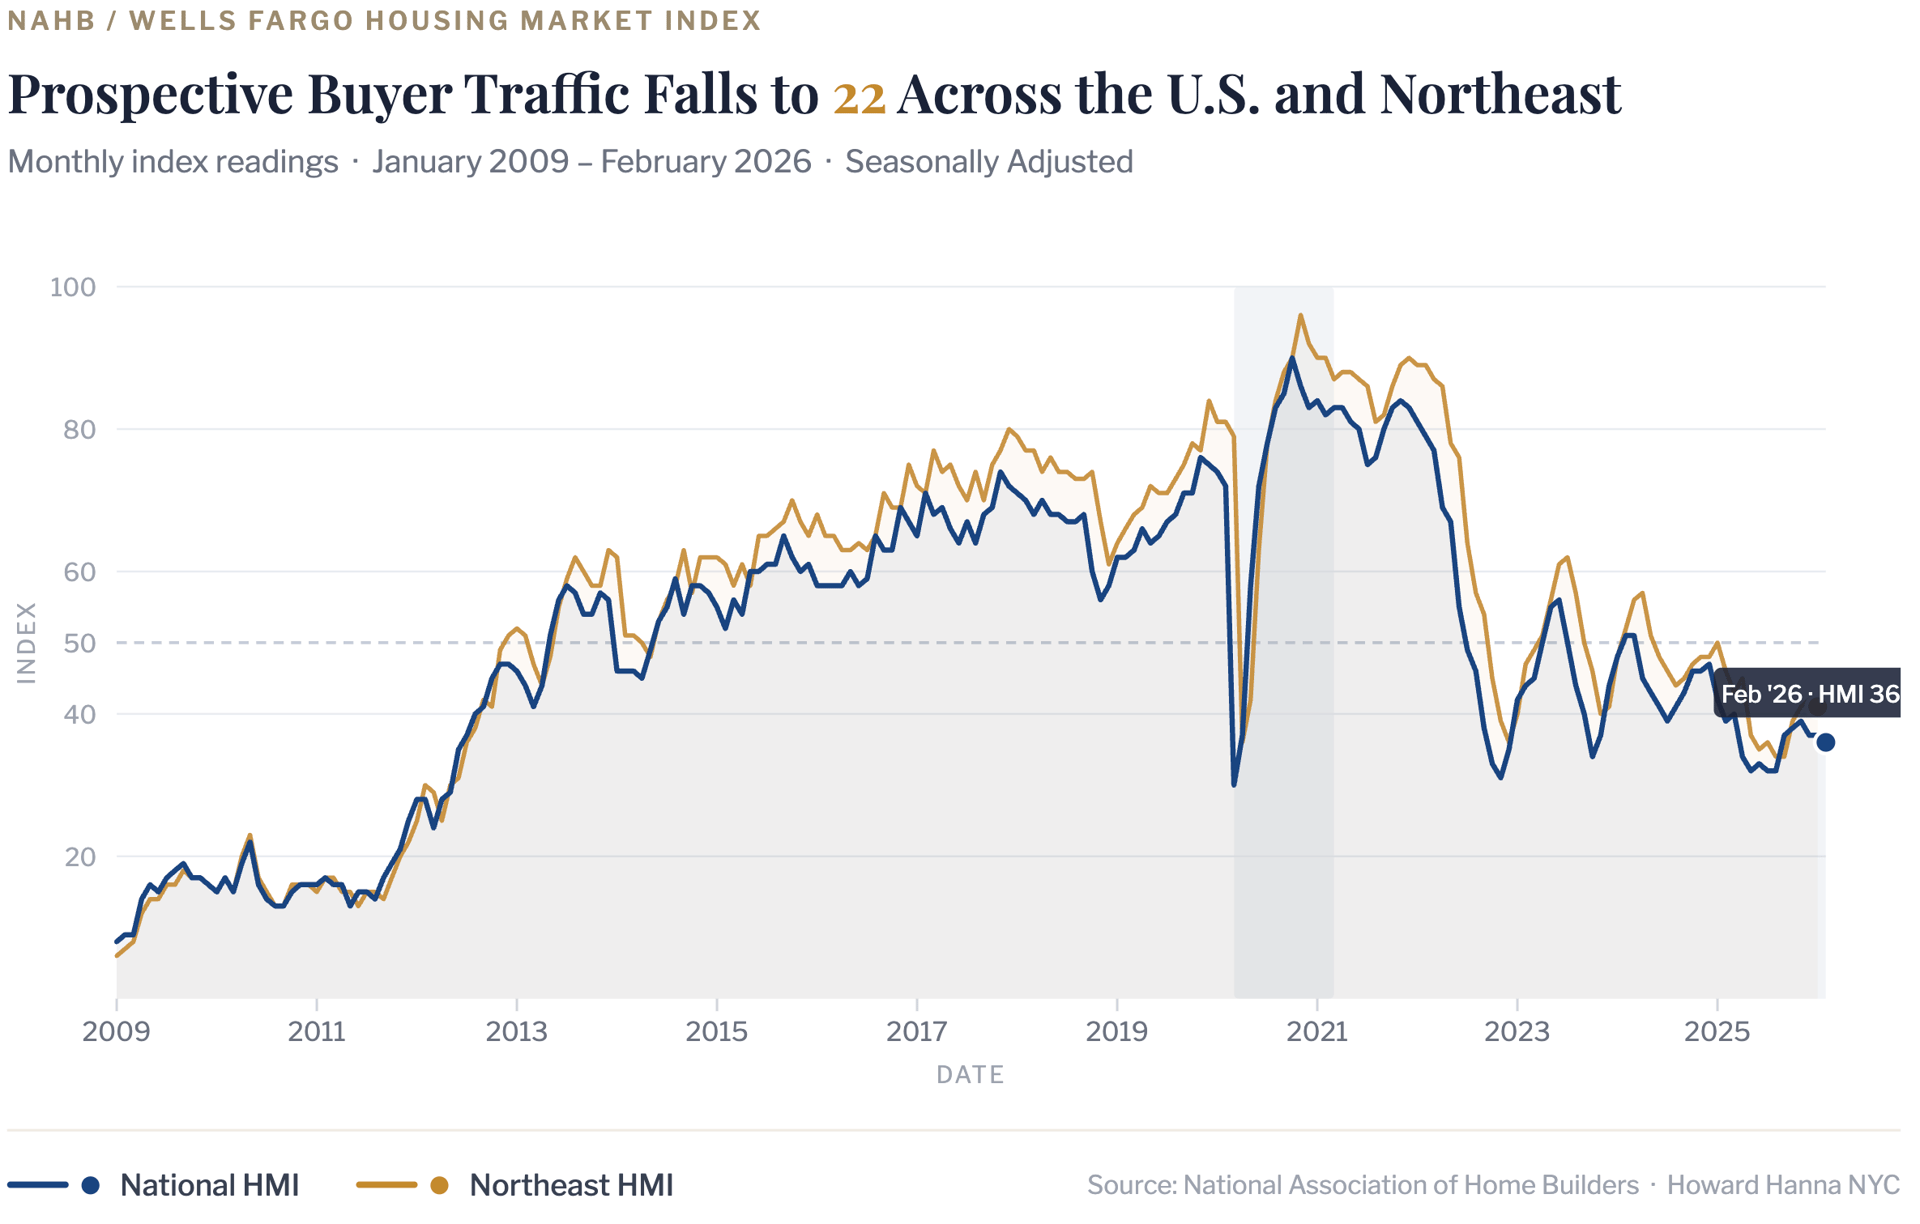
The NAHB/Wells Fargo Housing Market Index edged down to 36 in February 2026 (preliminary), its lowest reading since late 2023, as elevated mortgage rates and affordability headwinds continued to weigh on builder confidence nationally. Prospective buyer traffic fell to 22 — a particularly telling subcomponent, as foot traffic at new construction sites is often the earliest leading indicator of demand momentum. Current sales conditions held at 41 while six-month expectations slipped to 46, suggesting builders see limited near-term relief without a meaningful rate move.
In the Northeast, sentiment has mirrored the national softening, with the regional HMI retreating alongside broader affordability pressures.
For Brooklyn residential real estate, the signal is nuanced. The HMI measures new single-family construction sentiment — a segment largely absent in Brooklyn. What the data does reflect is the broader psychology of the buyer pool: caution, rate sensitivity, and a preference for patience over urgency. That said, Brooklyn's resale and premium condo markets continue to be driven more by equity wealth, global capital flows, and constrained trophy inventory than by mortgage-rate-dependent demand.
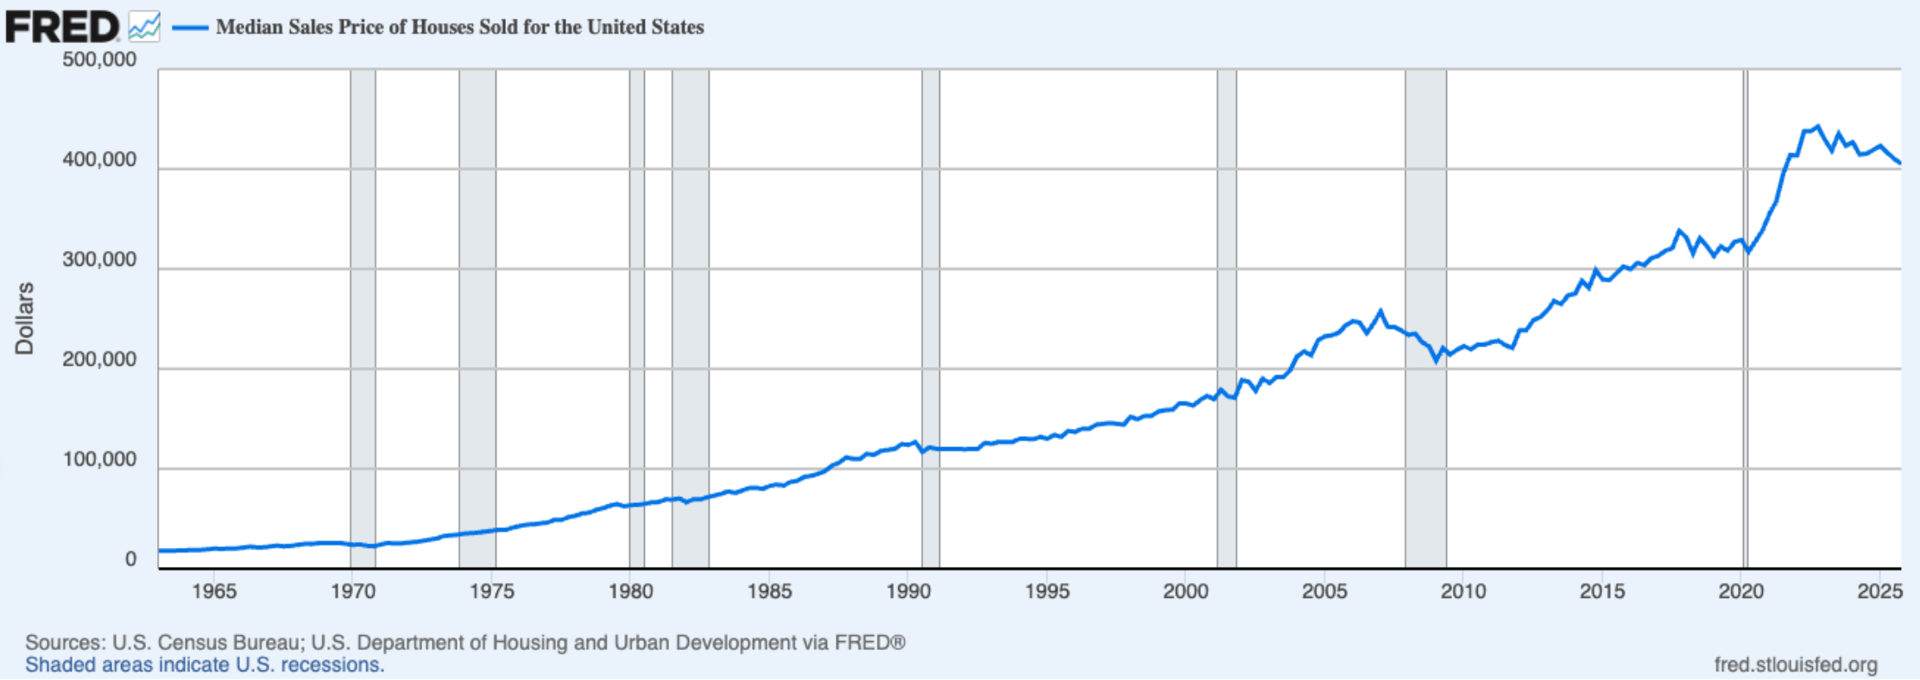
The chart below illustrates that U.S. national median home prices have risen significantly over the past five years, while Brooklyn prices have remained notably more stable — insulated from the broader appreciation cycle and therefore not facing the same correction risk seen in other markets.
Notably, after rising from a post-financial-crisis trough near $500/sf to roughly $1,000/sf by 2017, Brooklyn’s median PPSF has trended within a gradually appreciating but relatively disciplined range over the past decade — demonstrating structural resilience and far less speculative volatility than many high-growth U.S. metros. Rather than exhibiting boom-bust dynamics, Brooklyn has shown measured expansion, periodic consolidation, and steady long-term value creation.
References
1. Data courtesy of UrbanDigs
2. According to the Howard Hanna NYC Brooklyn Leverage Index
3. Data courtesy of Miller Samuel, Inc.
4. Data courtesy of Federal Reserve Bank of St. Louis
5. JUMBO mortgage rate APR data courtesy of Bank of America, Chase, and Wells Fargo
6. Cover Photo by Rihards Gederts.
If you would like to chat about the most recent market activity,
feel free to contact us at [email protected] or
connect with one of our Advisors.
Howard Hanna NYC brings the nation’s largest independent and family-owned brokerage to New York City, uniting the strength of a national network with the insight and sophistication of a local firm. Formed through joining forces with Elegran Real Estate, Howard Hanna NYC delivers a seamless, full-service experience backed by more than 15,000 agents across 500 offices in 14 states. The firm’s forward-thinking, agent-first culture continues to shape the future of real estate across Manhattan and the Tri-State area.Learn more at www.howardhannanyc.com.