A Market in Equilibrium as Rates Cap Volatility and Price Discovery Improves
Manhattan’s residential market entered 2026 in a state of measured stability. Transaction activity moderated following a strong late-2025 finish, but pricing metrics remained resilient and negotiation dynamics continued to tighten. Rather than signaling weakness, current conditions reflect a market that has largely absorbed higher interest rates and recalibrated behavior accordingly.
The defining theme is normalization. Elevated borrowing costs have reduced speculative behavior, cooled urgency-driven demand, and shifted decision-making toward fundamentals: pricing accuracy, asset quality, and long-term value. This transition has lowered volatility without undermining pricing, resulting in a market where leverage has stabilized near equilibrium rather than swinging decisively toward buyers or sellers.
From a leverage perspective, the Howard Hanna NYC Manhattan Leverage Index² edged modestly lower in January but remained firmly within neutral territory. Softer contract activity marginally improved buyer negotiating power, while tighter listing discounts and constrained supply continued to support sellers.
Market Snapshot In Two Numbers That Matter
-
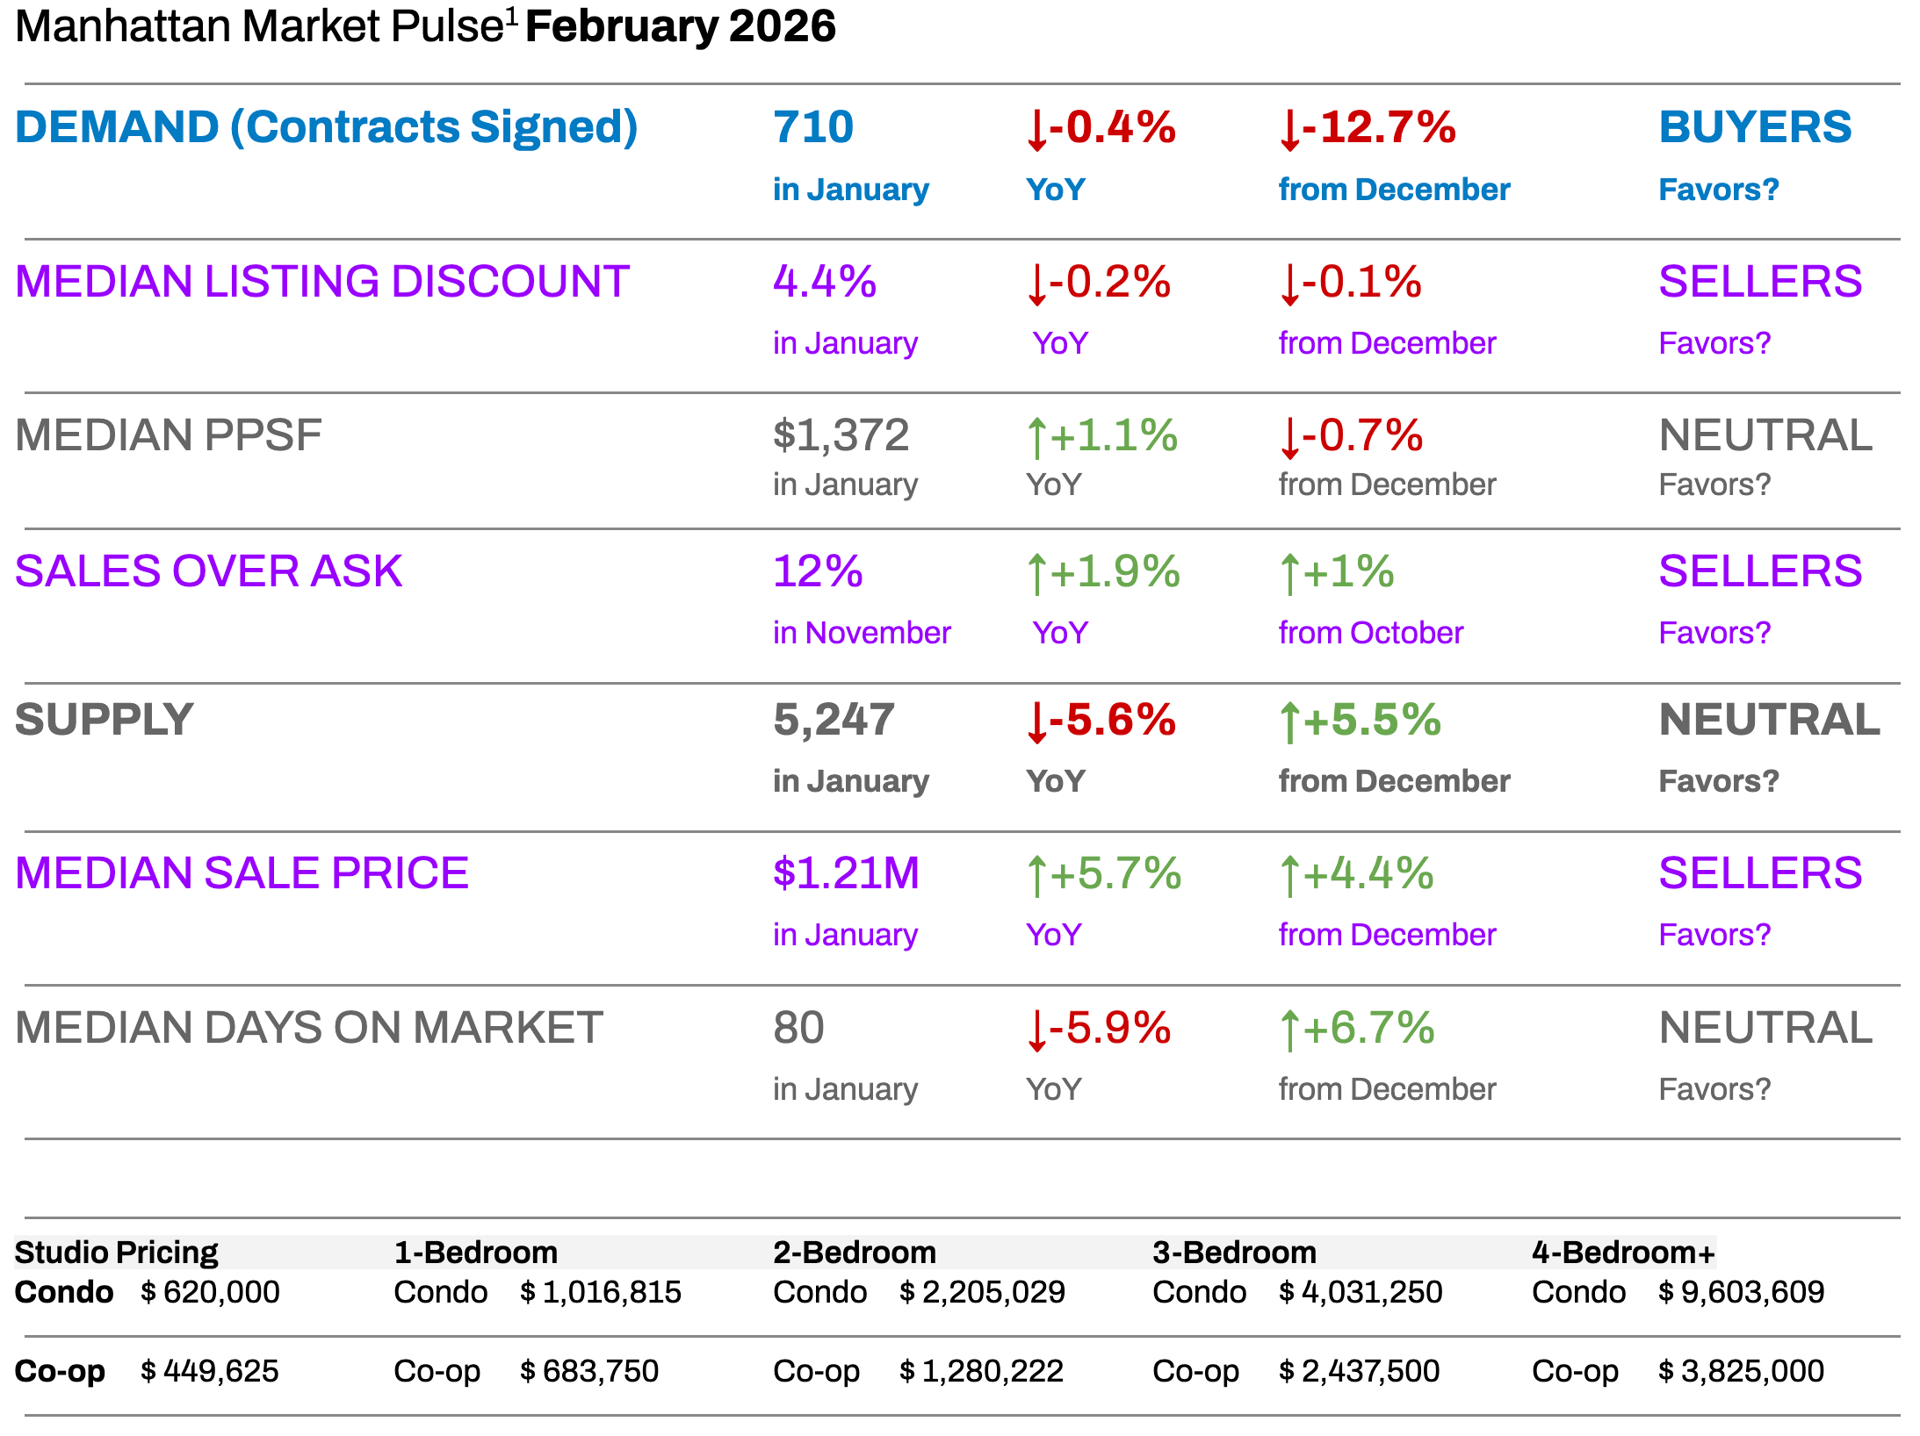
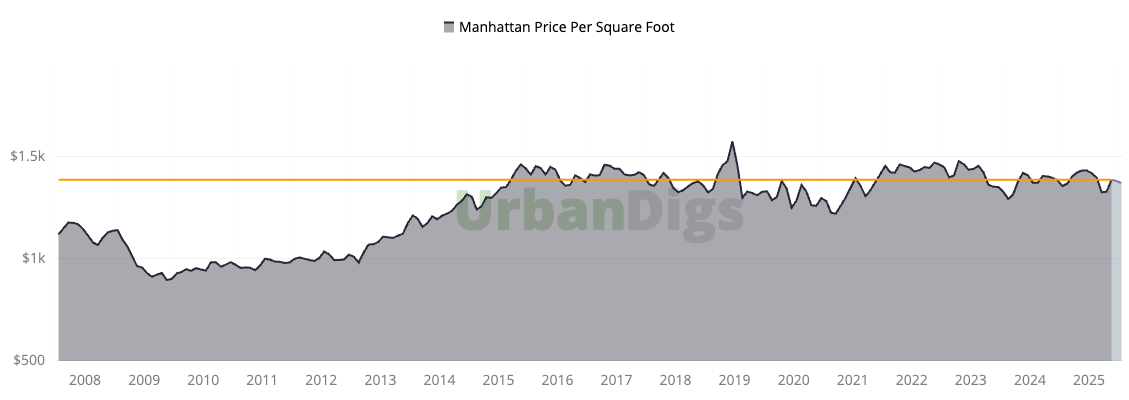
$1,372 Median Price per Square Foot
Up +1.1% year over year, reinforcing that Manhattan pricing remains structurally supported despite elevated interest rates and seasonal softening. -
710 Contracts Signed in January
Demand cooled post-holiday (–12.7% month over month), but remained essentially flat year over year, signaling rate sensitivity rather than demand breakdown.
Key Takeaways
-
Pricing remains structurally resilient, with year-over-year gains despite slower activity.
-
Negotiation margins are compressed, with the median listing discount at 4.4% in January, tightening by 0.1 % MoM and 0.2% YoY, reflecting sustained seller discipline and selective buyer engagement.
-
Demand is filtering, not collapsing, as buyers become more rate- and value-sensitive.
-
Inventory remains historically constrained, with 5,247 active listings in January (–5.6% YoY), keeping supply below pre-pandemic norms, even as listings rise seasonally.
-
Elevated rents, combined with tighter rental supply driven by higher lease renewal rates following recent legislative changes, continue to strengthen the long-term case for ownership.
-
Market leverage is balanced and listing-specific, not broadly directional.
Outlook
Manhattan is a stable, execution-driven market where pricing is range-bound, leverage is balanced, and outcomes hinge on asset quality rather than urgency, while Brooklyn remains buyer-led, offering well-capitalized buyers growing negotiating leverage as sellers adjust expectations and execution risk rises.

Photo by Rihards Gederts | Howard Hanna NYC
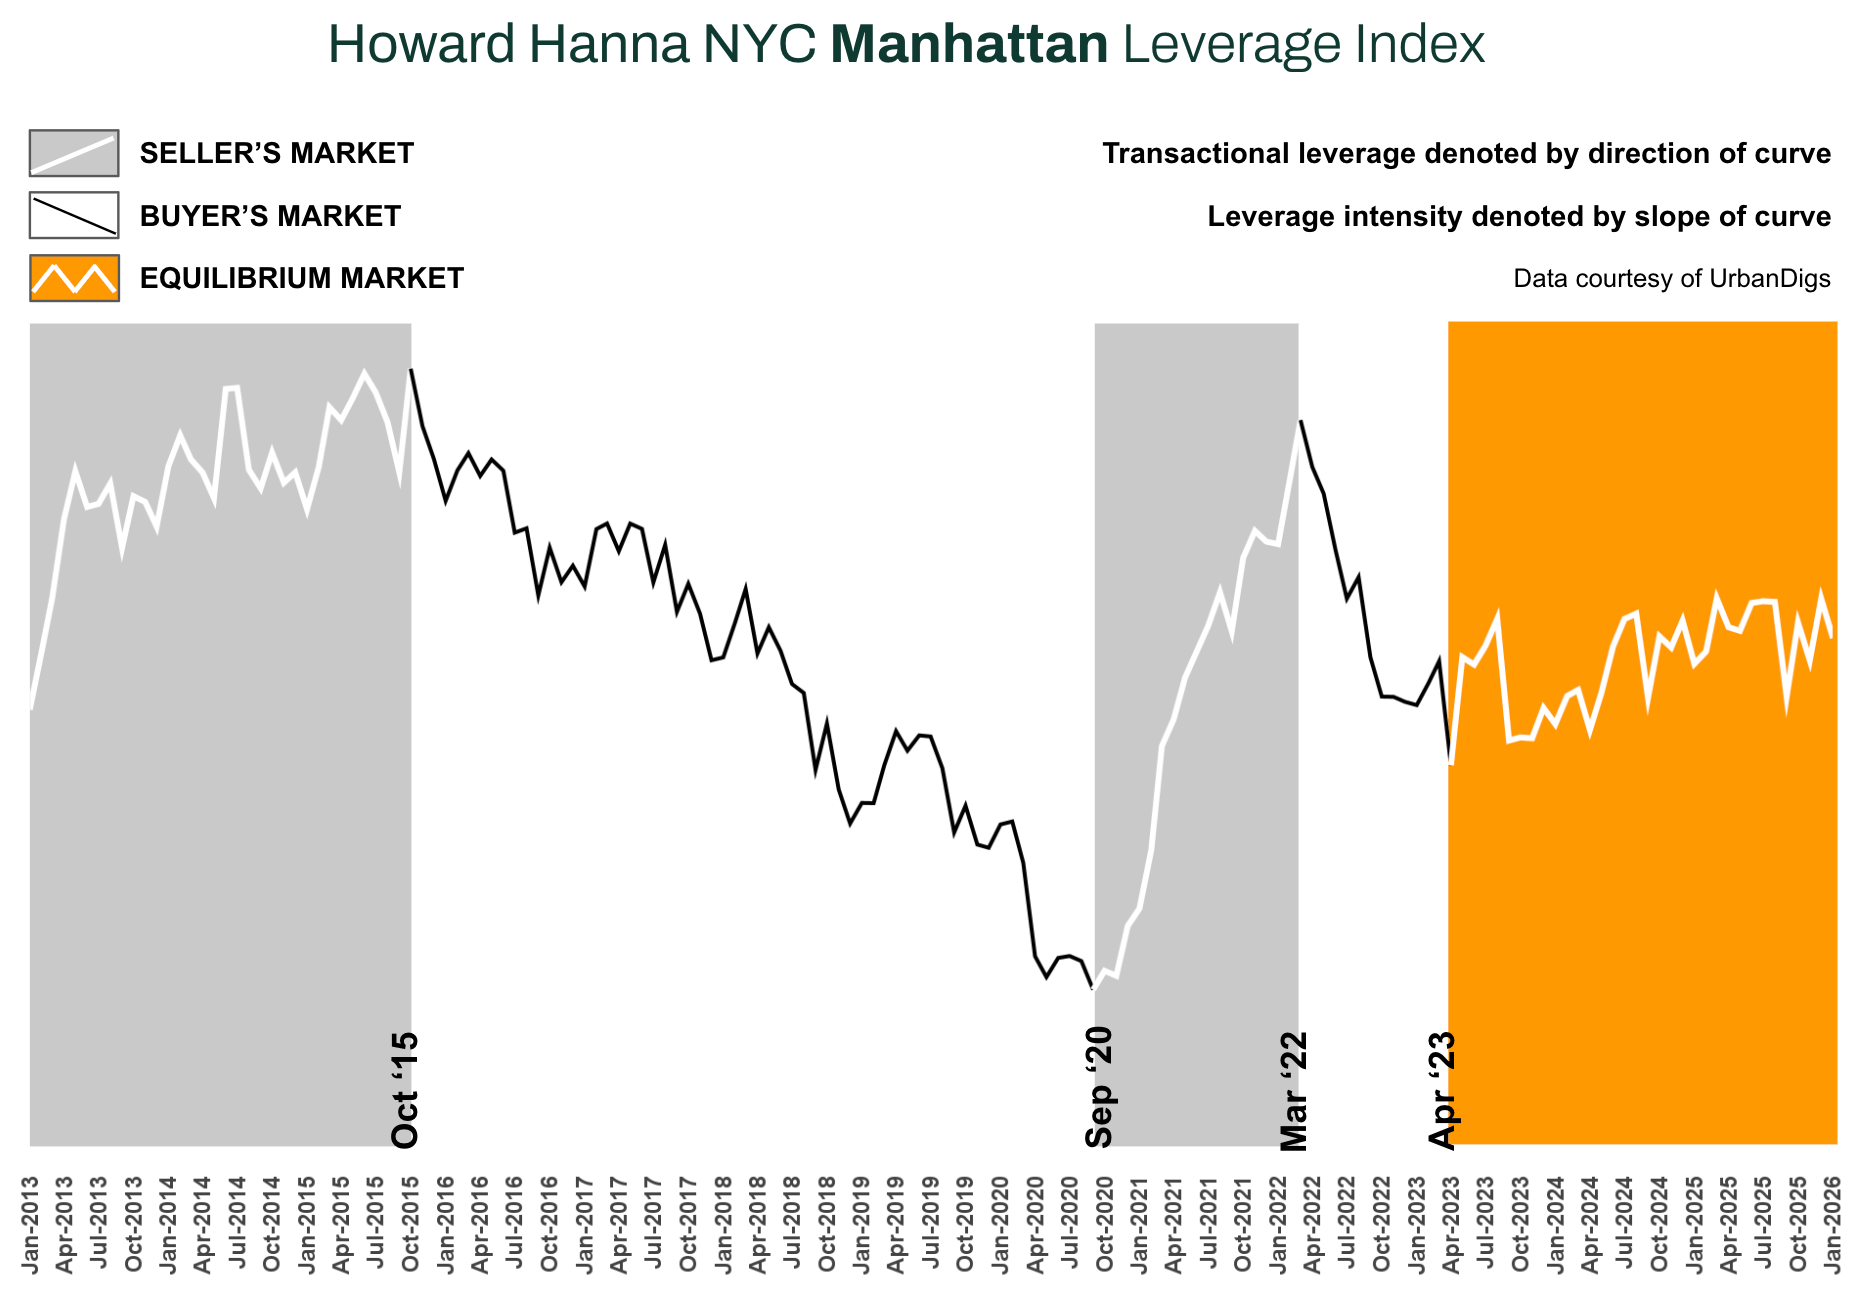
Howard Hanna NYC Manhattan Leverage Index
The Howard Hanna NYC Manhattan Leverage Index blends four key market signals – supply, demand, median PPSF, and median listing discount – to gauge the balance of power between buyers and sellers in Manhattan. It’s a proprietary index that distills these metrics into one indicator of market leverage. Direction Matters:
-
An upward-sloping curve = seller’s market
-
A downward-sloping curve = buyer’s market
The steeper the slope, the stronger the advantage for either side
In January 2026, the index edged slightly lower but remained firmly within neutral territory. Contract activity softened, improving buyer leverage marginally, while tighter listing discounts reinforced seller discipline. Median PPSF and inventory levels stayed balanced.
From a historical perspective, this environment resembles mid-cycle normalization phases such as 2013–2015, when the Federal Reserve began tapering its quantitative easing program and long-term mortgage rates briefly rose from roughly 3.5% to around 4.5%. That modest rate increase slowed price acceleration but did not trigger a broad market correction.
What’s different this cycle: Lenders have become more conservative in how they approve and structure mortgages, requiring stronger credit profiles, larger down payments, and more thorough income verification. This means fewer risky loans are being issued, which helps keep the market more stable. These factors continue to limit downside risk despite elevated rates.
Manhattan Supply
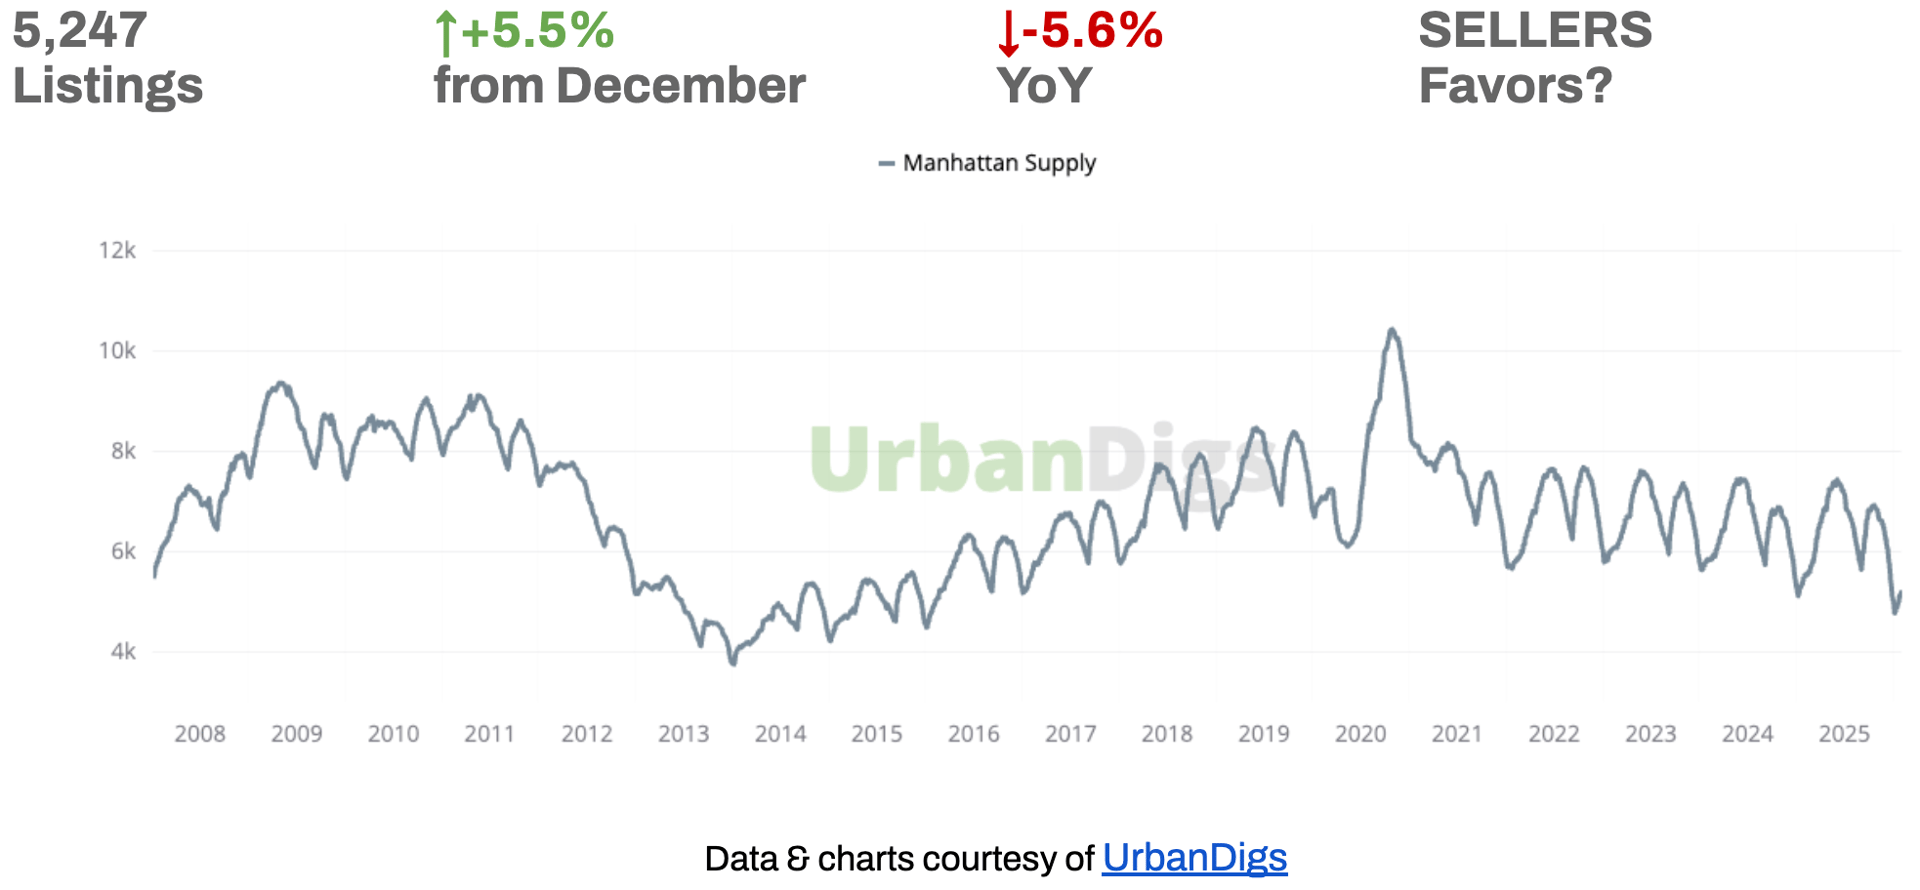
Manhattan Supply: Inventory Rises Seasonally but Remains Structurally Tight
Inventory increased from December as sellers re-entered the market post-holiday, a typical seasonal pattern. As of January, there were 5,247 active listings, representing a 5.5% month-over-month increase but still 5.6% below the same period last year. Overall, total supply remains meaningfully below last year’s levels and far below long-term averages.
🟦 Buyers: Incremental choice has improved search flexibility, particularly above $2M, but supply remains constrained for well-priced, mid-market homes.
🟪 Sellers: Year-over-year inventory contraction continues to support pricing, especially for turnkey properties.
Outlook: Expect inventory to build gradually into spring, but without the scale necessary to materially weaken pricing leverage.
Manhattan Demand
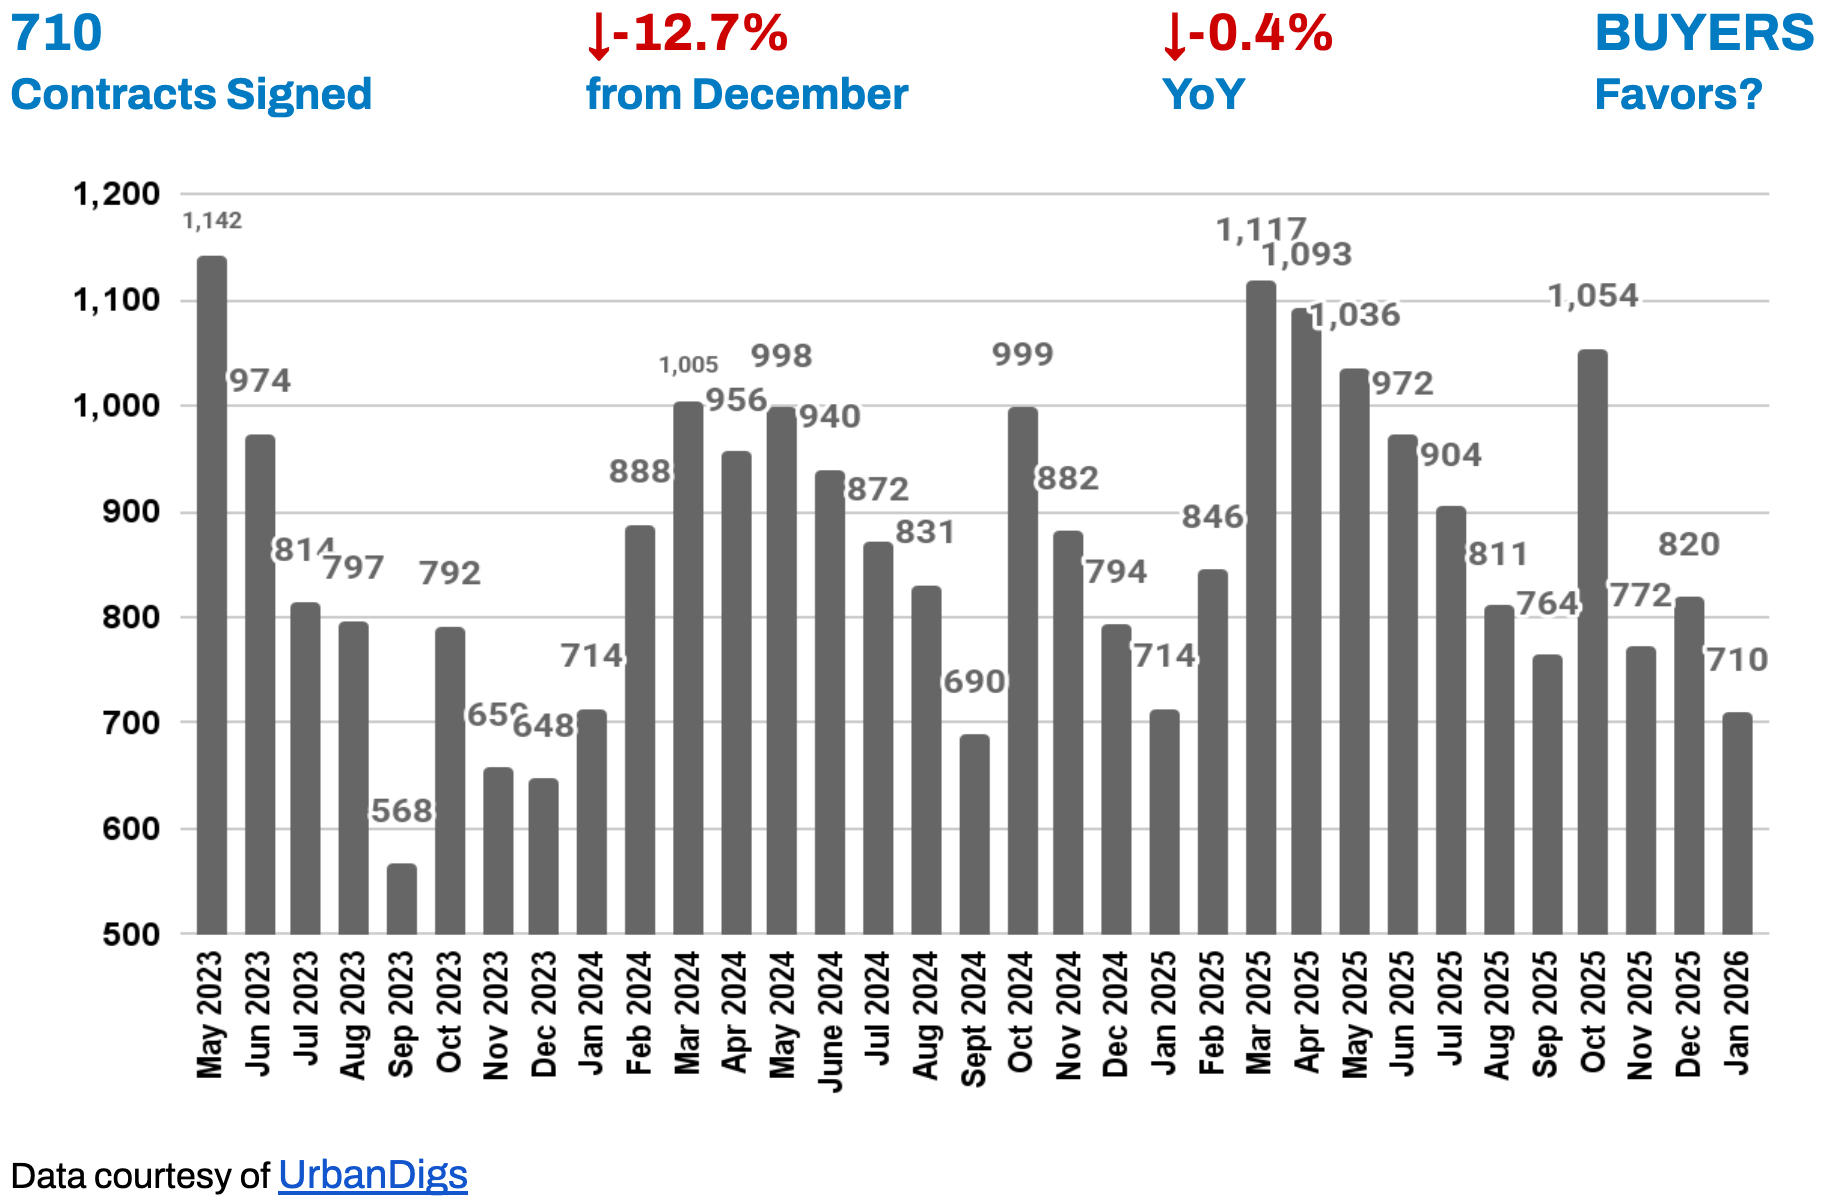
Manhattan Demand: Buyer Activity Pauses, Not Pulls Back
January demand softened following December’s seasonal surge, with 710 contracts signed, representing a 12.7% decline month-over-month and a slight 0.4% dip year-over-year. Importantly, activity did not collapse despite persistent rate pressure, indicating that underlying buyer interest remains intact even amid tighter financial conditions.
🟦 Buyers: More deliberate and rate-sensitive, but still active when value is evident.
🟪 Sellers: Listings that reflect current market realities continue to transact, while aspirational pricing faces resistance.
Outlook: Demand is likely to re-accelerate modestly in Q2, driven more by rate clarity than urgency.
Manhattan Median PPSF
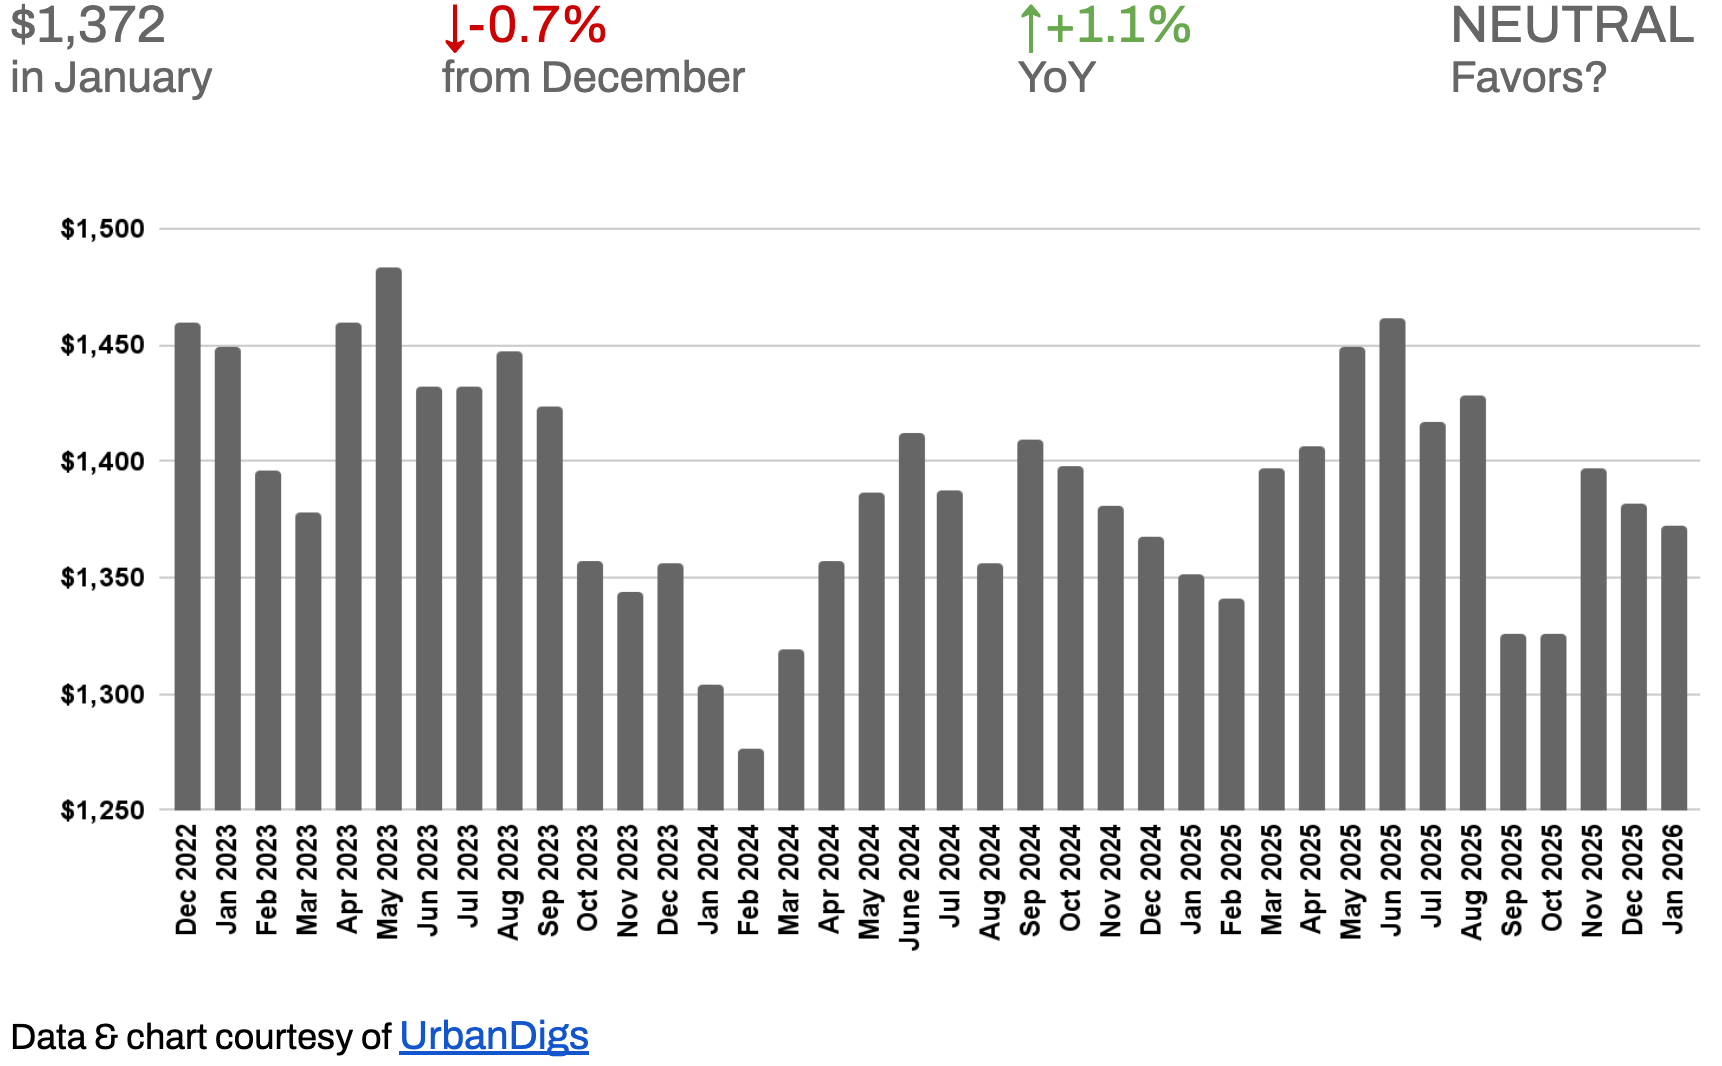
Manhattan Median PPSF: Price Per Square Foot Holds Firm Despite Short-Term Softness
Median PPSF: $1,372 (-0.7% from December 2025 and +1.1% YoY). The month-over-month PPSF dip reflects mix and seasonality rather than broad price deterioration, while year-over-year growth confirms that Manhattan pricing remains structurally supported.
🟦 Buyers: Short-term softness provides tactical negotiating opportunities.
🟪 Sellers: Long-term pricing stability reinforces confidence in holding periods.
Outlook: Expect range-bound pricing until financing conditions materially improve.
Manhattan Median Listing Discount
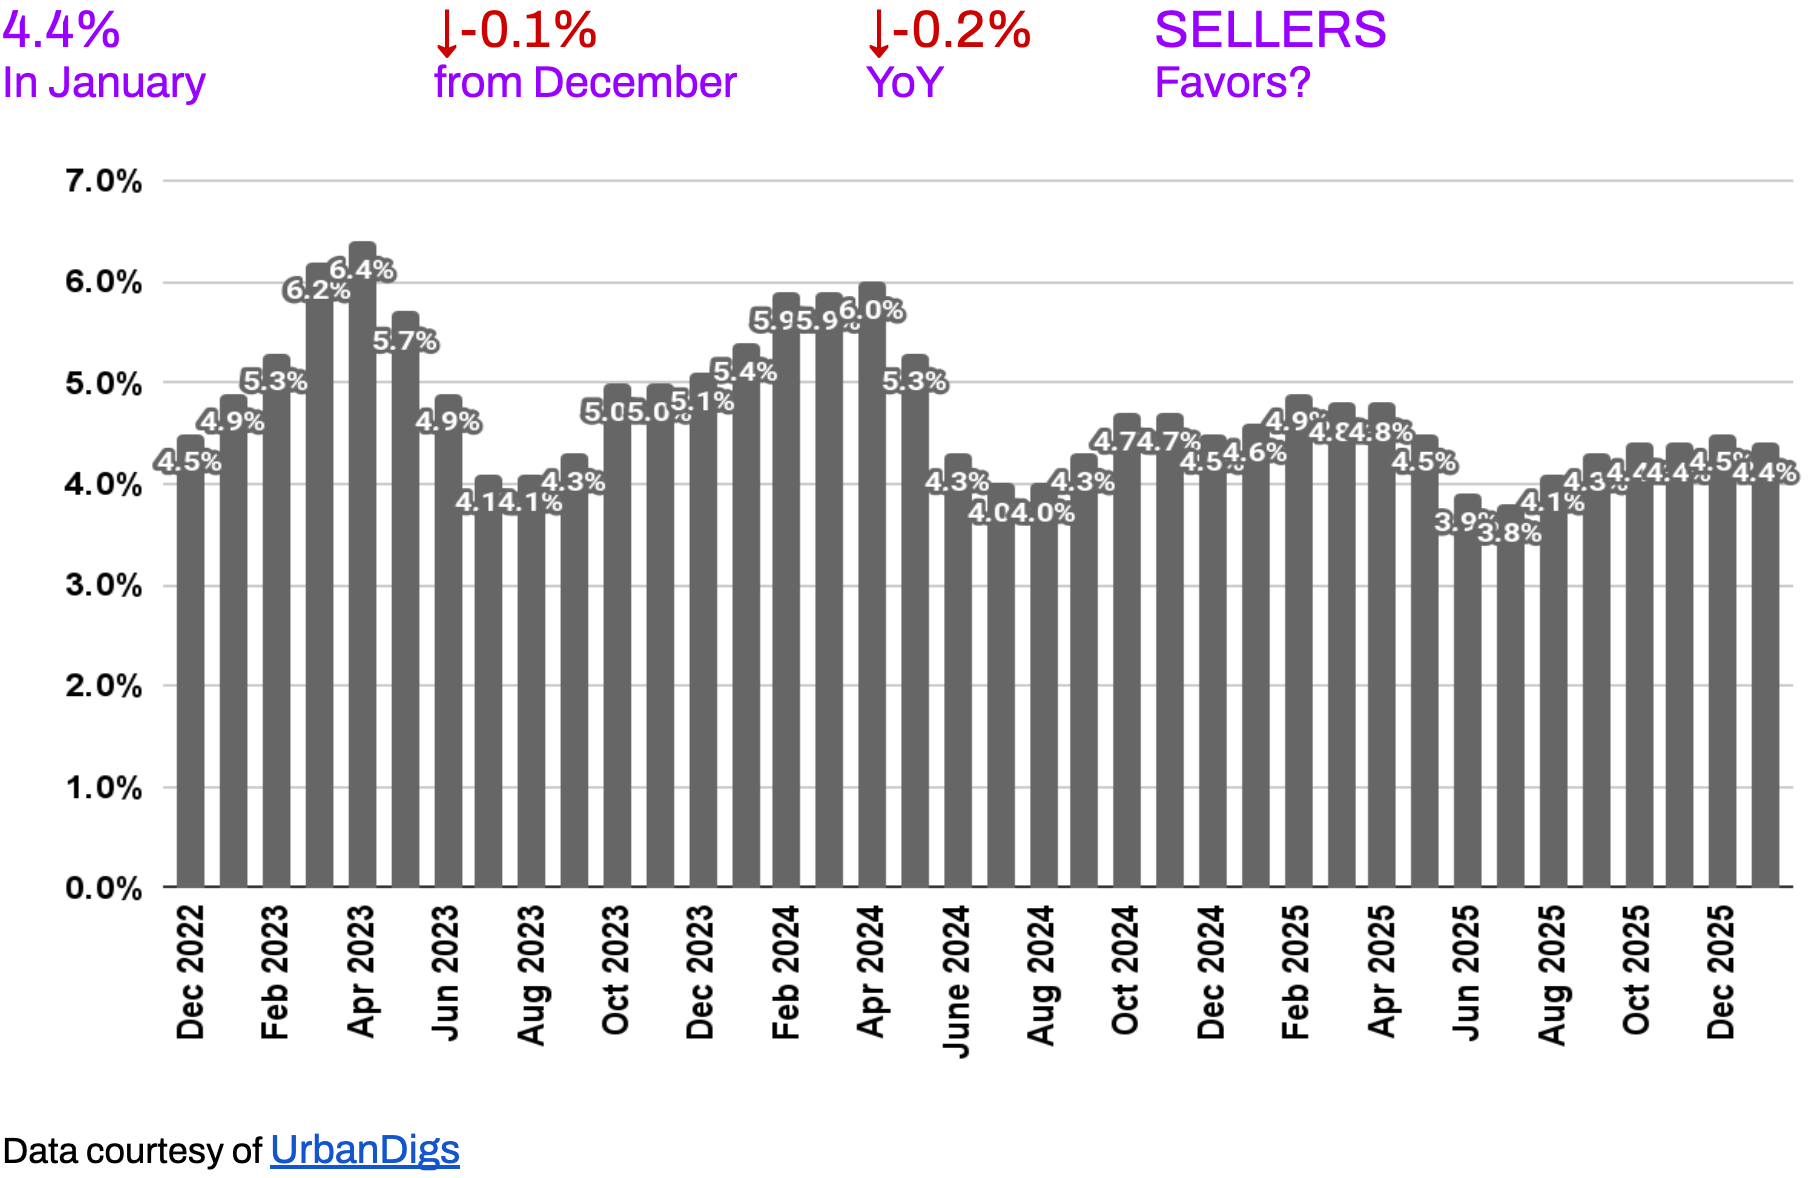
Manhattan Median Listing Discount: Sellers Stay Disciplined
Discounts tightened further to 4.4% in January 2026, down 0.1% from December 2025 and 0.2% year over year, remaining low by historical standards and signaling seller confidence and selective buyer engagement.
🟦 Buyers: Negotiations exist, but leverage is increasingly listing-specific.
🟪 Sellers: Well-positioned properties continue to achieve strong outcomes.
Outlook: Absent a macro shock, discounts are likely to remain compressed.
RENTAL REMARKS
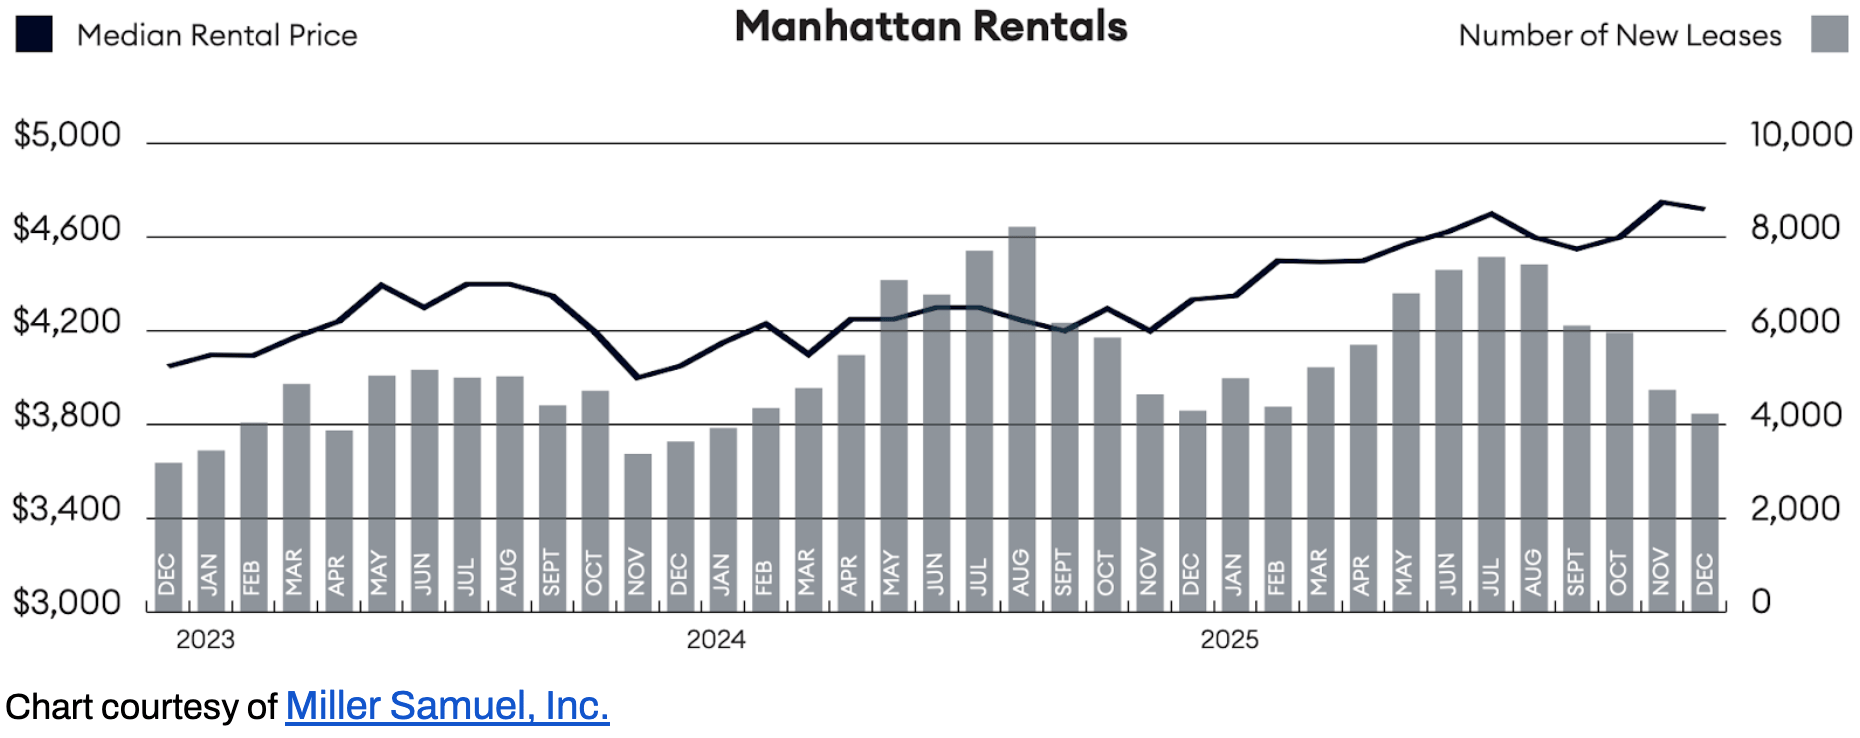
Rental Market: Elevated Rents Continue to Shape Buy-vs-Rent Decisions
Manhattan rents closed 2025 near record highs. December’s median rent of $4,720 marked only a modest seasonal dip, while annual growth remained robust at +8.9%. Inventory declined again, and bidding wars persisted.³ Outlook: High rents continue to anchor long-term ownership demand, even as financing costs challenge short-term affordability.
🟦 Renters: For renters, this means continued pressure on budgets and limited relief in the near term, making lease renewals and timing decisions more critical.
🟪 Landlords: For landlords, sustained rent levels support stable income streams and low vacancy risk, though tenant retention may require modest concessions or flexible terms as affordability strains persist.
MORTGAGE REMARKS
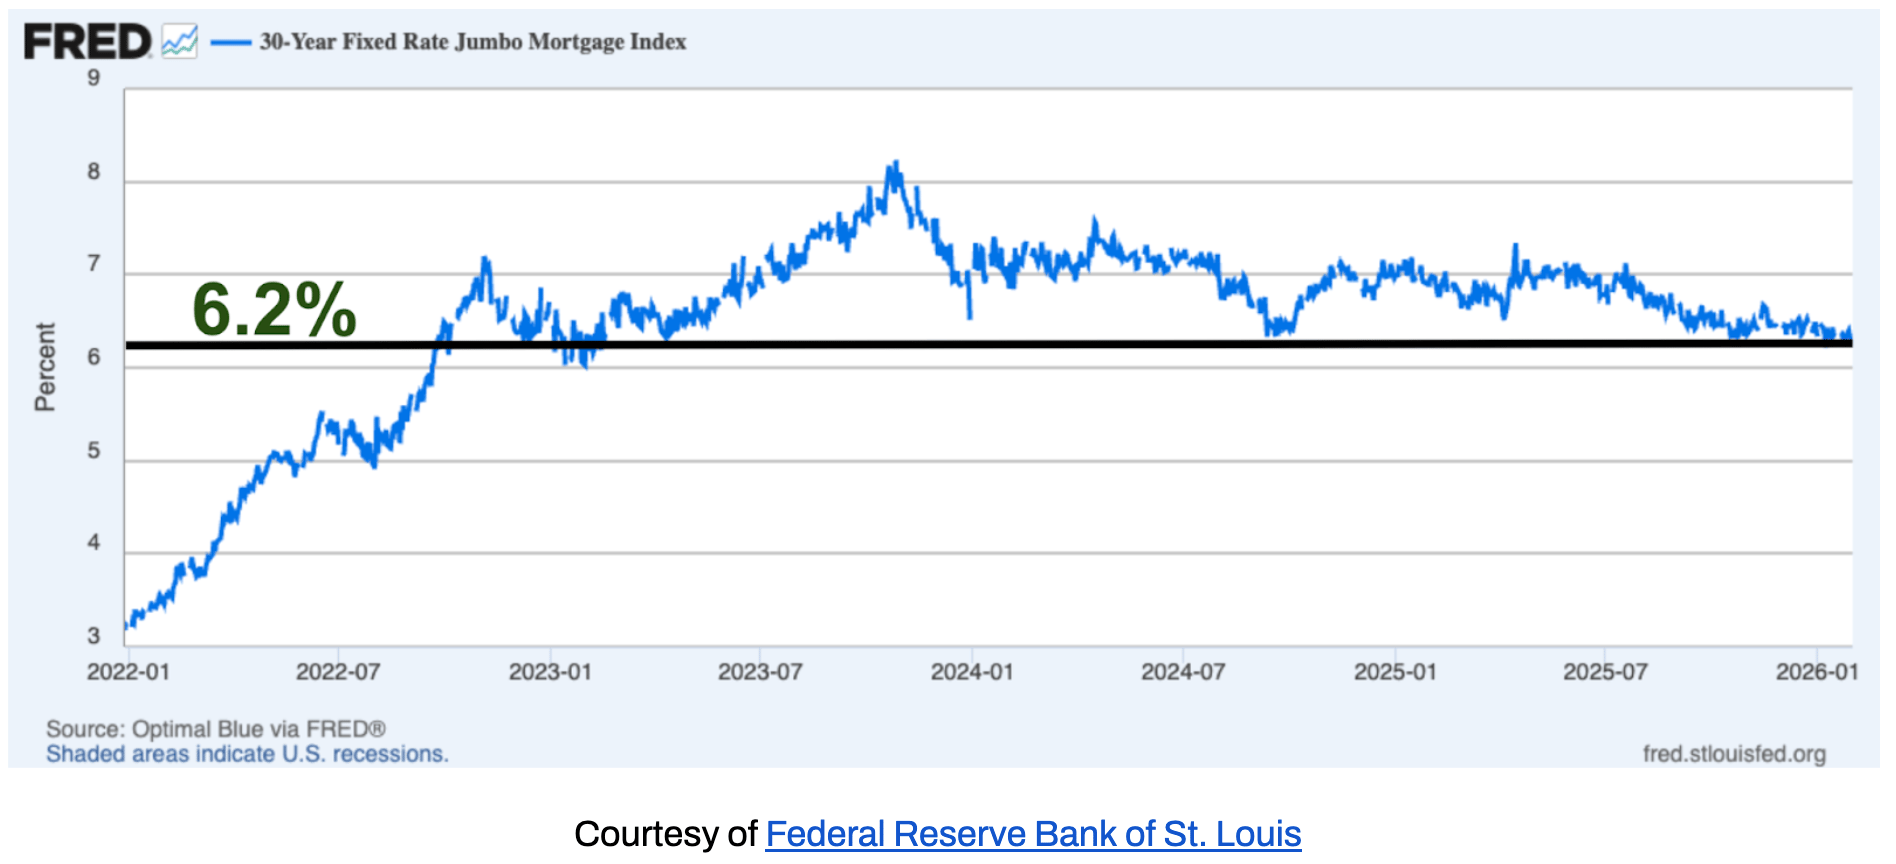
Mortgage Rates: Rates Stabilize, Reducing Shock Risk
By year-end, average 30-year jumbo rates settled near 6.23%⁴, down from 2025 peaks above 7%. The APR for jumbo loans (which factors in some fees) settled near 6.28%⁵ in January. While still elevated, rate stability has reduced transaction friction and improved planning confidence.
Market Drivers: While jumbo mortgages are not directly tied to the Fed funds rate, the Federal Reserve’s decision to hold policy rates in the 3.5%–3.75% range has reduced rate volatility by stabilizing long-term yields and bank credit spreads, helping anchor pricing for higher-balance loans.
Outlook: Even modest rate declines could unlock incremental demand, particularly among move-up buyers.
INVESTOR INSIGHTS: Normalization, Not Distress
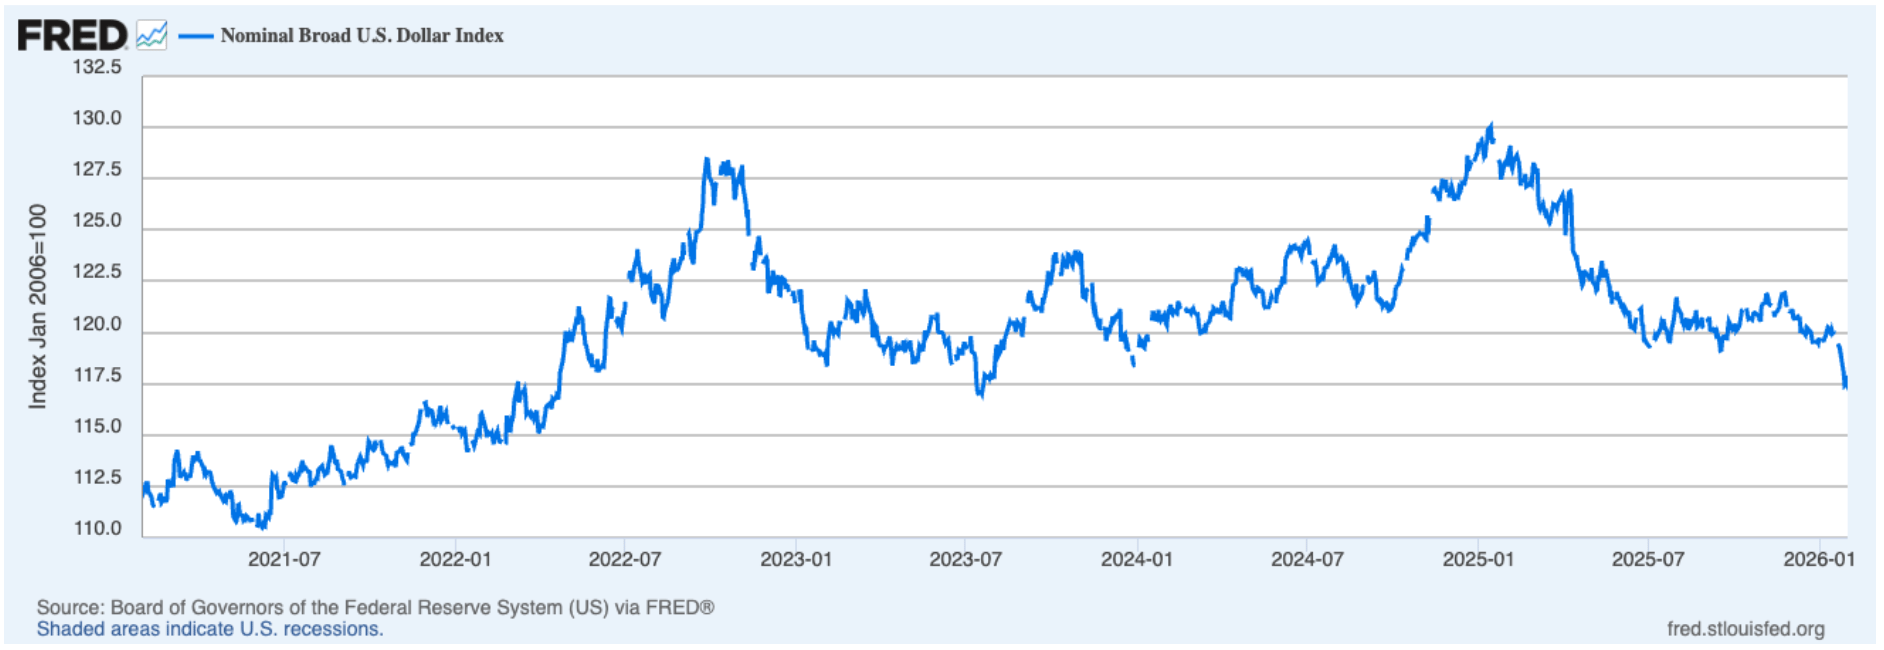
The trade-weighted U.S. dollar remains elevated relative to long-term norms, though it has moderated in recent months. While this continues to weigh on international purchasing power, it modestly favors U.S.-based buyers whose capital and income are dollar-denominated. Importantly, it has not translated into market stress in Manhattan or Brooklyn, reinforcing a normalization phase defined by selective demand, pricing discipline, and balanced leverage.
Domestic investors, by contrast, remain cautious. With investment mortgage rates hovering around 6.3% and stabilized rental yields in the 3–4% range, risk-adjusted returns for traditional condo and co-op investments are currently uninspiring. As a result, capital deployment is increasingly disciplined and underwriting-driven rather than momentum-based.
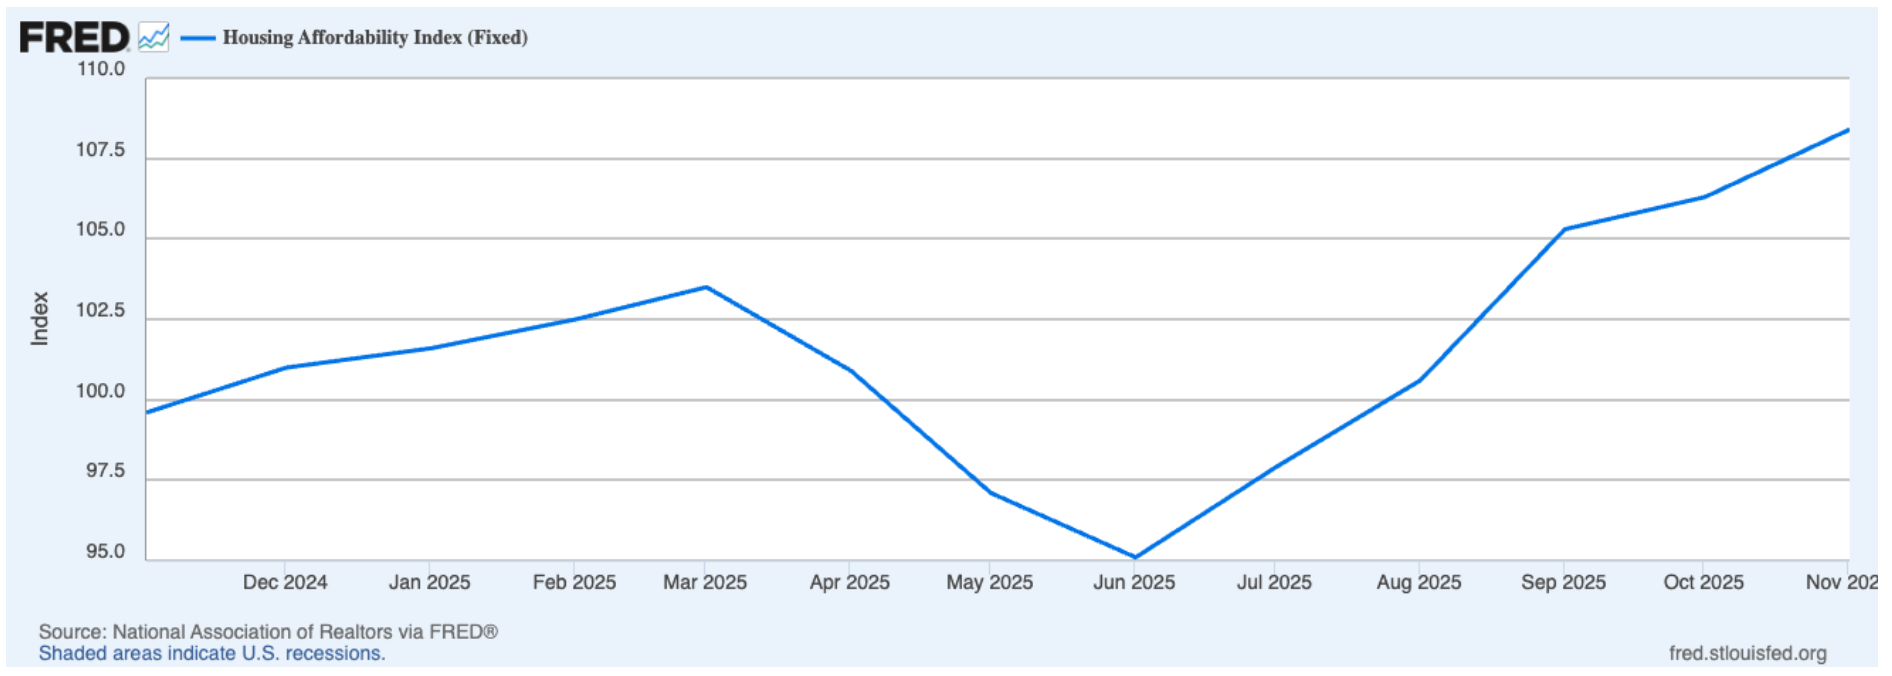
The chart below shows affordability bottoming in mid-2025 and improving into late 2025, meaning buyers can afford slightly more today - an effect felt more in Brooklyn than in Manhattan, where high prices still dominate affordability.
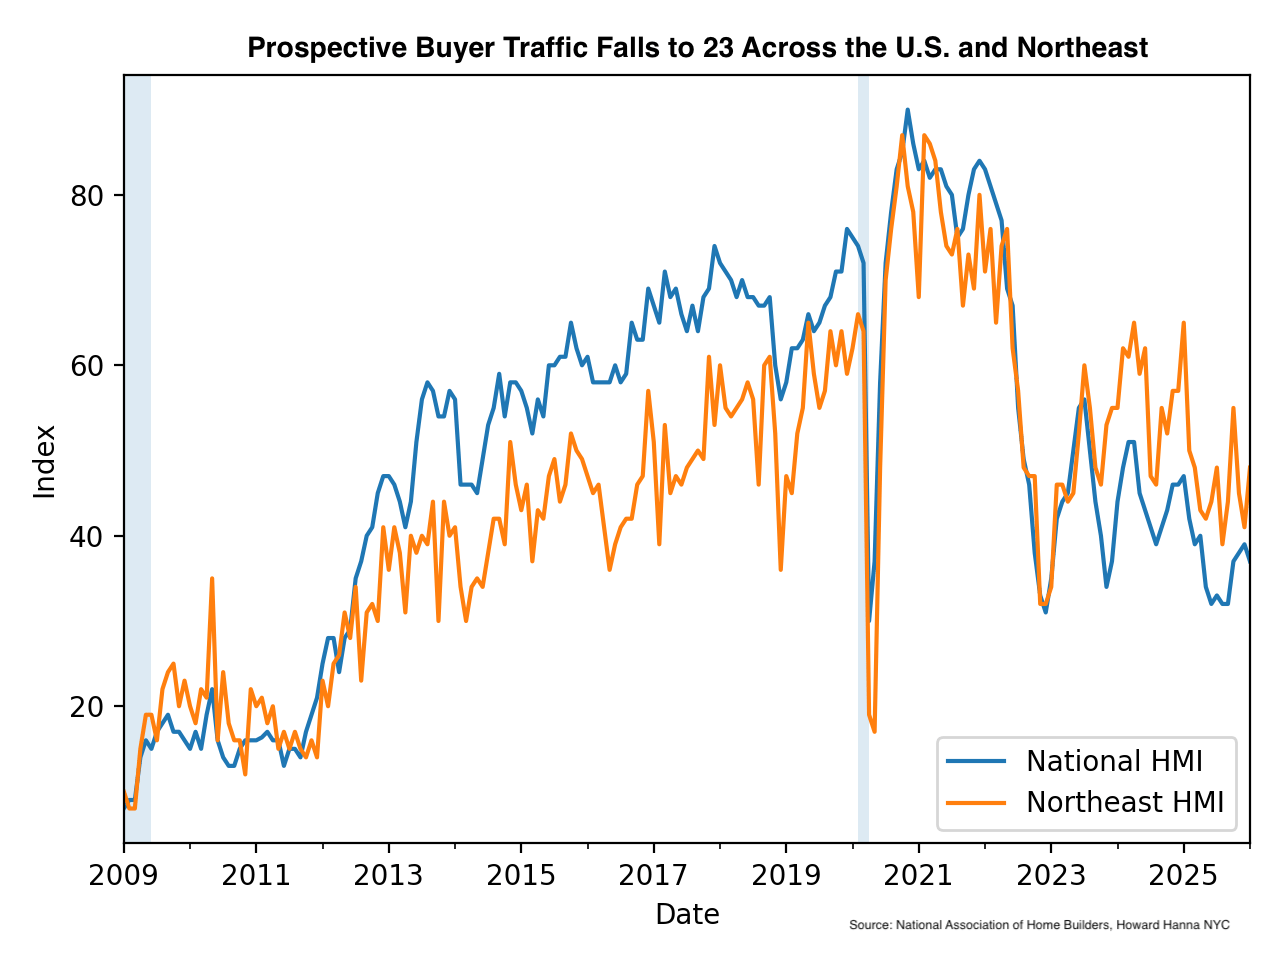
National and regional indicators reinforce this cooling but orderly backdrop. The NAHB/Wells Fargo Housing Market Index declined to 37 in January, reflecting weaker builder sentiment amid elevated rates. Subcomponents also softened:
- with current sales conditions at 41
- six-month sales expectations at 49
- and prospective buyer traffic falling to 23.
These readings signal pressure on new development activity rather than systemic housing stress.
Importantly, while national and Northeast builder sentiment has weakened, Manhattan’s transaction-based leverage metrics continue to point to stabilization, not deterioration. Unlike prior downturns driven by excess leverage or credit dislocation, today’s environment is defined by affordability constraints and higher capital costs. This is a fundamentally different risk profile and one that supports the view of normalization rather than distress.
Key Insight: Higher rates and a strong dollar are filtering demand, not breaking it. Capital is patient, pricing discipline is intact, and market balance remains largely stable.
Outlook: Absent a material macro shock or sharp rate move, investor activity is likely to remain selective through early 2026, with renewed interest skewed toward well-priced assets, income durability, and long-term hold strategies.
References
1. Data courtesy of UrbanDigs
2. According to the Howard Hanna NYC Manhattan Leverage Index
3. Data courtesy of Miller Samuel, Inc.
4. Data courtesy of Federal Reserve Bank of St. Louis
5. JUMBO mortgage rate APR data courtesy of Bank of America, Chase, and Wells Fargo
6. Cover Photo by Rihards Gederts - Howard Hanna NYC.
If you would like to chat about the most recent market activity,
feel free to contact us at [email protected] or
connect with one of our Advisors.
About Us
Howard Hanna NYC brings the nation’s largest independent and family-owned brokerage to New York City, uniting the strength of a national network with the insight and sophistication of a local firm. Formed through joining forces with Elegran Real Estate, Howard Hanna NYC delivers a seamless, full-service experience backed by more than 15,000 agents across 500 offices in 14 states. The firm’s forward-thinking, agent-first culture continues to shape the future of real estate across Manhattan and the Tri-State area.
Learn more at www.howardhannanyc.com.