
Manhattan Market Pulse ¹ September 2026
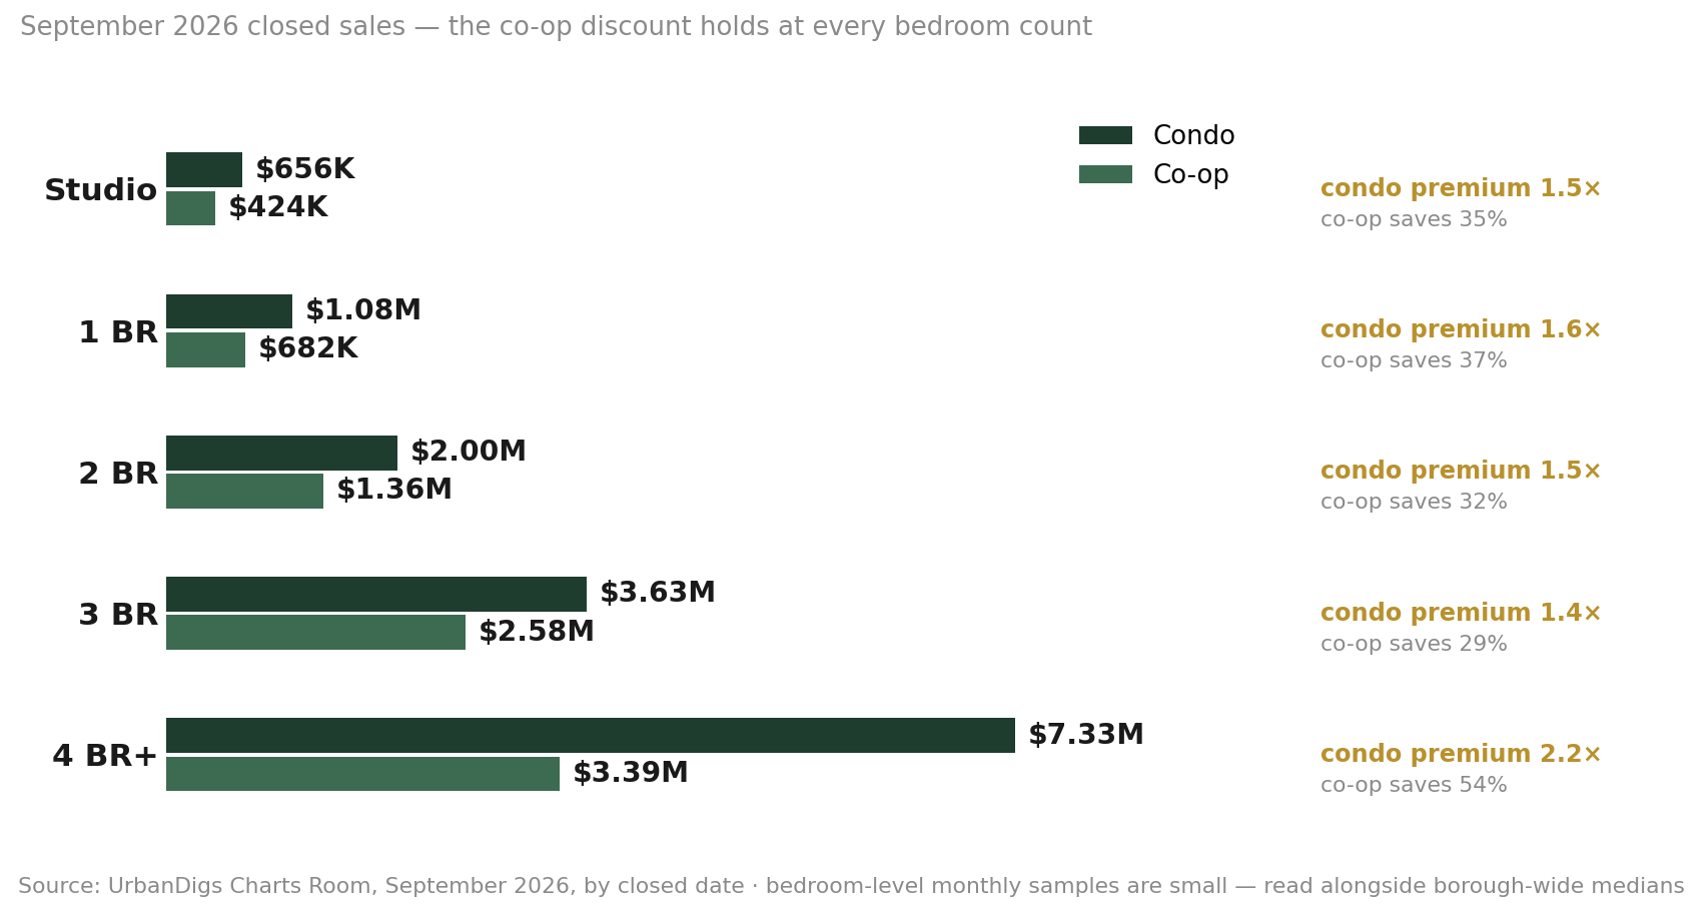
MEDIAN SALE PRICE BY BEDROOM — ALL MANHATTAN (SEPTEMBER, BY CLOSED DATE)
The Fall Wave Arrives: Buyers Gain Room as Rates Hit 2007 Highs
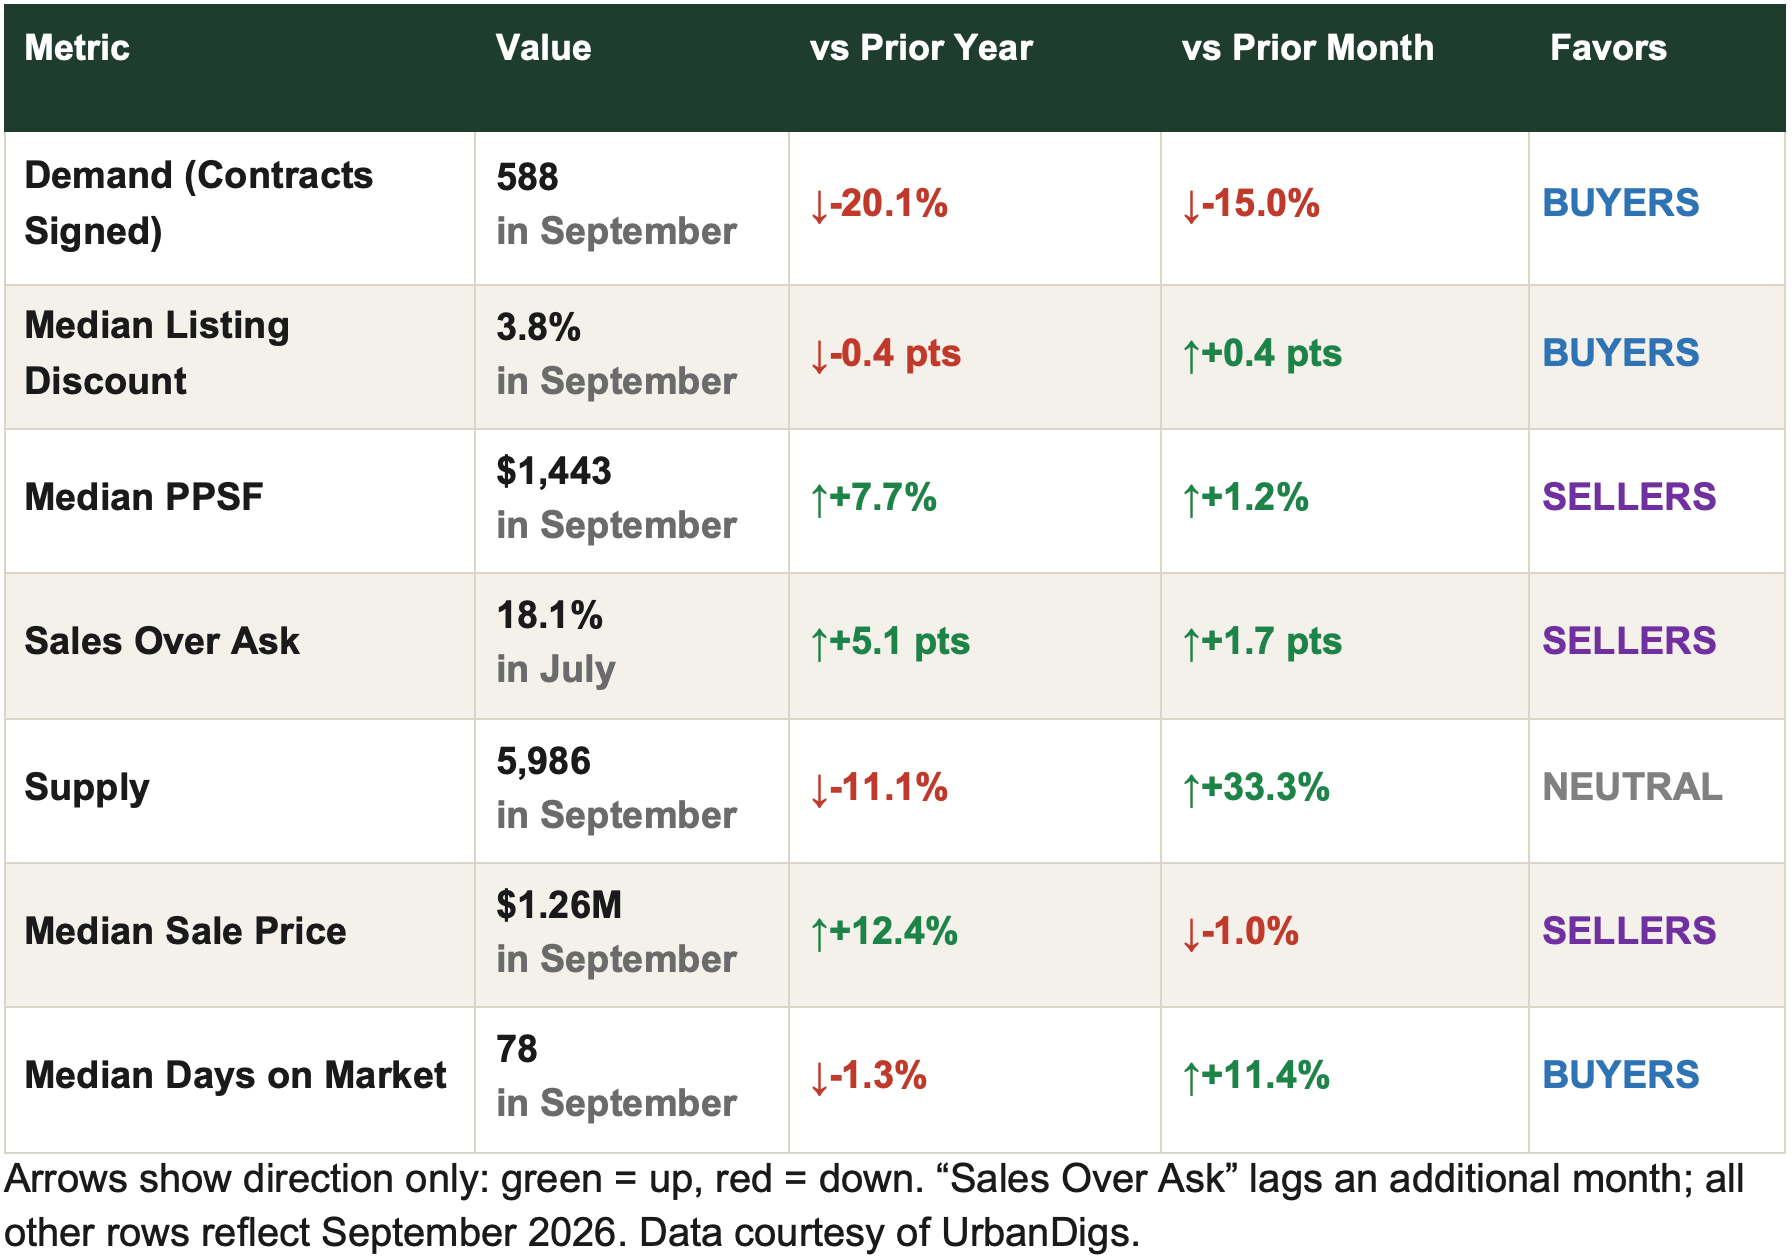
September flipped the script. Sellers returned after Labor Day and active listings rose 33% in a month, though supply is still 11% below last year. Buyers were slower to follow: contracts fell 20% from last September and the Market Pulse slipped below seasonal norms. Prices held, with the median sale price at $1.26M, up 12% on the year. What changed is leverage: price cuts more than doubled and the listing discount widened to 3.8%.
Bottom line: scarcity is easing and buyers can negotiate again, but closed prices have not moved. The gap is time and rates, not value.
Market Snapshot: Five Numbers That Matter
• 5,986 active listings, up 33% in a month and still 11% below last year.
• 588 contracts signed, down 20% from last September.
• $1.26M median sale price, up 12% year over year.
• 3.8% median listing discount, the widest since May.
• 1,070 price cuts, more than double August's count.
Key Takeaways
• Supply is back: nearly 2,000 new listings in September, four times August's pace.
• Buyers paused, they did not leave: pending sales still run 6% ahead of last year.
• By bedroom: large condos are firm (4BR+ up 17% YoY), while condo 2BRs and 3BRs are down 6–10%, where buyers have room.
Outlook
October is the test. If contracts catch up with the new listings, Manhattan stays balanced; if the 10-year holds above 5%, expect more price cuts before year-end.
For Sellers: Price to today's market, not last spring's. With 1,070 cuts in September, the homes that sell are priced right on day one.
For Buyers: This is the best negotiating window of 2026: more choice, longer days on market and wider discounts, especially on listings that sat through the summer.
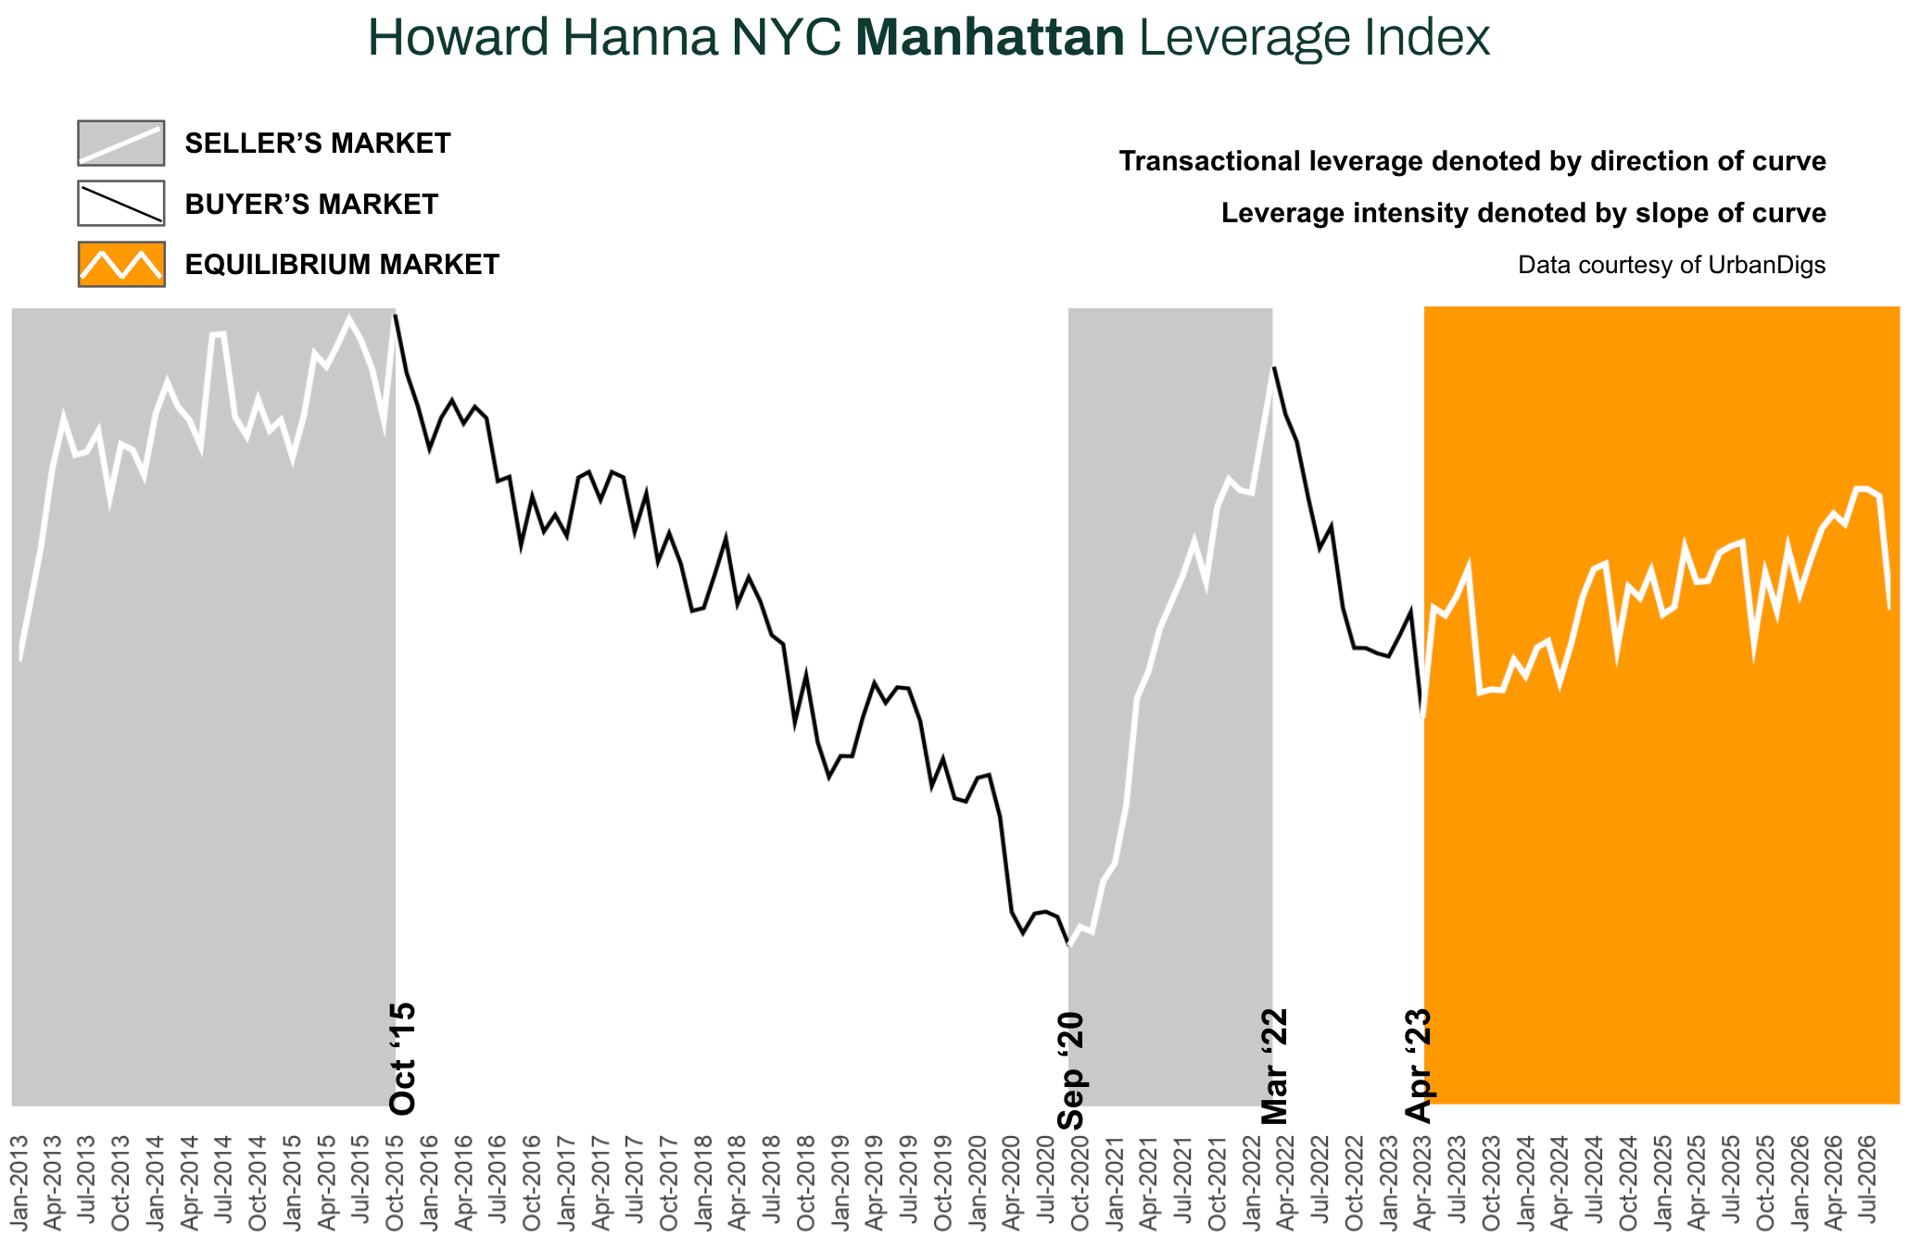
Howard Hanna NYC Manhattan Leverage Index
The Howard Hanna NYC Manhattan Leverage Index blends four signals, supply, demand, median PPSF and listing discount, into one reading of who holds the leverage. Tightening supply, rising demand, firming PPSF and shrinking discounts point to sellers; the reverse points to buyers.
The index fell to 0.22 from 0.71 in August, its second-sharpest monthly drop since 2023 and the lowest reading since last November. Demand cooled and the discount widened, while supply is still below last year and per-foot pricing favors sellers. Manhattan remains in equilibrium, now tilting toward buyers. September dips are partly seasonal, so October will confirm the trend.
Manhattan Supply

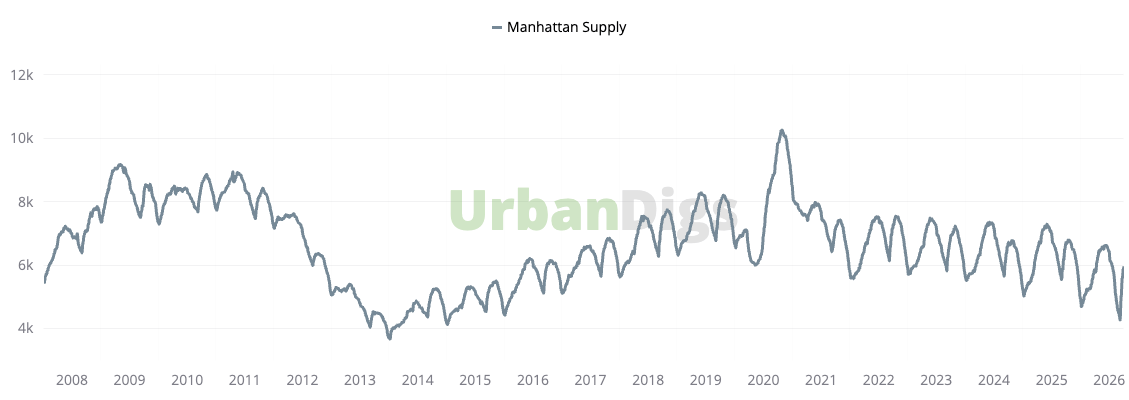
THE FALL WAVE: LISTINGS UP A THIRD IN A MONTH
Active listings rose to 5,986 in September as 1,940 new listings came to market, up from 526 in August. Supply is still 11% below last September, so scarcity has eased rather than ended.
Buyers: More choice than at any point since spring. Take the time to compare.
Sellers: You now compete with a full shelf. Presentation and pricing matter more than they did in August.

Photo by Rihards Gederts | Howard Hanna NYC
Manhattan Demand

CONTRACTS SLIP 20% BELOW LAST YEAR
Buyers signed 588 contracts in September, down 15% from August and 20% from last September. Pending sales still run 6% ahead of last year, so the pipeline is intact; new deals are what slowed.
Buyers: Fewer rival bidders per listing. Use it.
Sellers: Expect longer timelines. Serious buyers are active but deliberate.
Manhattan Median PPSF

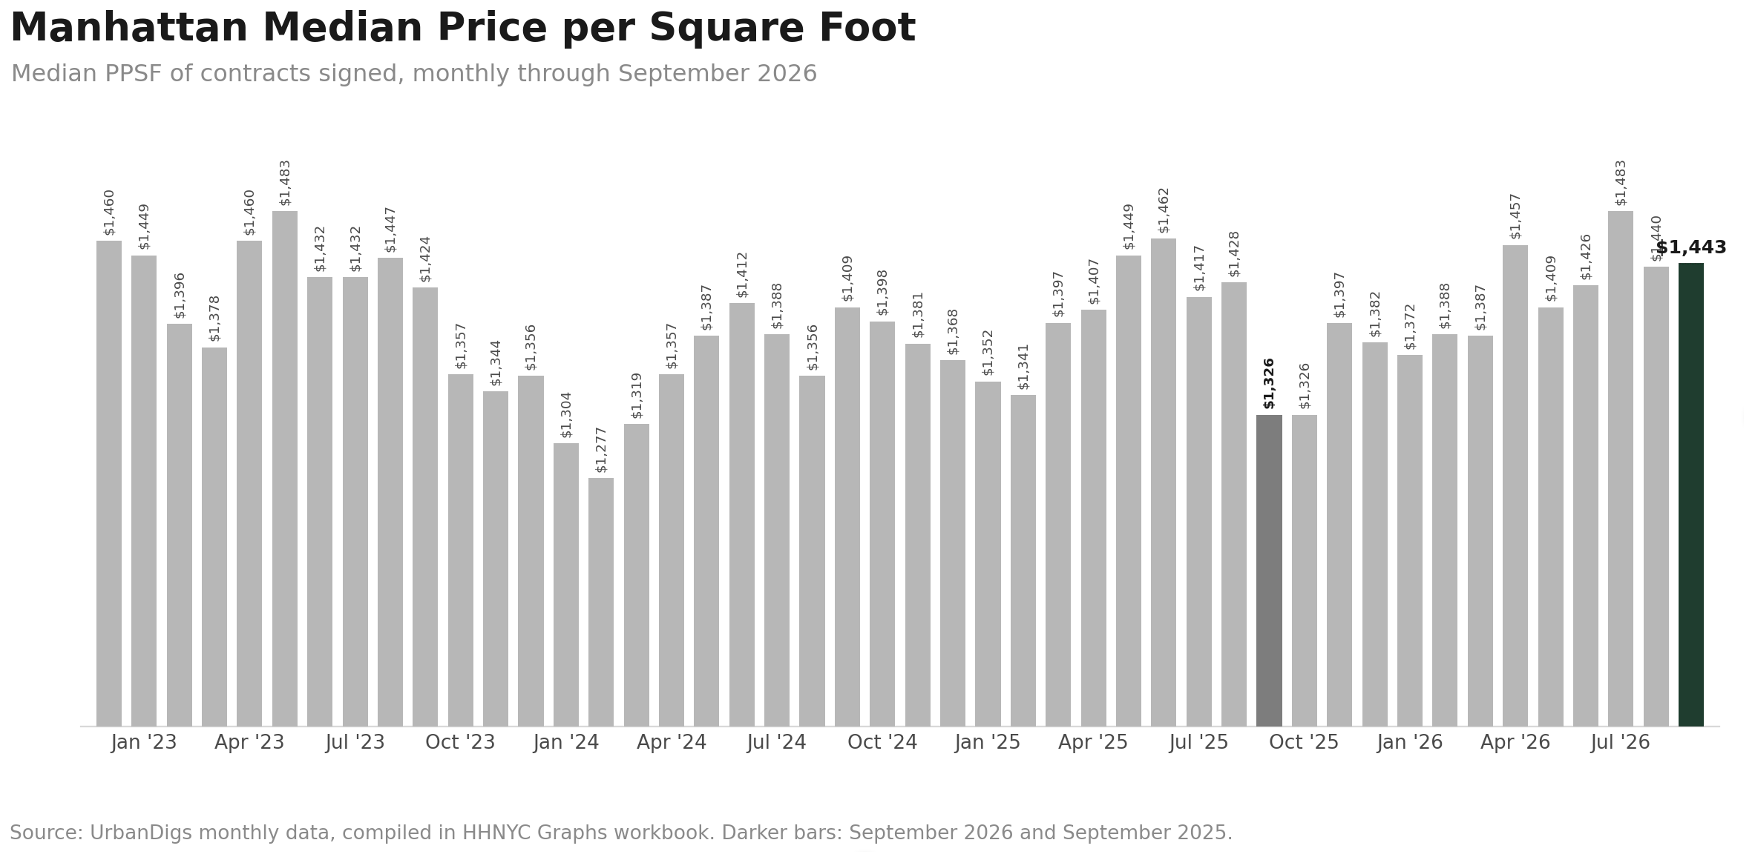
PER-FOOT PRICING HOLDS NEAR 2026 HIGHS
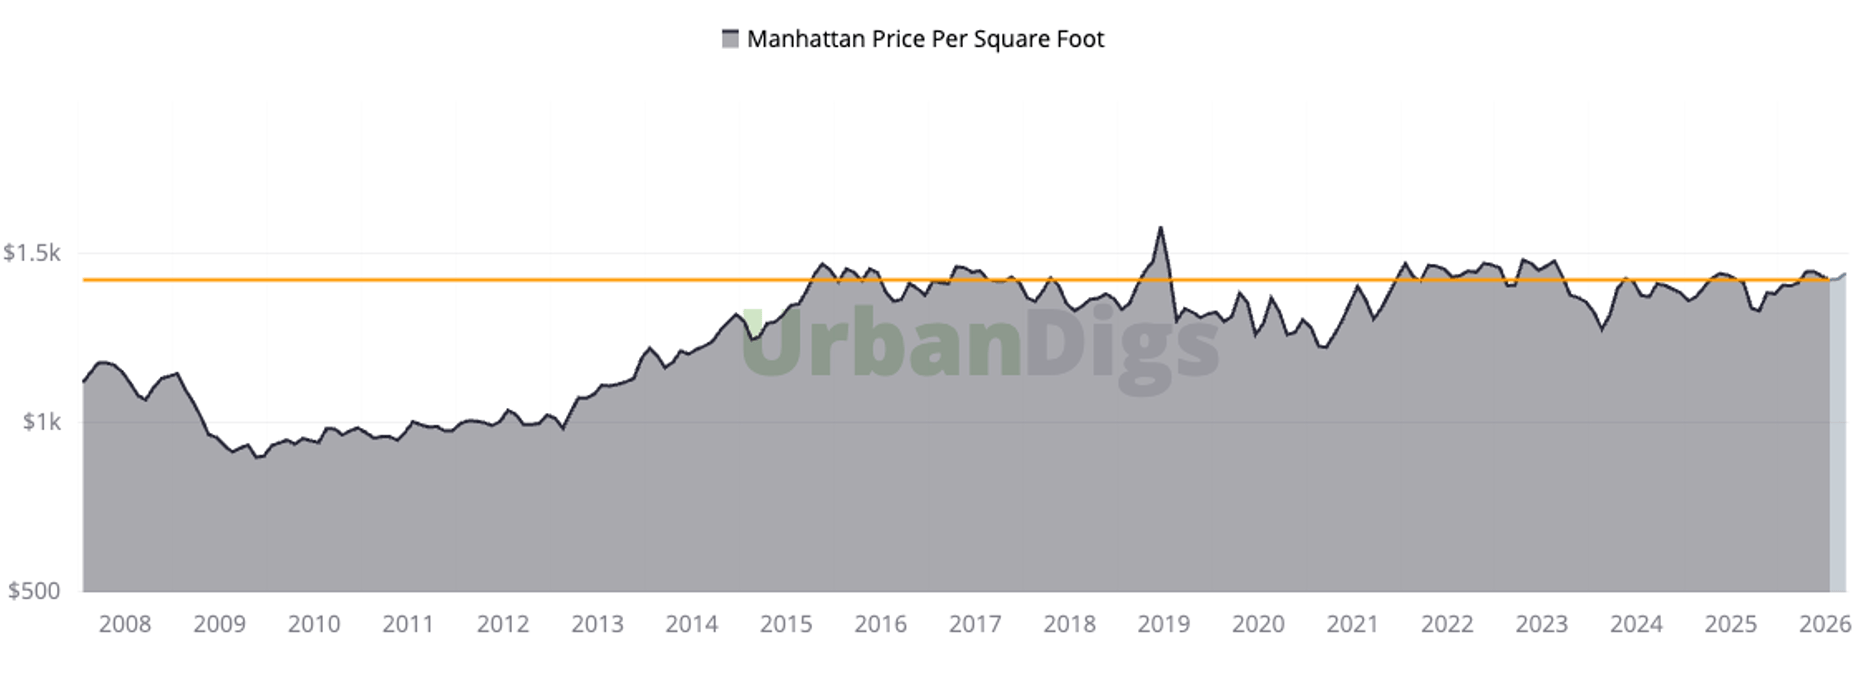
Median PPSF was $1,443, up 1% from August and 8% from last year. Prices held as activity cooled because the homes that trade are the well-located, well-priced ones.
Buyers: Headline prices are not falling. Your leverage is in terms and discounts, not the per-foot number.
Sellers: Comparables still support confident pricing, as long as the home is ready to show.
Manhattan Median Listing Discount

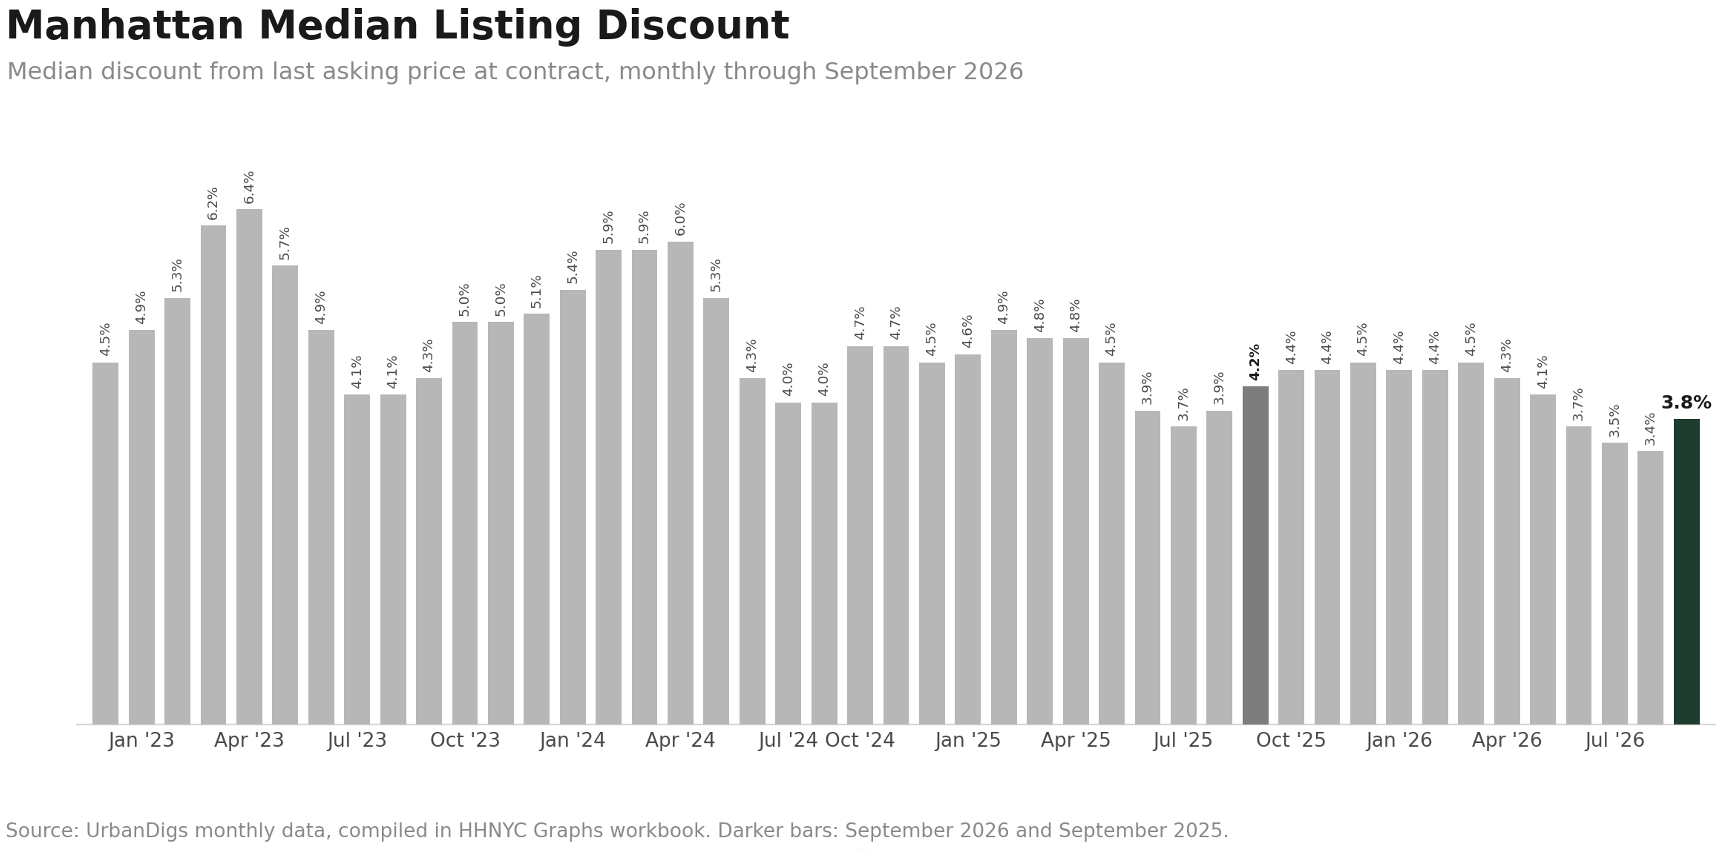
NEGOTIATING ROOM OPENS UP
The median listing discount widened to 3.8% from 3.4% in August, the most room buyers have had since May. On a $1.5M listing, that is roughly $57,000 off ask.
Buyers: Ask for more on listings that sat through the summer; homes past 120 days negotiate around 9%.
Sellers: Well-priced listings still close near ask. Overpriced ones are where the discount is widening.
Rental Remarks
RENTS HOLD NEAR RECORDS AS RENTERS STAY PUT
Manhattan's median asking rent held at $4,995 in August, up 5% on the year, per StreetEasy. Rental inventory fell 8% as tenants renewed rather than moved. Jonathan Miller's closed-lease data tells the same story: listings down 45% from last year and more than one in five rentals leasing over ask. The relief valve is price cuts, now on 20% of listings, up from 17% in July.
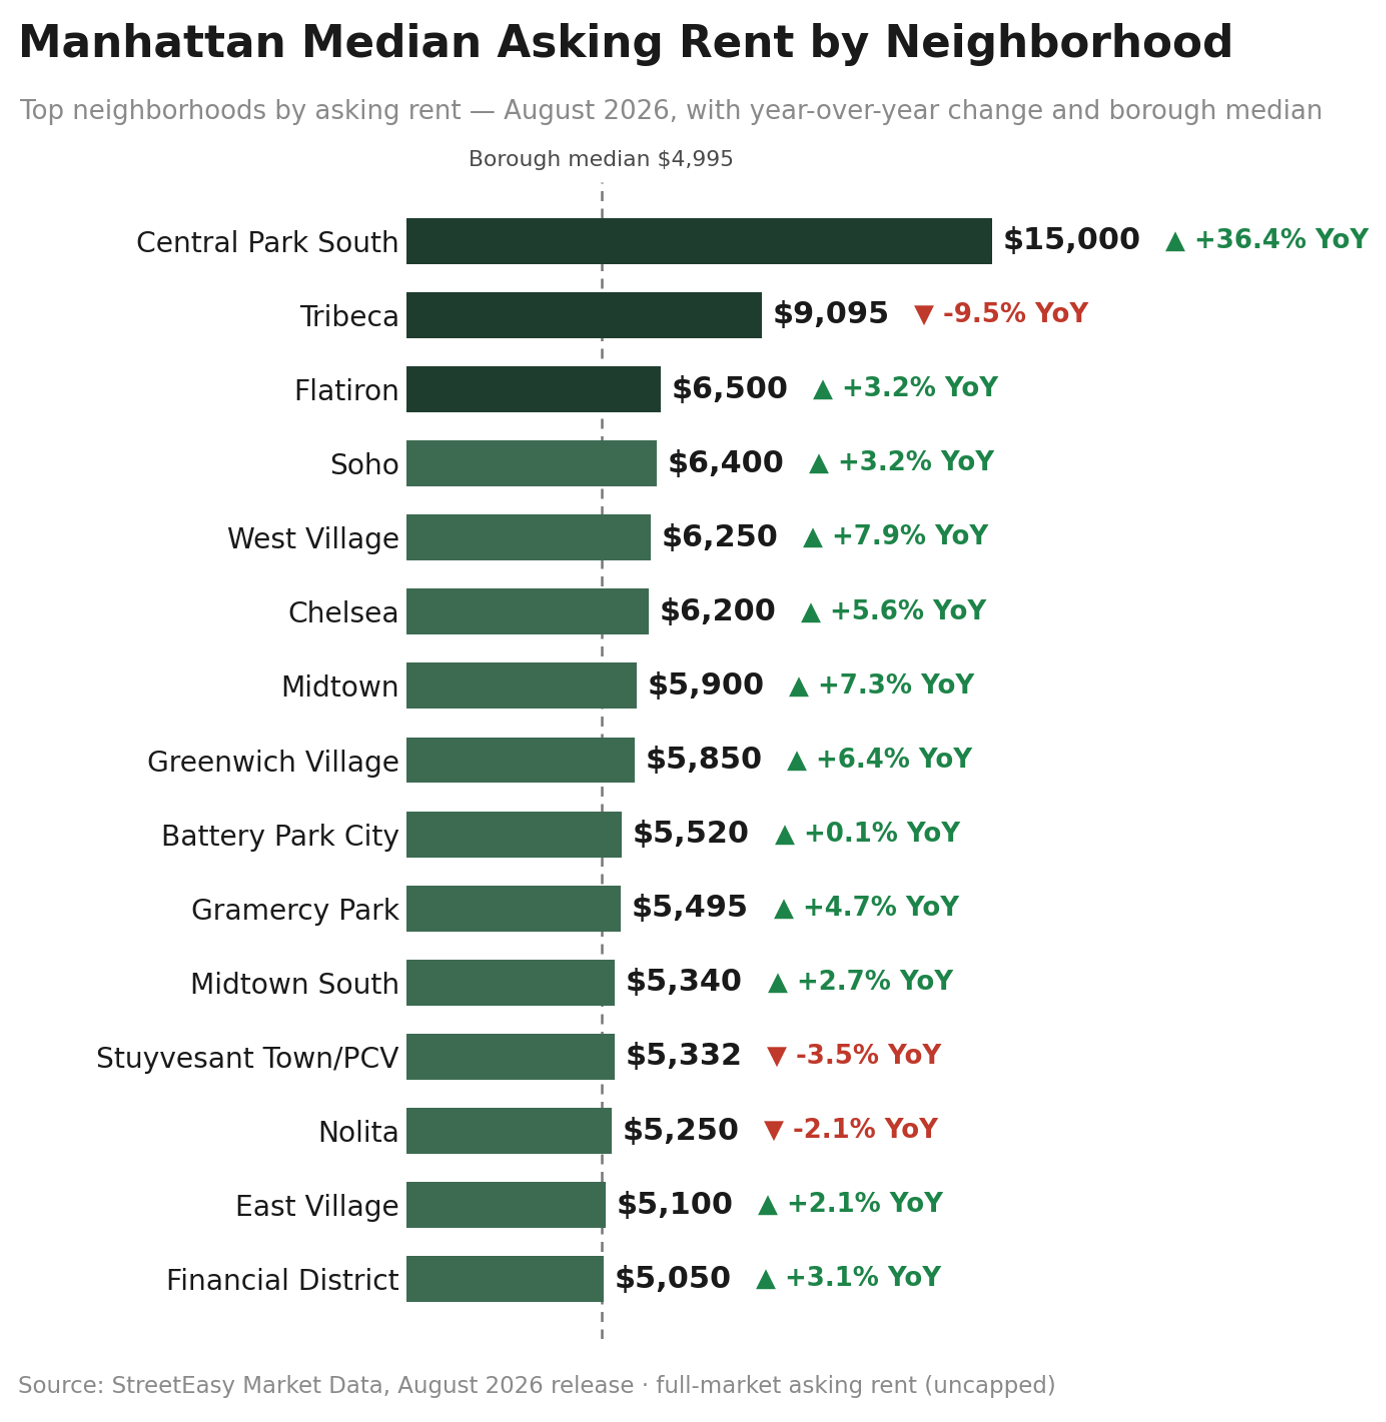
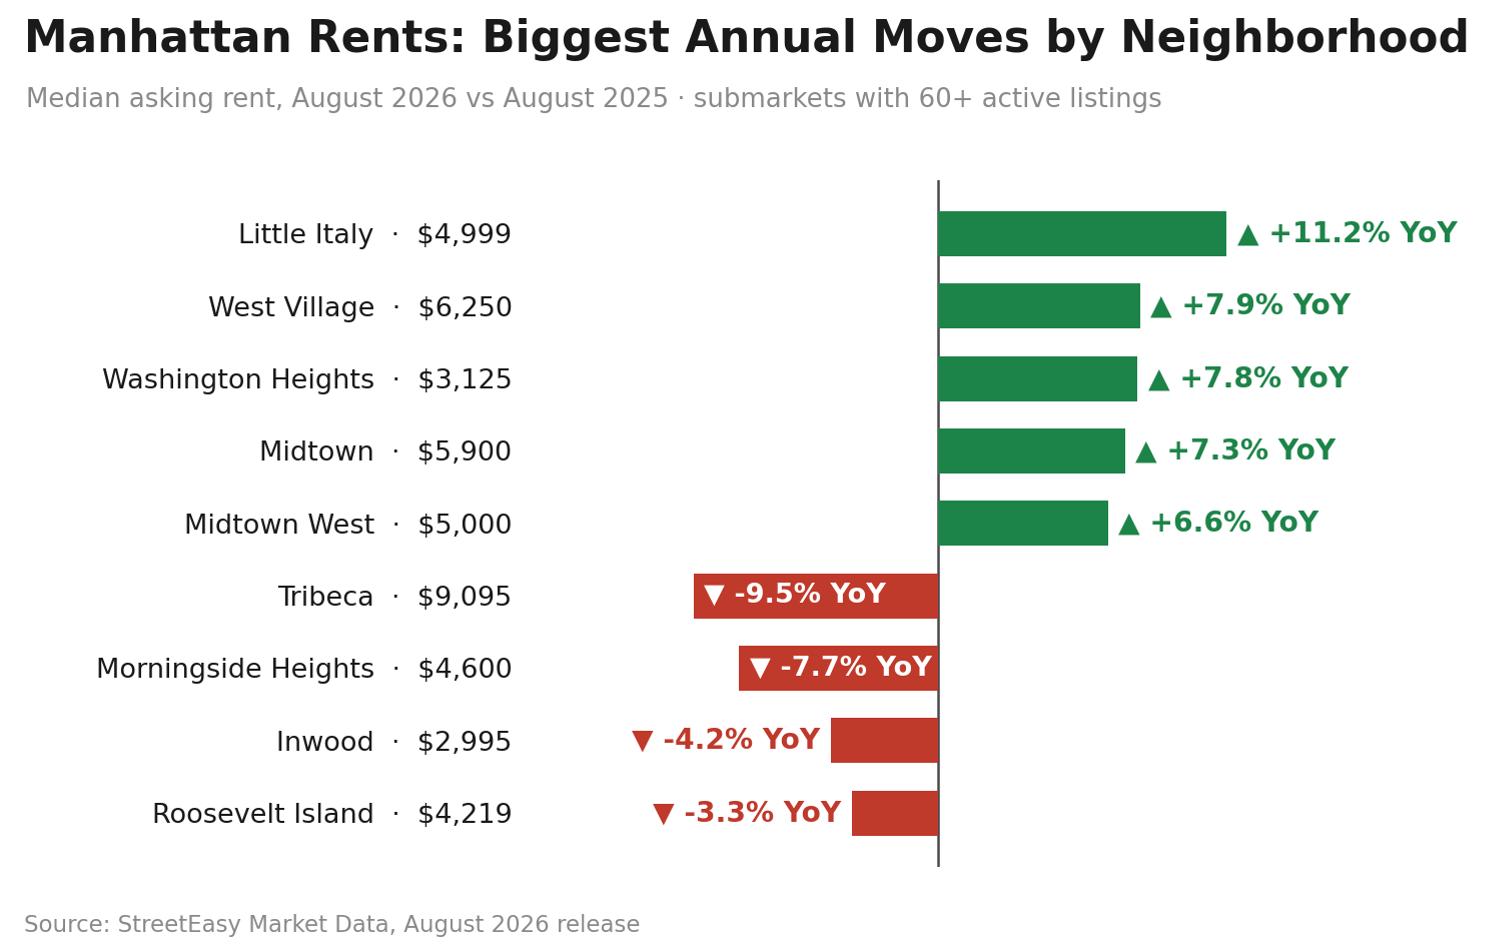
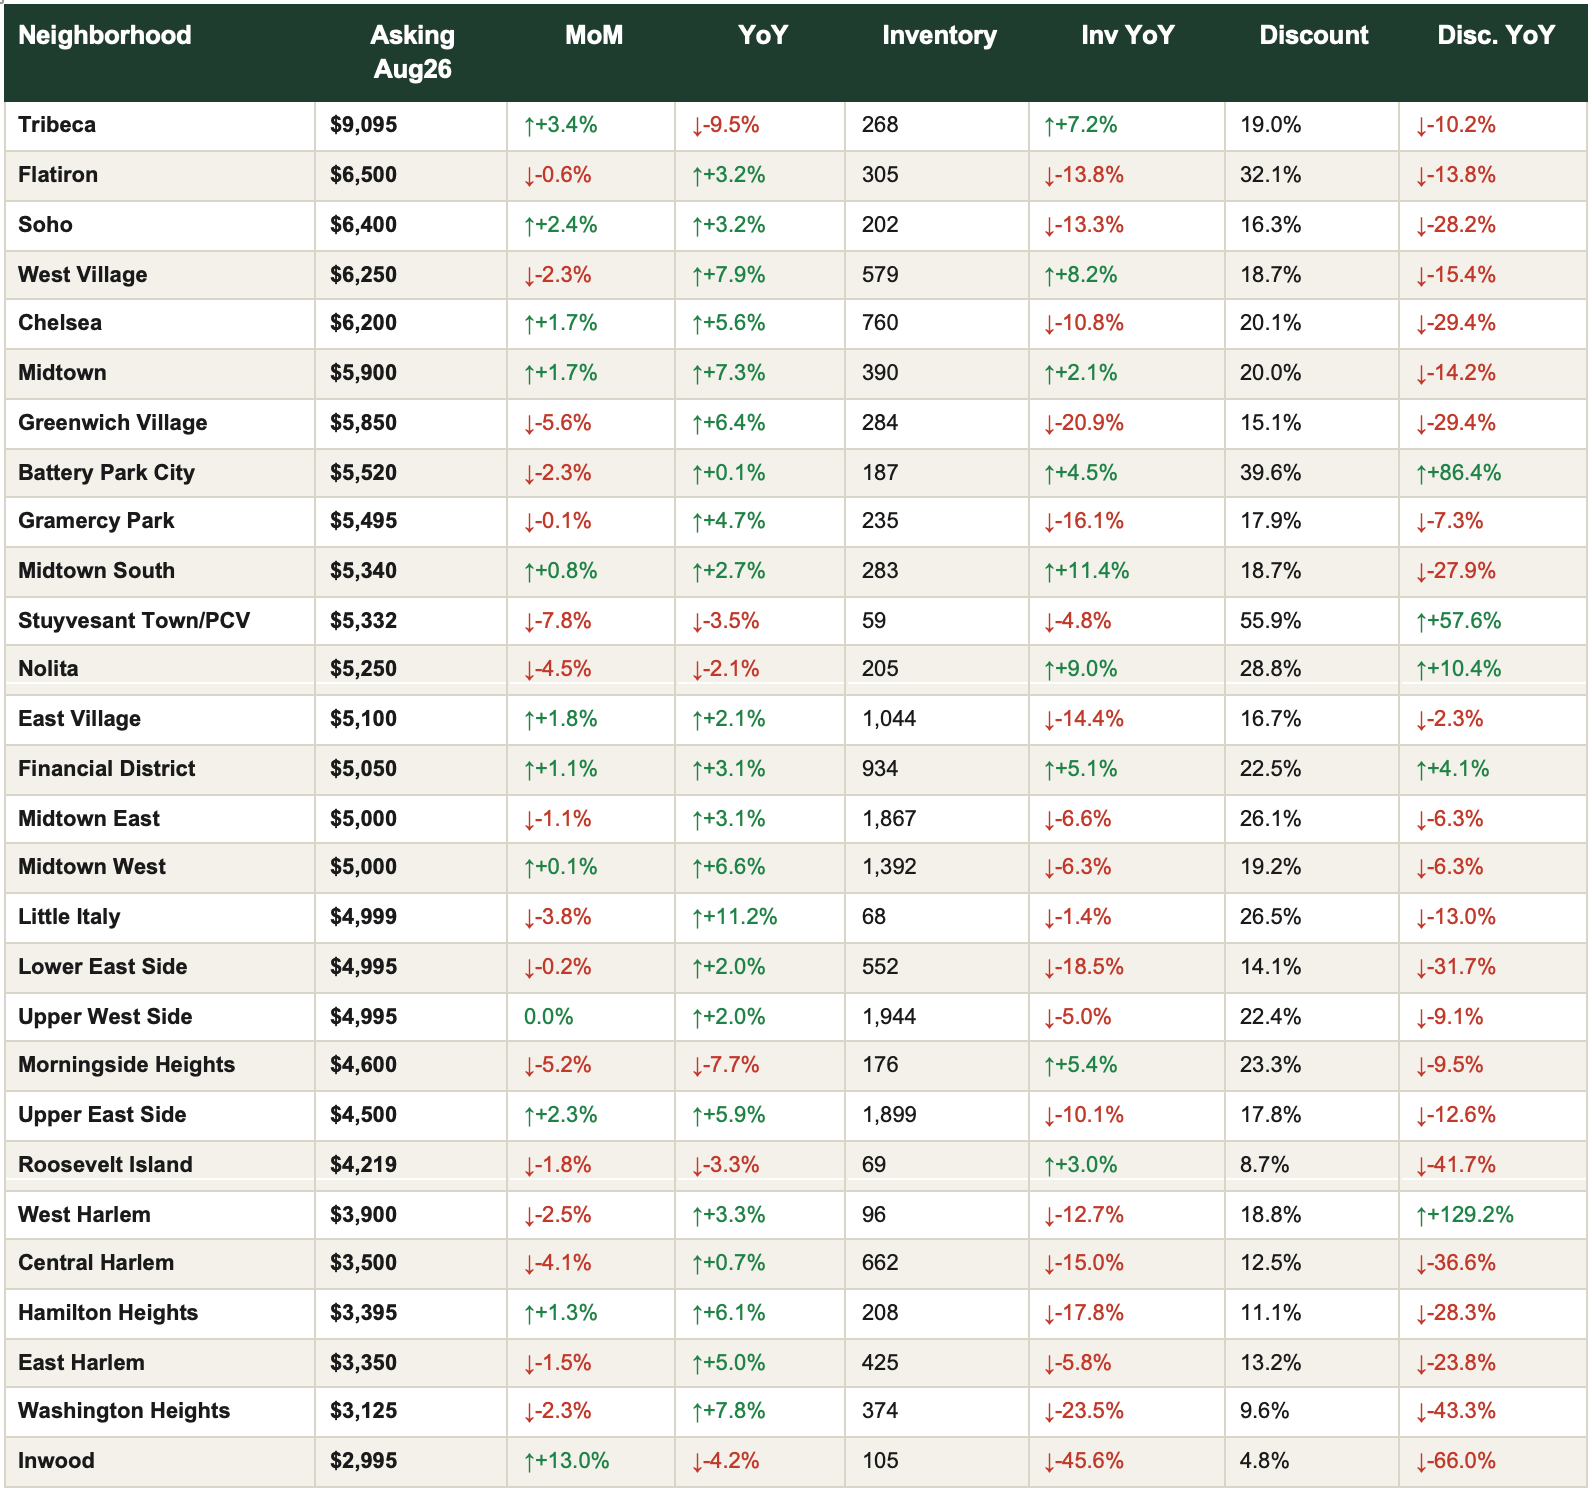
Tribeca leads at $9,095 but is down 9.5% on the year. Little Italy (+11%), the West Village (+8%) and Washington Heights (+8%) lead the gains.
For Renters: Renewing is often the better deal right now. If you move, negotiate where cuts are spreading: Tribeca, Morningside Heights and Inwood.
For Landlords: Rents are near record, but one in five listings is cutting. Price at market on day one.
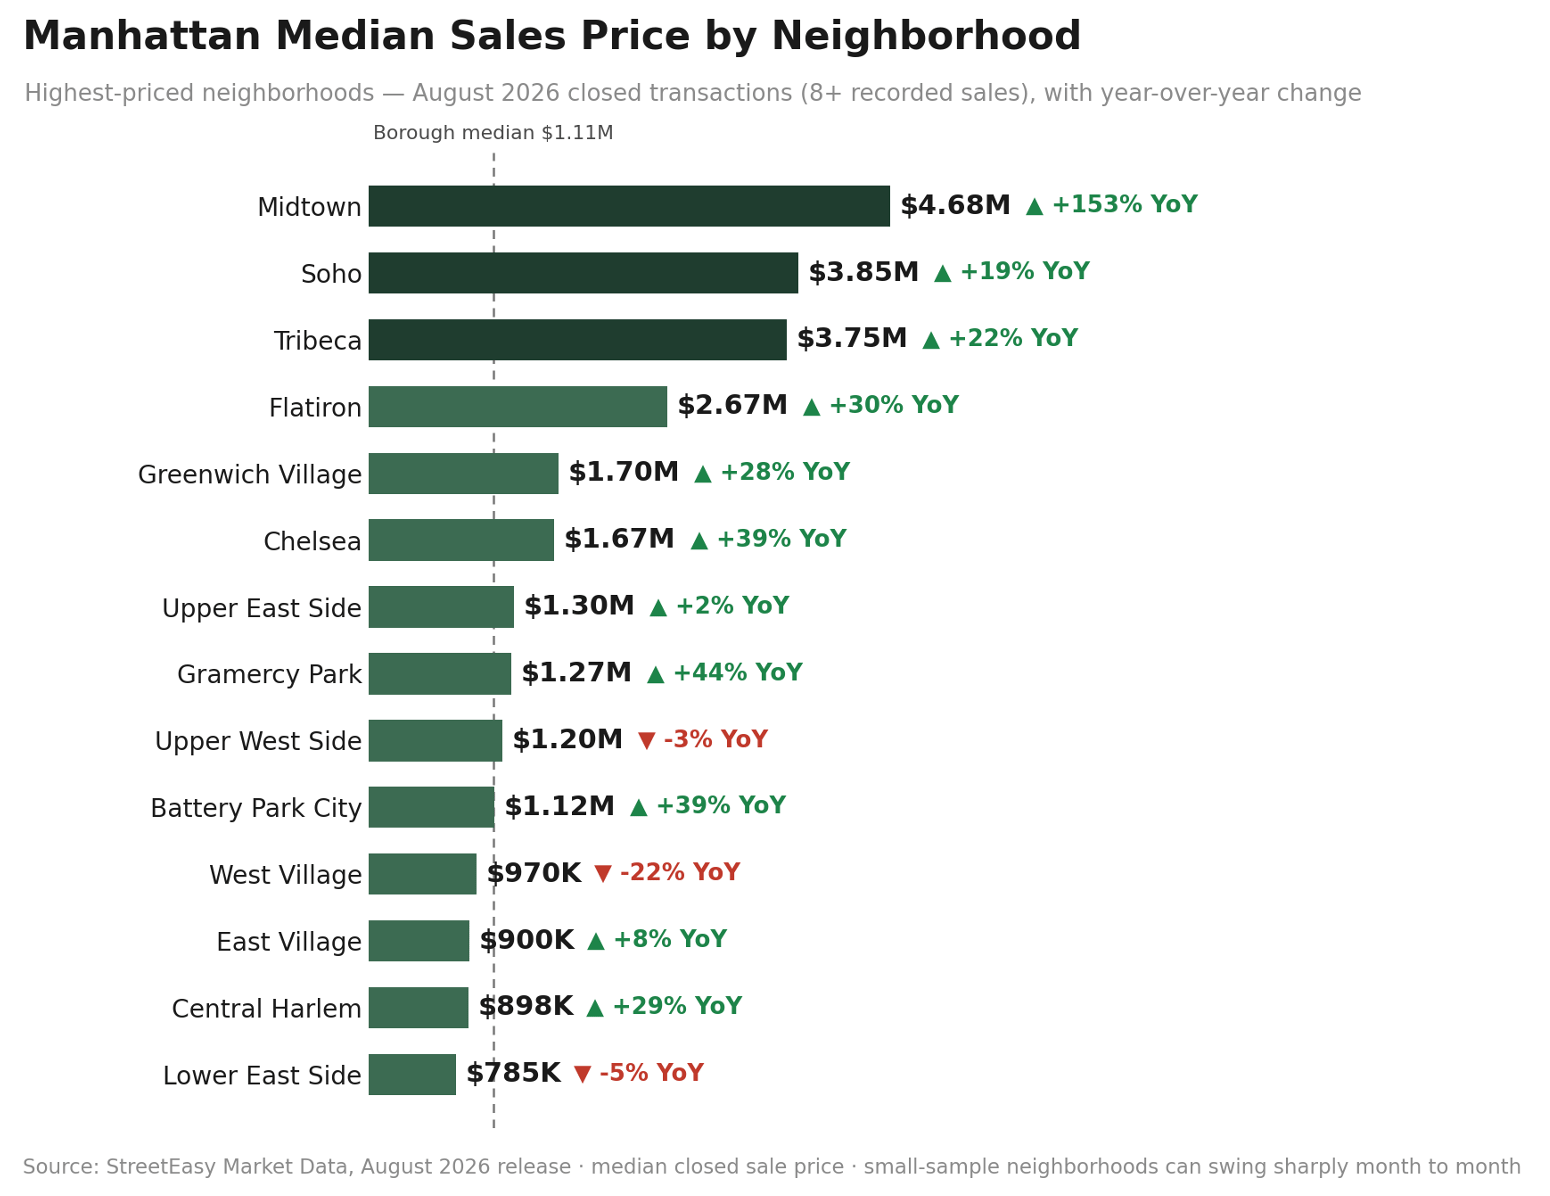
StreetEasy's August closings put the borough median at $1.12M. Among neighborhoods with eight or more recorded sales, Midtown ($4.68M), Soho ($3.85M) and Tribeca ($3.75M) lead; Washington Heights ($539K) anchors the value end.
Mortgage Remarks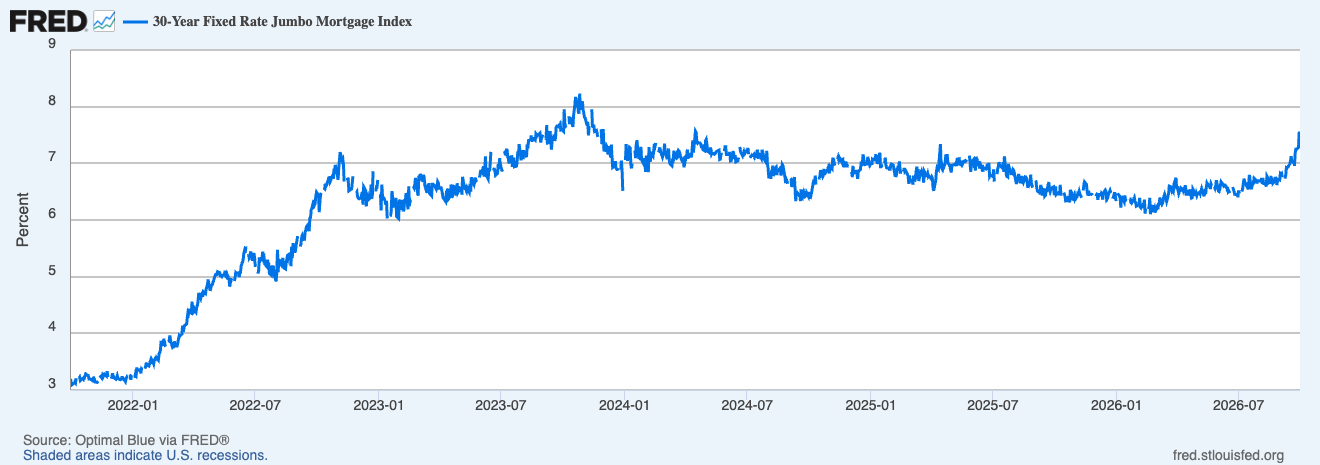 THE FED HIKES, THE 10-YEAR BREAKS 5%
The Fed raised rates on September 16 for the first time since 2023, to a 3.75%–4% range, and signaled one more hike this year. The bond market moved first and further: the 10-year Treasury, the benchmark lenders price jumbo loans against, closed September at 5.29%, its highest level since 2007. Freddie Mac's 30-year average crossed 7% (7.03% on September 24). Our jumbo APR tracker rose to 7.44% on October 1, up from 6.99% a month earlier and the highest reading since we began tracking in December 2023.
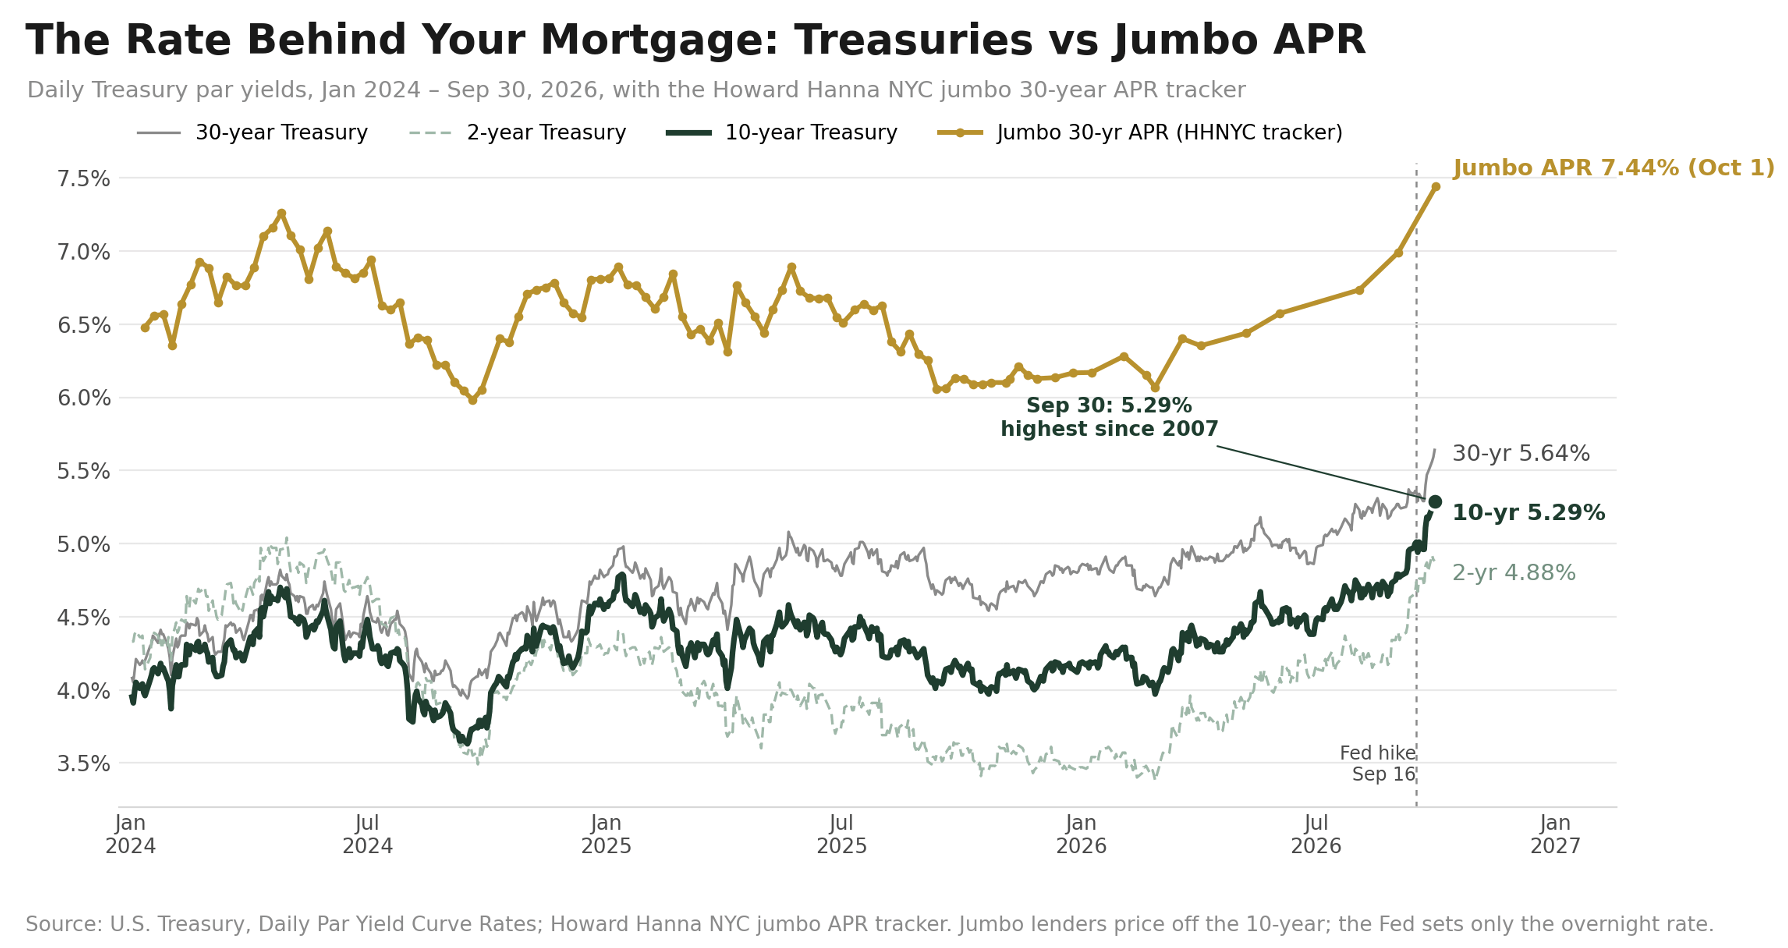
Buyers: Jumbo rates rose almost half a point in a month, about $300 more a month on a $1M loan. Lock a fresh rate before you shop.
Sellers: Rate-sensitive buyers below $1.5M are the first to step back. Cash and equity-heavy buyers carry the market above that.
Consumer Sentiment
CONSUMER CONFIDENCE FALLS AGAIN
The University of Michigan sentiment index fell to 48.1 in September, near its all-time low, as year-ahead inflation expectations rose to 4.6%. Higher is better; the long-run average is about 85.
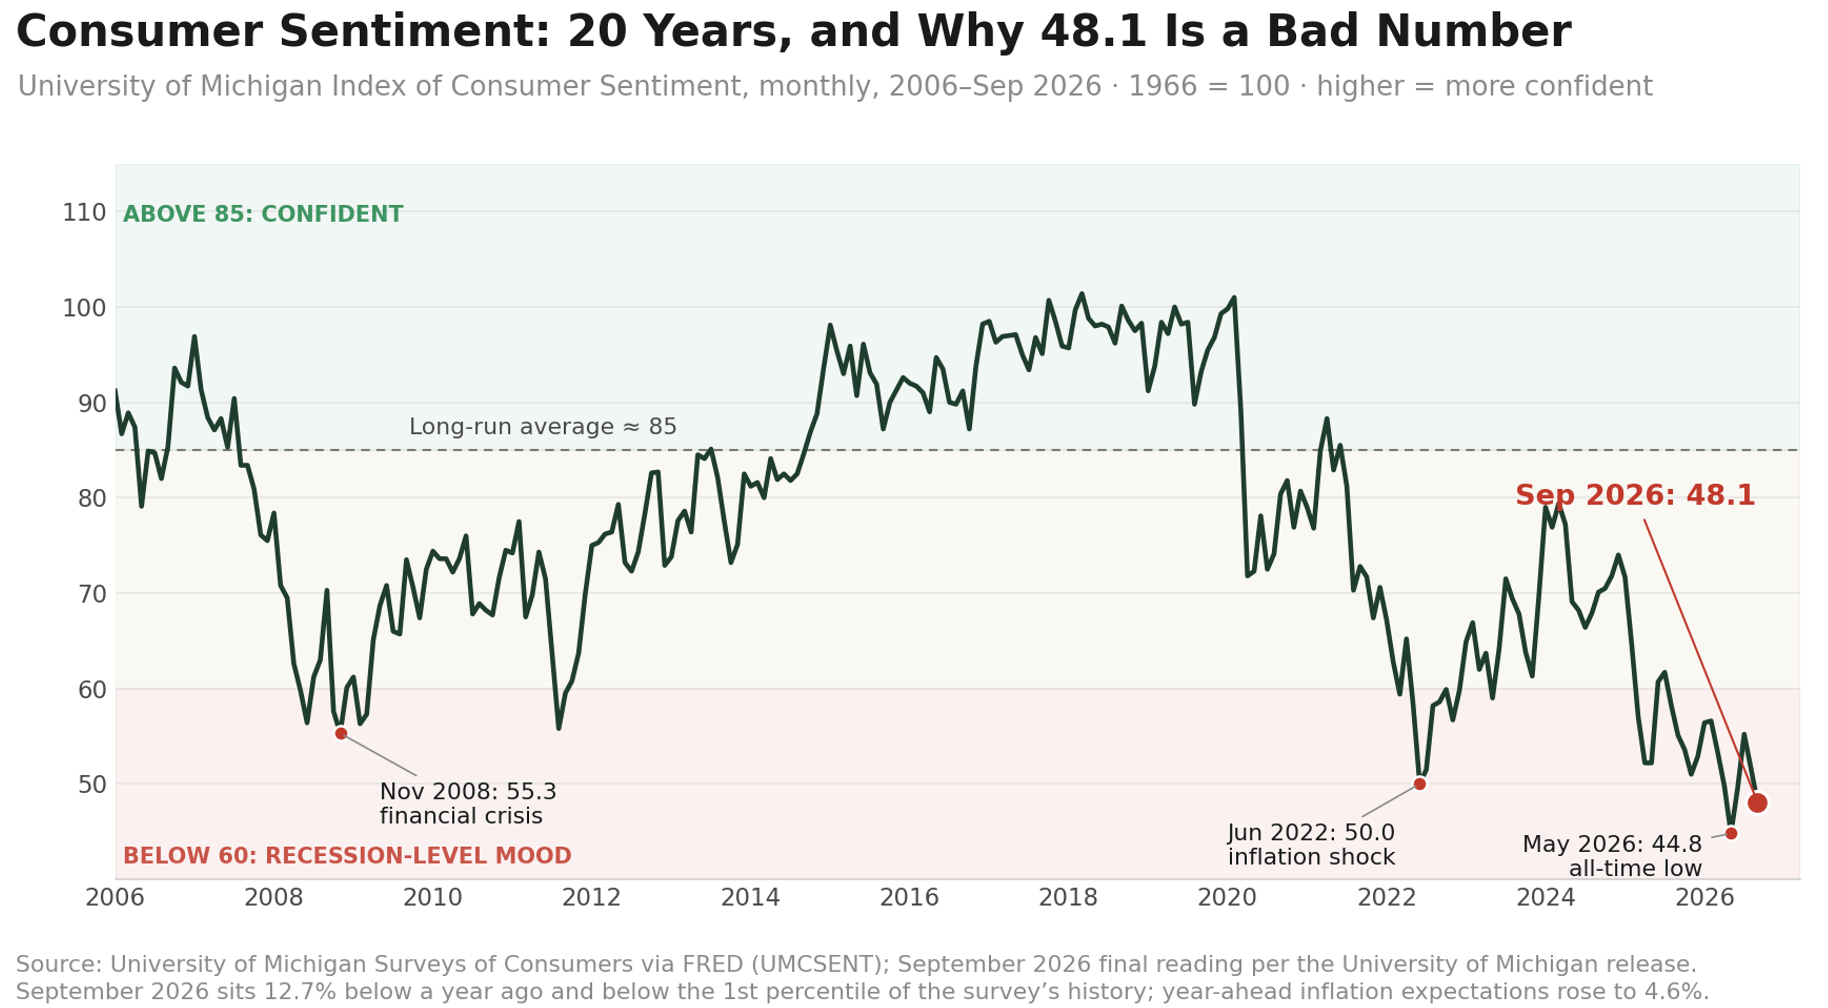
Manhattan buyers are not immune. Weaker confidence plus 5% Treasuries shows up as slower decisions, not lower prices.
Buyers: Low-confidence months mean less competition. If your finances are ready, this is the time to move.
Sellers: Expect cautious buyers. Answer hesitation with comparables and clean disclosure, not with panic cuts.
Investor Insights
Domestic Investors and Yield
Rents up 5% against prices up in the low to mid single digits keep the income case intact, but 5% Treasuries raise the bar: a property now has to out-earn a risk-free 10-year note.
The Investor Yield Map
Morningside Heights (7.2%), Washington Heights and Hamilton Heights (7.1% each) lead Manhattan on gross yield. Soho (2.0%) and Tribeca (2.4%) remain appreciation plays.
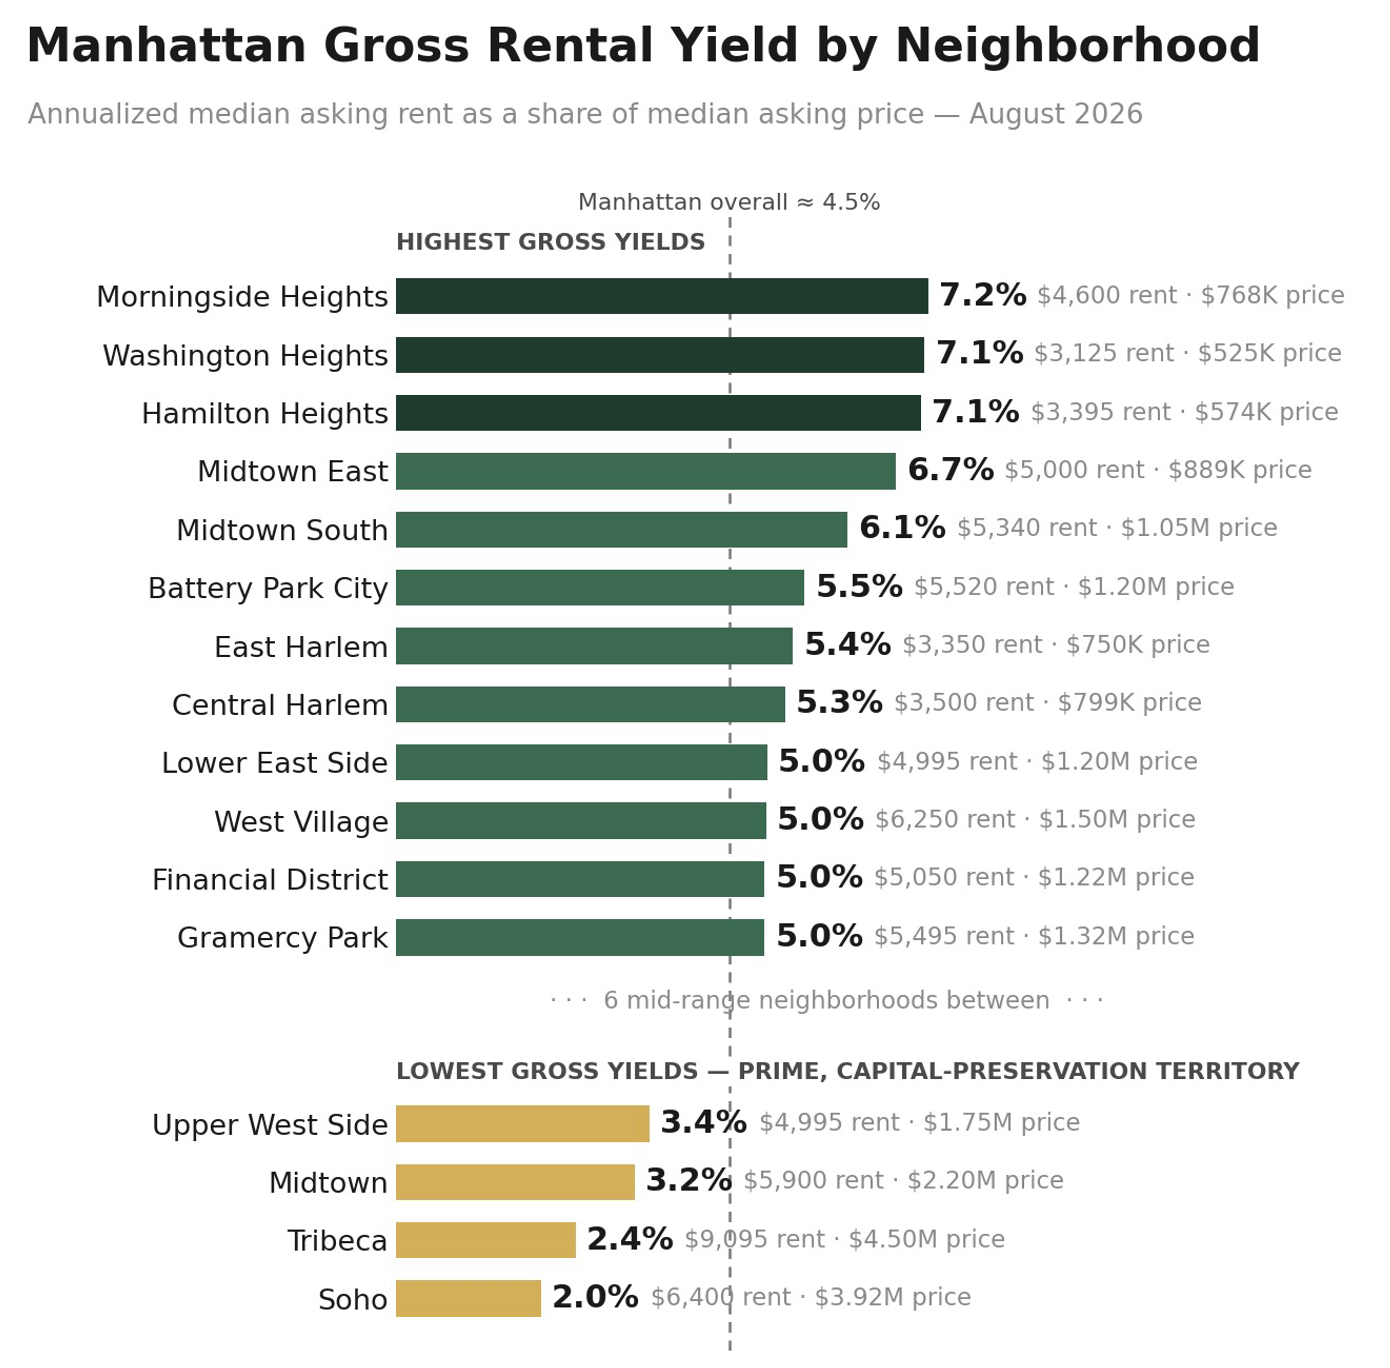
Method: gross yield = annualized StreetEasy median asking rent ÷ median asking price, both August 2026, same source and stage. A screening measure before property taxes, common charges, insurance and vacancy, not a cap rate. Submarkets with fewer than 50 active rentals or 30 active sale listings excluded.
Pied-à-Terre Surcharge: Court Orders a Redo, the Tax Stays
On September 29, a Staten Island judge ruled that the city's rollout of the non-primary residence surcharge was flawed and ordered it to cancel the notices and start over with individual determinations. The tax itself was not struck down, and the city appealed immediately, which pauses the order while the appeal is heard.
In practice, little changes for owners yet. The surcharge still applies to non-primary condos and co-ops with a Department of Finance value of $1 million or more. The exemption deadline is October 6, and any surcharge would first appear on the January 1, 2027 tax bill.
For Owners: If you received a notice, keep responding as instructed while the appeal runs. Do not assume the ruling cancels your obligation.
For Buyers and Investors: Underwrite the surcharge on any non-primary purchase. A unit with a full-time tenant is exempt; an empty pied-à-terre is not.
This is market information, not tax or legal advice. Howard Hanna NYC can tell you what your apartment would rent for and sell for today; your advisors should drive the exemption decision.
The Manhattan PPSF Story
Manhattan's median PPSF has held a tight band for a decade. September's $1,443 sits near the top of it: scarcity, not speculation, is holding prices.
References
1. Sales and pricing data (supply, demand, PPSF, listing discount, median sale price, days on market, price cuts, Market Pulse) and Leverage Index inputs: UrbanDigs, September 2026 actuals.
2. Bedroom-level median sale price: UrbanDigs Charts Room, 5-year monthly series, by closed date, September 2026.
3. Rental data (asking rent, inventory, discount share, neighborhood table) and gross rental yield inputs: StreetEasy Market Data, August 2026 release.
4. Sales by neighborhood: StreetEasy Market Data, August 2026 release (median closed sale price, recorded sales volume).
5. Closed-lease rental data: The Real Deal Rental Report by Jonathan Miller, August 2026.
6. Mortgage rates: Howard Hanna NYC jumbo APR tracker (Bank of America, Chase, Wells Fargo), October 1, 2026; Freddie Mac Primary Mortgage Market Survey, September 24, 2026; Optimal Blue 30-Year Fixed Rate Jumbo Mortgage Index via FRED.
7. Federal Reserve policy: FOMC statement, September 16, 2026. https://www.federalreserve.gov/newsevents/pressreleases/monetary20260916a.htm
8. Treasury yields: U.S. Department of the Treasury, Daily Treasury Par Yield Curve Rates, through September 30, 2026.
9. Gross rental yield: annualized StreetEasy median asking rent ÷ median asking price, by neighborhood, August 2026 release. Screening measure; thin submarkets excluded.
10. Leverage Index: Howard Hanna NYC Leverage Index 2026; inputs courtesy of UrbanDigs. Demand, discount and PPSF charts: HHNYC Graphs workbook.
11. Consumer sentiment: University of Michigan Surveys of Consumers, September 2026 final; history via FRED (UMCSENT).
12. Pied-à-terre surcharge: New York State Supreme Court, Richmond County, decision of September 29, 2026; NYC Department of Finance, Non-primary residence surcharge, https://www.nyc.gov/site/finance/property/non-primary-residence-surcharge.page; Forbes, September 29, 2026; CBS New York, September 29, 2026. Not tax or legal advice.
Questions About This Month’s Market?
If you would like to chat about the most recent market activity,
feel free to contact us at [email protected] or connect with one of our Advisors.
About this report: The Manhattan Real Estate Market Update is compiled monthly by Rihards Gederts, Howard Hanna NYC Research.
Howard Hanna NYC brings the nation’s largest independent and family-owned brokerage to New York City, uniting the strength of a national network with the insight and sophistication of a local firm. Formed through joining forces with Elegran Real Estate, Howard Hanna NYC delivers a seamless, full-service experience backed by more than 15,000 agents across 500 offices in 14 states. The firm’s forward-thinking, agent-first culture continues to shape the future of real estate across Manhattan and the Tri-State area. Learn more at www.howardhannanyc.com.