The spring market is in full bloom in Manhattan and Brooklyn. In the first full week of April, overall supply increased in the boroughs as both experienced the second most new-to-market supply and contracts signed in a week thus far in 2022 [the prior week was the highest for both metrics]. Both sellers and buyers are incredibly active this season, as each looks to take advantage of current market conditions, which is creating what could be peak liquidity in the market. The Market Pulse has been remaining fairly stable over the last month and this week Manhattan’s Market Pulse decreased from 0.76 to 0.74, while Brooklyn’s decreased from 1.23 to 1.22. Both boroughs remain in the seller’s market territory.
Manhattan Supply
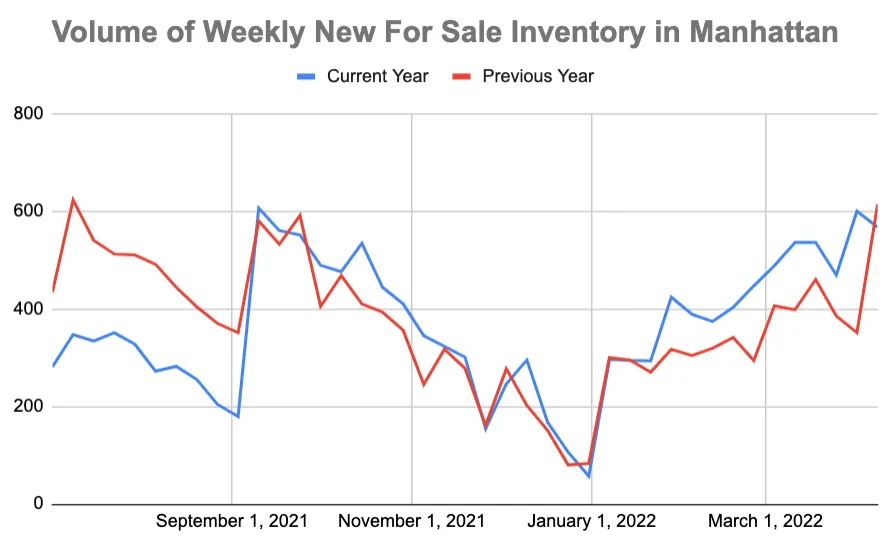
Increased by 3.5% this week to 5,895 units, continuing the trend of increasing supply which began in February. This week 567 new listings came to market, 6% fewer than last week and 8% fewer than the same week last year. Despite the drop, the amount of new-to-market supply this week is well above the recent average and in line with what is expected during the peak of the spring market.
Brooklyn Supply
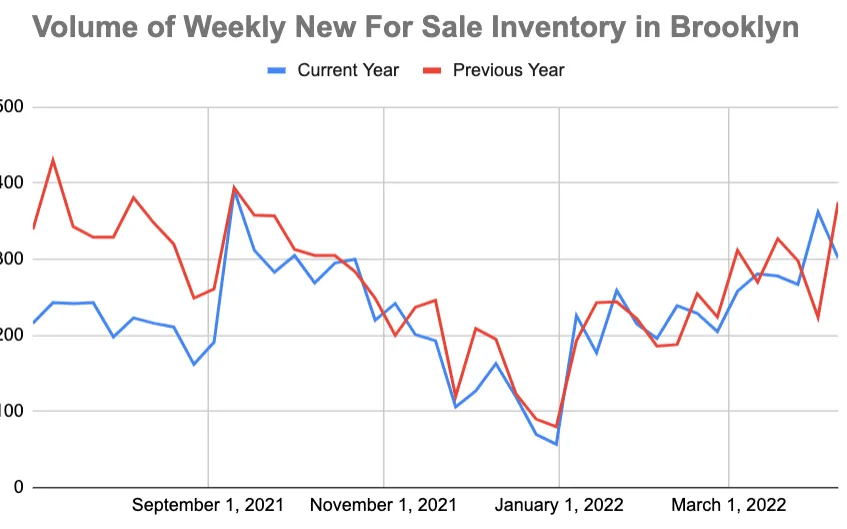
Increased 2% to 2,620 units for sale this week, continuing the trend of increasing supply which began in early March. This week 302 new listings came to market, a 17% decrease from last week and 19% less than the same week last year. Despite the drop compared to last week, this week saw the second most new-to-market supply this year.
Manhattan Pending Sales
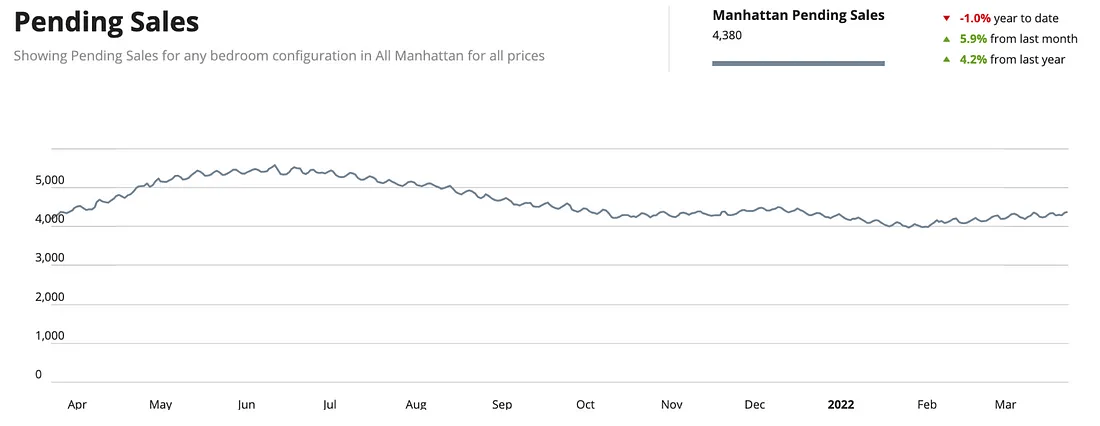
Increased by 1.5% to 4,380.
Brooklyn Pending Sales
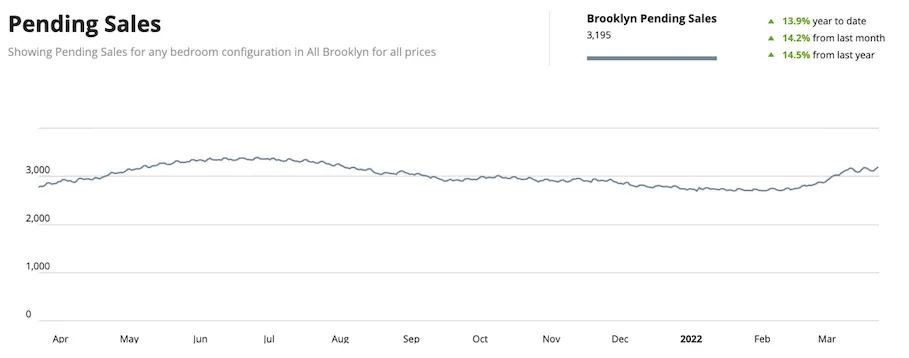
Increased by 1.5% to 3,195.
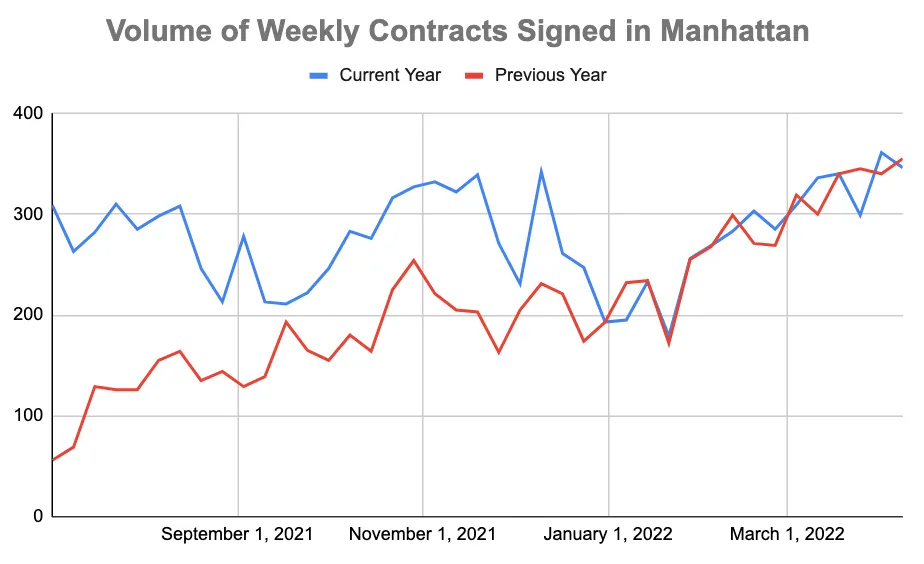
Manhattan Contracts Signed
346 contracts were signed this week, the second-highest week this year so far. This represents a 4% decrease from last week and a 3% decrease from the same week last year.
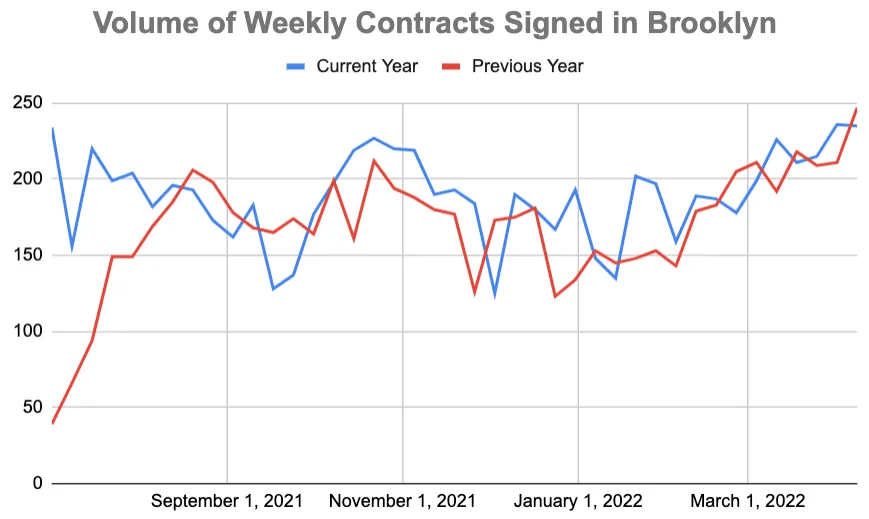
Brooklyn Contracts Signed
235 contracts were signed this week, the second-highest week this year so far. This week 1 fewer contract was signed compared to last week, and 5% fewer compared to the same week last year.
New Development Insights
As reported by Marketproof, this week, 95 new development contracts were reported across 58 buildings. The following were the top-selling new developments of the week:
- The Solaire in Battery Park City
- Nx in Williamsburg
- Forena in Flatiron
- 11 Hoyt St in Downtown Brooklyn
- 623 Avenue H in Midwood