Brooklyn Market Pulse ¹ September 2026
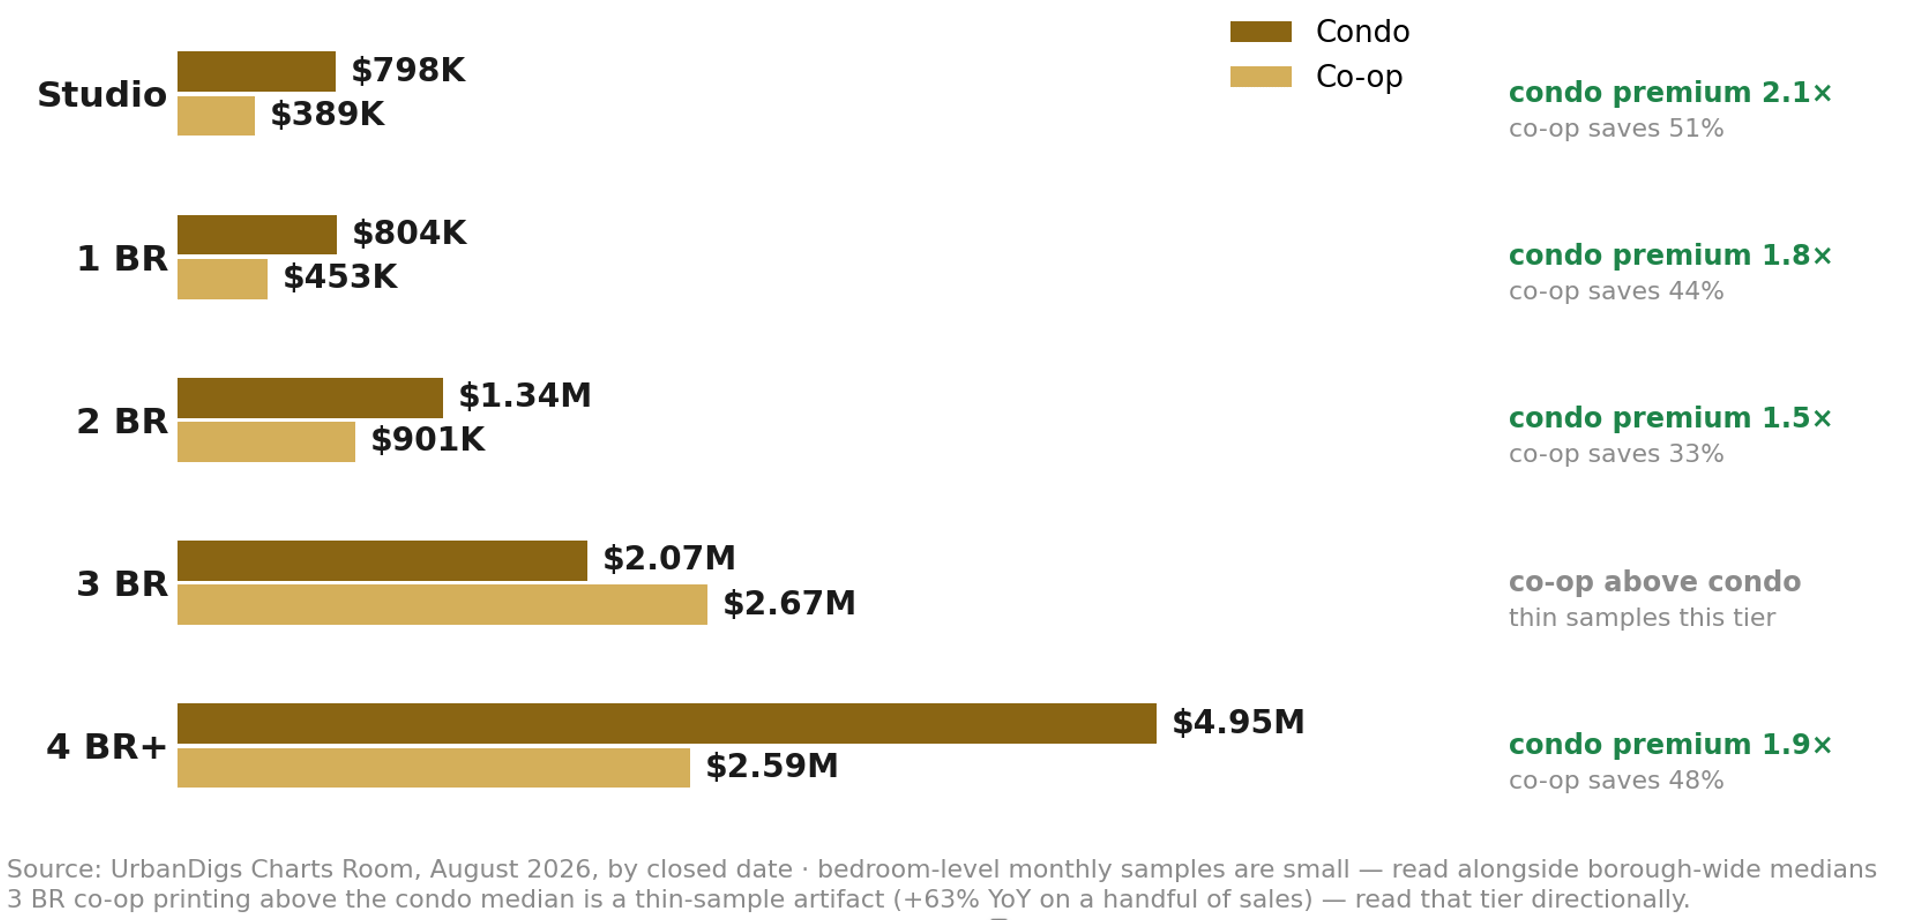
MEDIAN SALE PRICE BY BEDROOM, ALL BROOKLYN (AUGUST, BY CLOSED DATE)
Prices Print a 10% Annual Gain as Demand Finally Cools
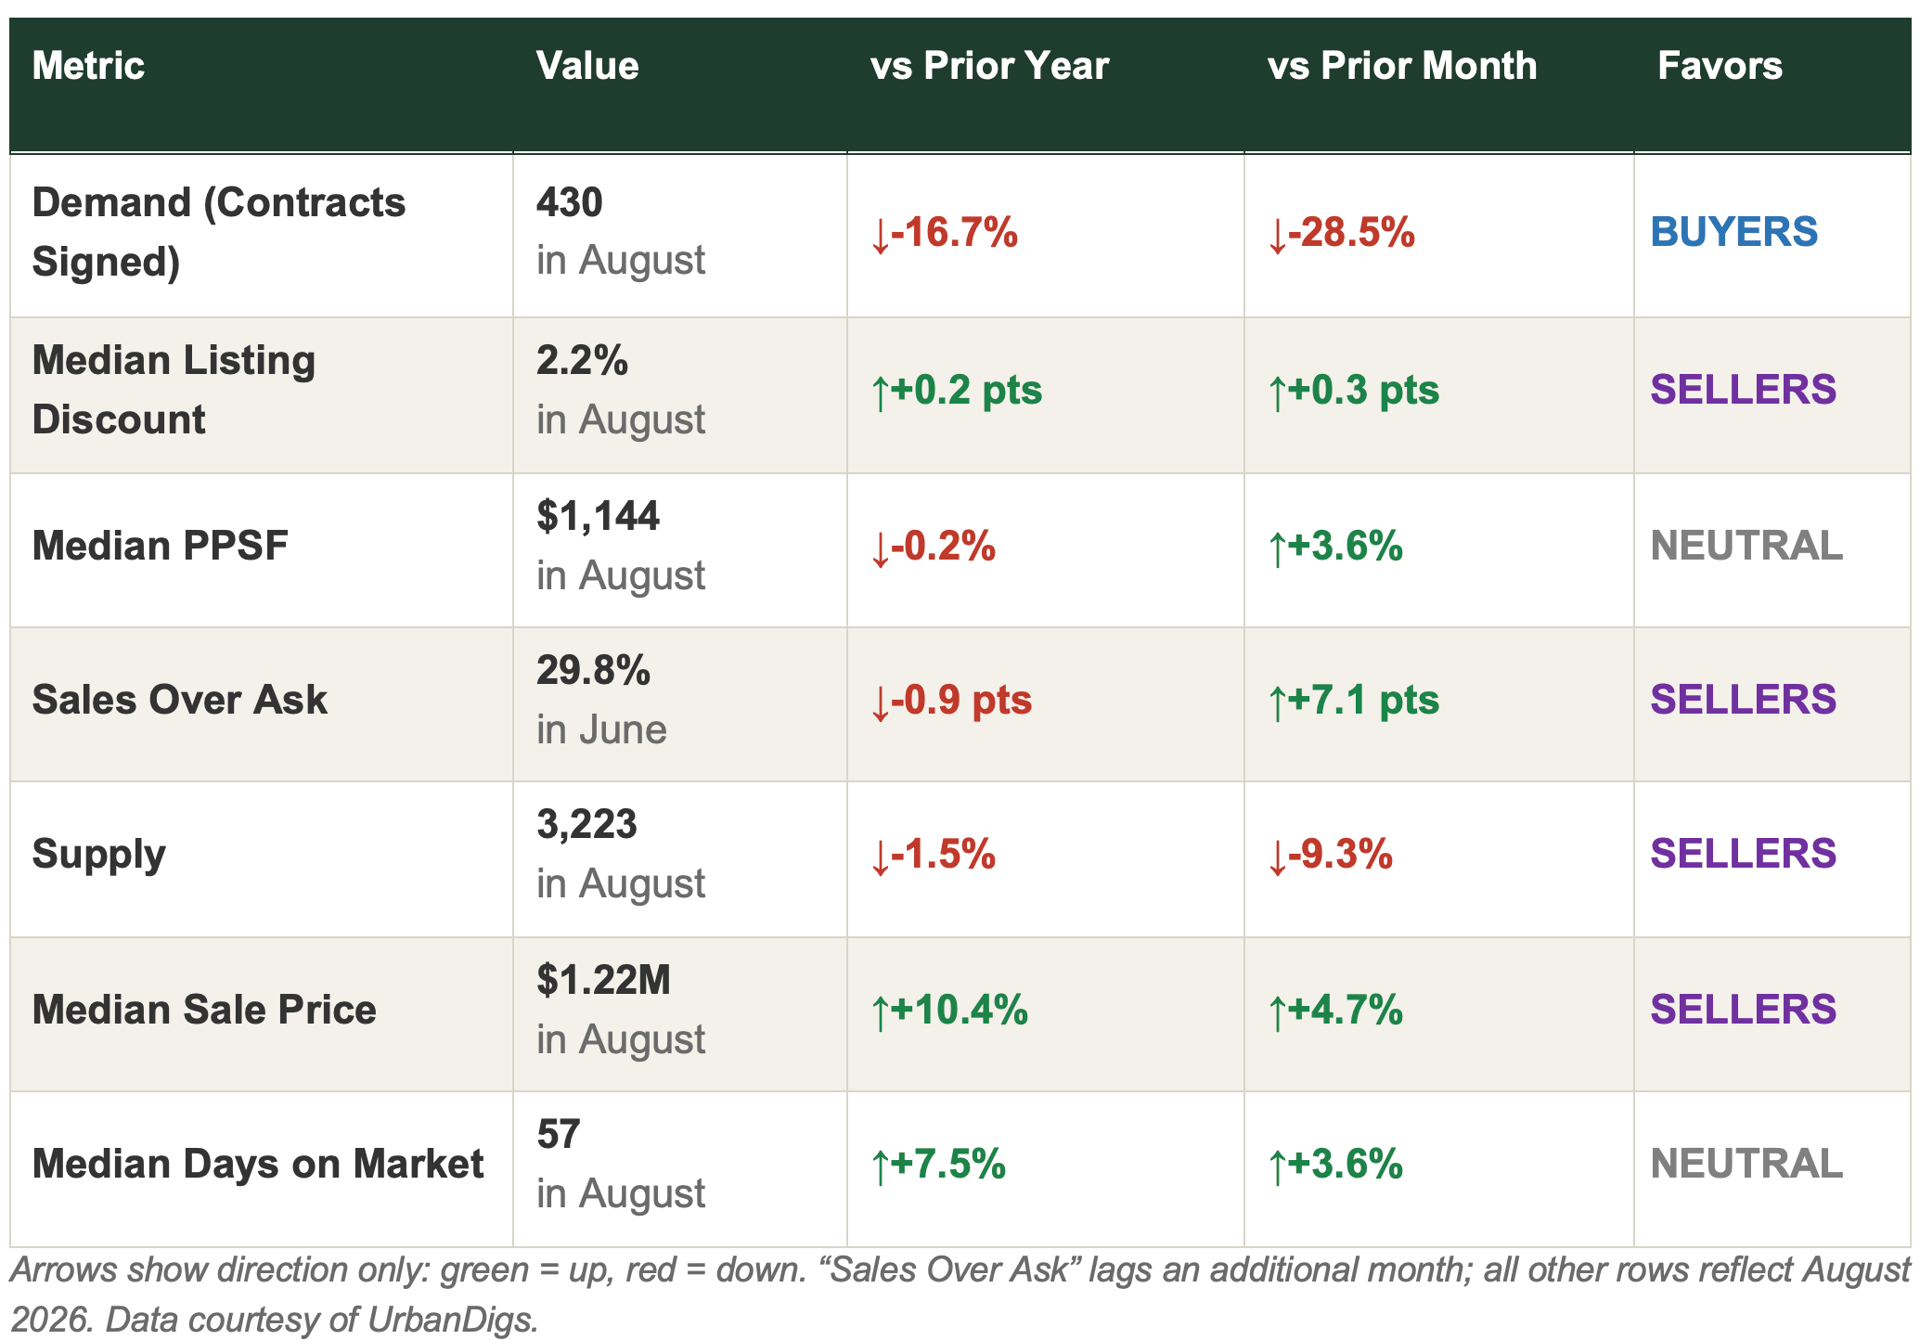
August broke Brooklyn's streak. Contracts fell to 430, down 28.5% from July and 16.7% below last August, the sharpest demand cooldown of 2026 after a summer of outperformance. Pricing went the other way: the median climbed 4.7% on the month to $1.22M, up 10.4% year over year, the strongest print in the city, and the 2.2% discount stayed the tightest in NYC. Supply tightened too, down 9.3% to 3,223, so scarcity met the slowdown halfway.
Bottom line: closed prices and a 2.2% discount still say sellers; a demand pulse below seasonal averages says buyers are regaining time. Pricing decides which market a listing experiences.
Market Snapshot: Five Numbers That Matter
• 430 contracts signed in August, down 28.5% from July and 16.7% year over year, the sharpest cooldown of 2026.
• 3,223 active listings, down 9.3% from July and 1.5% below last year. The spring inventory opening has closed.
• $1,144 median PPSF, up 3.6% from July and flat on the year against a strong August 2025 base.
• 2.2% median listing discount, the tightest in either borough this year; 29.8% of June sales closed above ask.
• $1.22M median sale price, up 4.7% from July and 10.4% year over year, the strongest annual gain in the city.
• Demand finally cooled: the Market Pulse sits at -2.7, below seasonal averages for the first time in months. Pending sales of 1,984 still run 3.6% ahead.
• Supply cooled with it: a net 345 homes left the market and new listings fell 30%. The slowdown is two-sided.
• Months of inventory fell to 3.6; days on market at 57 sit 7.5% above last year. Fewer buyers, but also less to buy.
• Recorded closings (448, -57% MoM) reflect recording lag on the newest month, not a halt in activity.
Brooklyn enters the fall two-sided. Sellers hold the price ledger: the tightest discount in the city and a double-digit annual gain. Buyers hold the momentum ledger: a below-seasonal pulse and the sharpest contract decline of 2026. The September listing wave and the post-Labor Day demand return decide which side compounds.
For Sellers: +10.4% and a 2.2% discount are your headline, but the pulse turned below seasonal. The premium belongs to turnkey, accurately priced product. Price ahead of the market, not behind it.
For Buyers: The first real opening in months: contracts down 28.5%, fewer rival bidders, a 9.5% median discount on listings that sat 120+ days. Entry-level condos are the soft spot: 1BRs printed $804K, down 19.4% year over year.
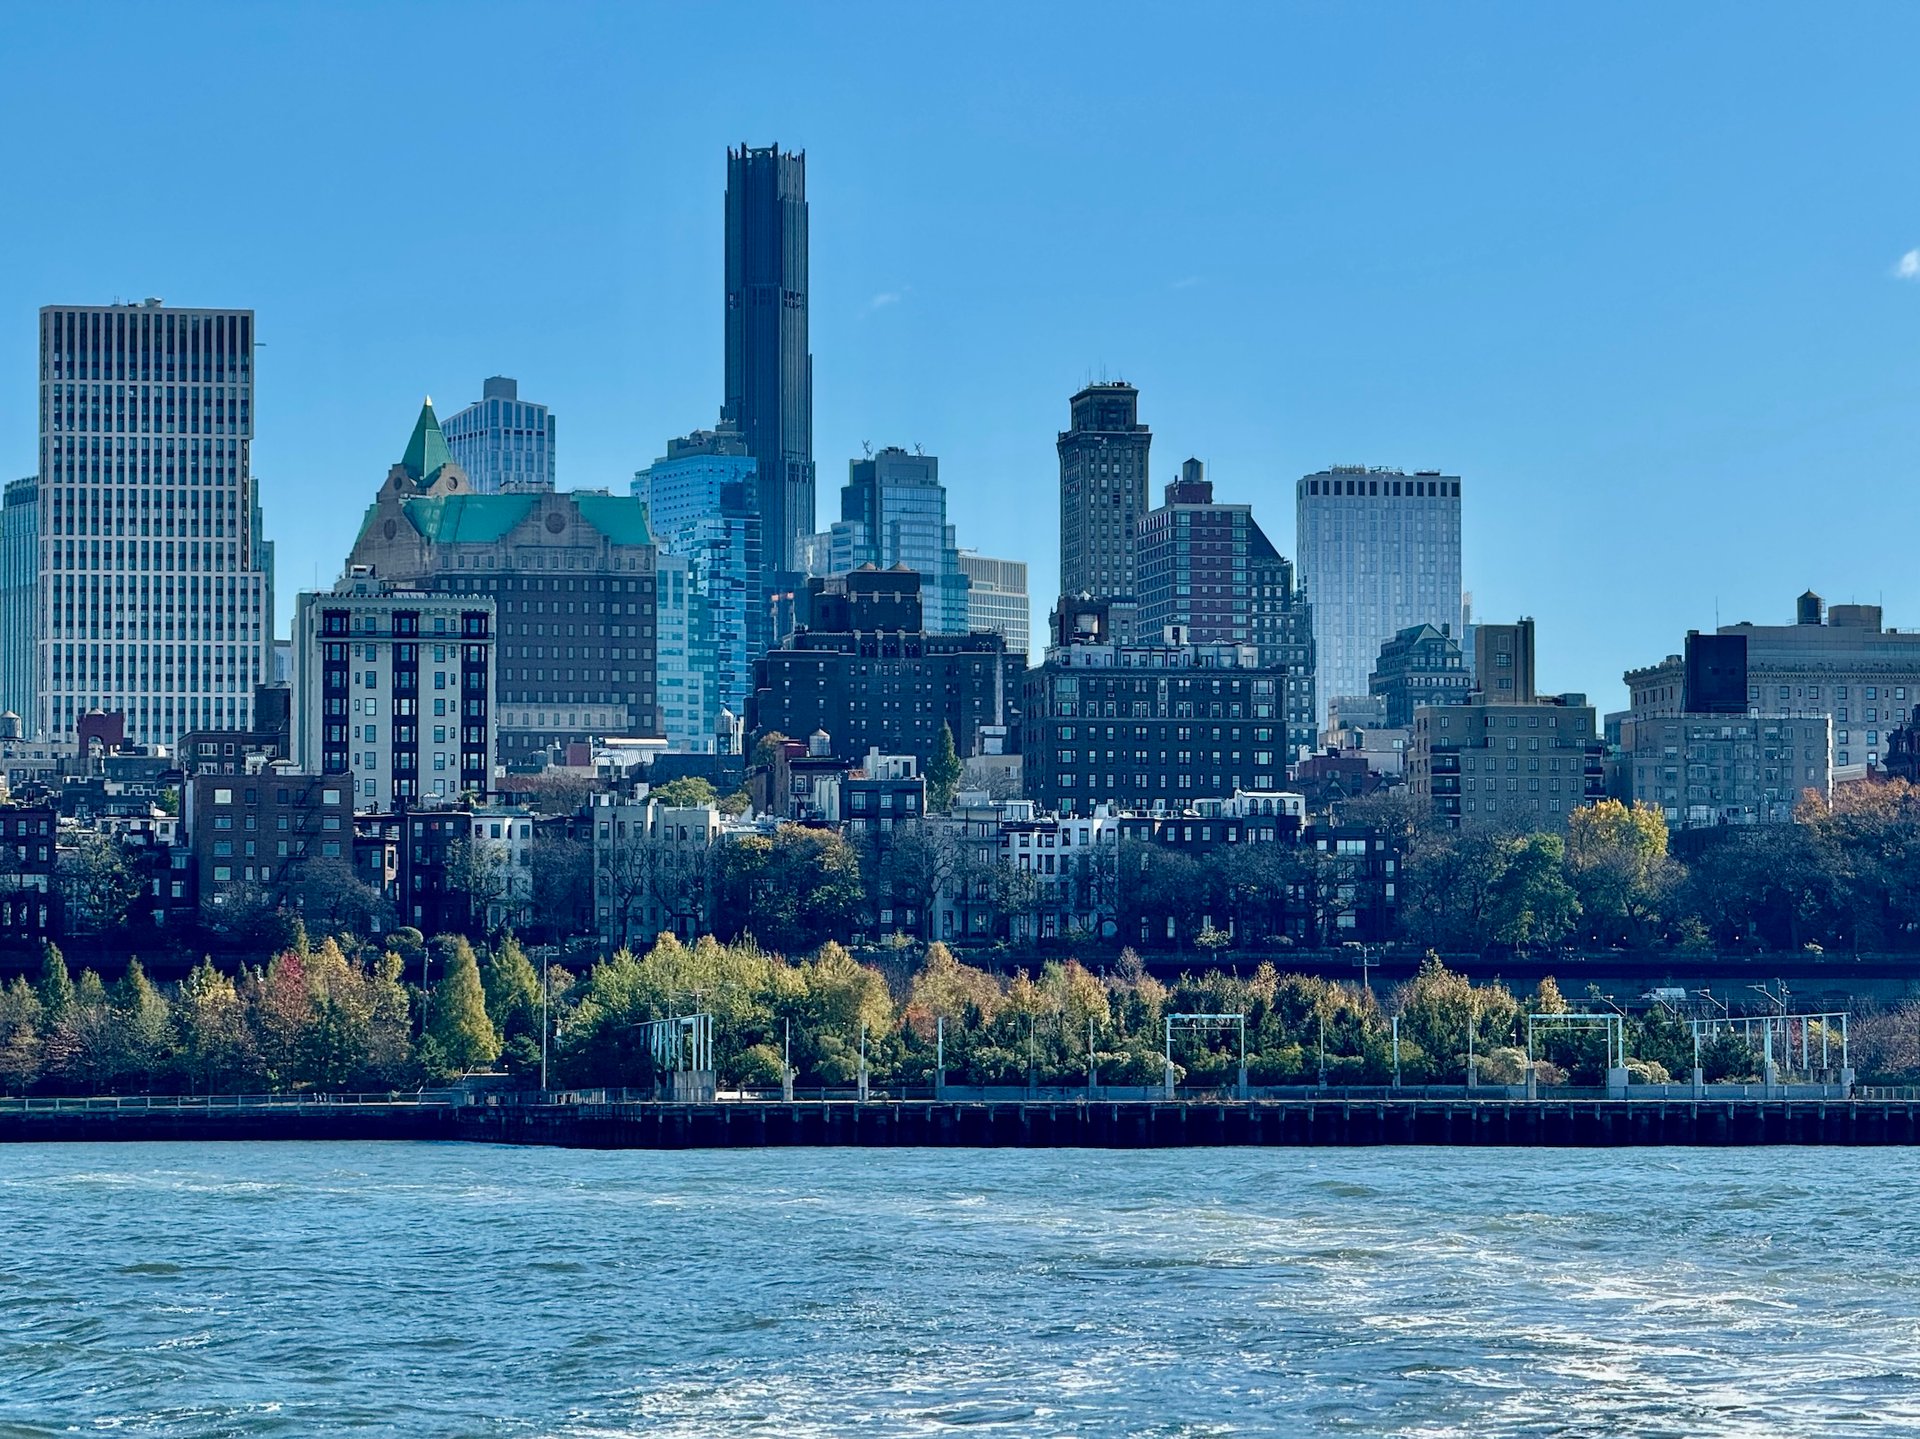
Photo by Rihards Gederts | Howard Hanna NYC
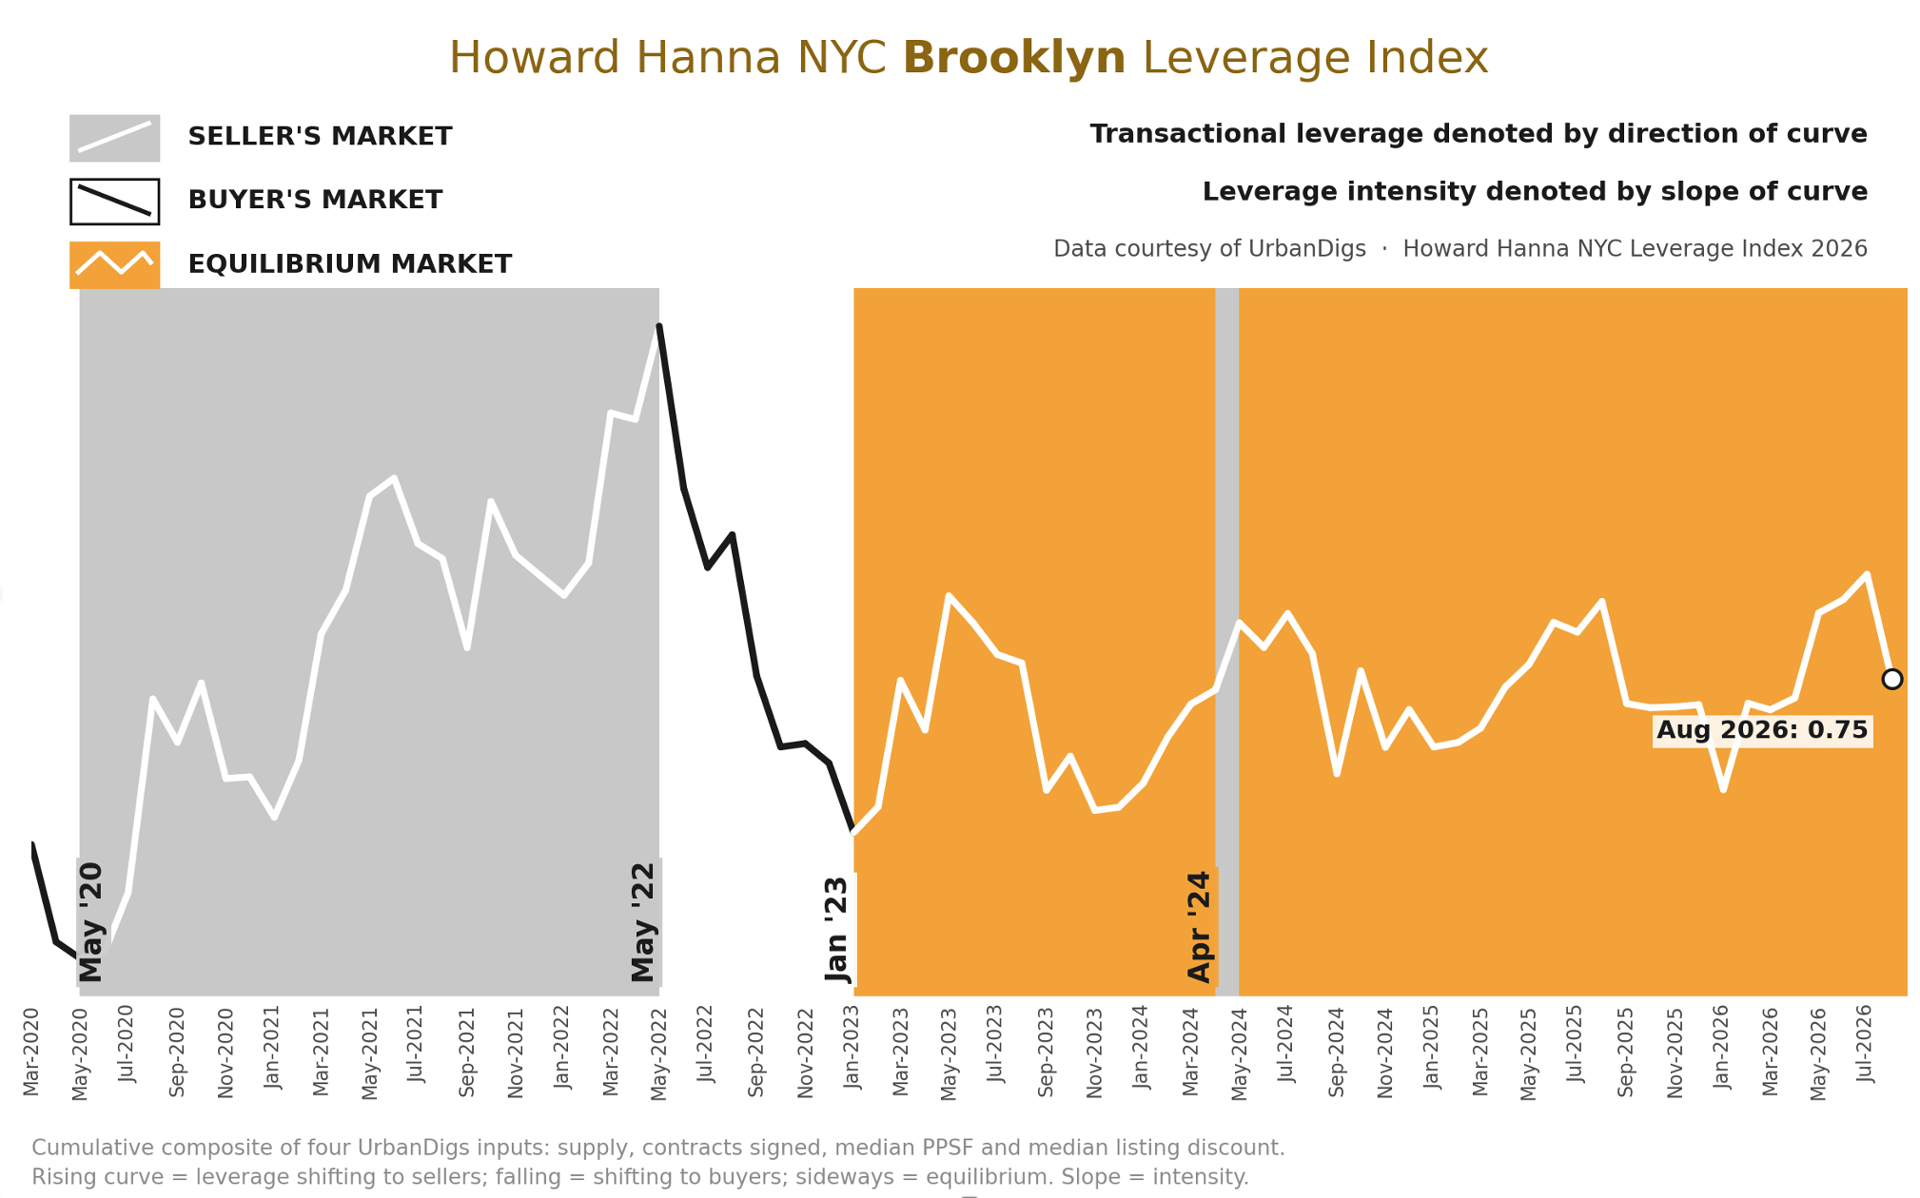
Howard Hanna NYC Brooklyn Leverage Index
The Howard Hanna NYC Brooklyn Leverage Index blends four signals, supply, demand, median PPSF and listing discount, into one reading of who holds the leverage. Tightening supply, rising demand, firming PPSF and shrinking discounts point to sellers; the reverse points to buyers.
The index fell to 0.75 in August from 1.23 in July, its 2026 high. The 0.47-point drop is the third-largest one-month decline since the equilibrium era began in January 2023, and the only one of the three outside September's seasonal reset.
Almost all of it is demand: the contracts input gave back most of its summer surge as signings fell 28.5%. Supply firmed as listings tightened, per-foot pricing edged up, and the 2.2% discount kept the strongest seller-side reading in the city.
The result: back near spring levels, still inside the equilibrium band and three times where 2026 began (0.25), but no longer stretched. Sellers hold price, buyers regain time. Source: Howard Hanna NYC Leverage Index 2026, data courtesy of UrbanDigs.
Brooklyn Supply
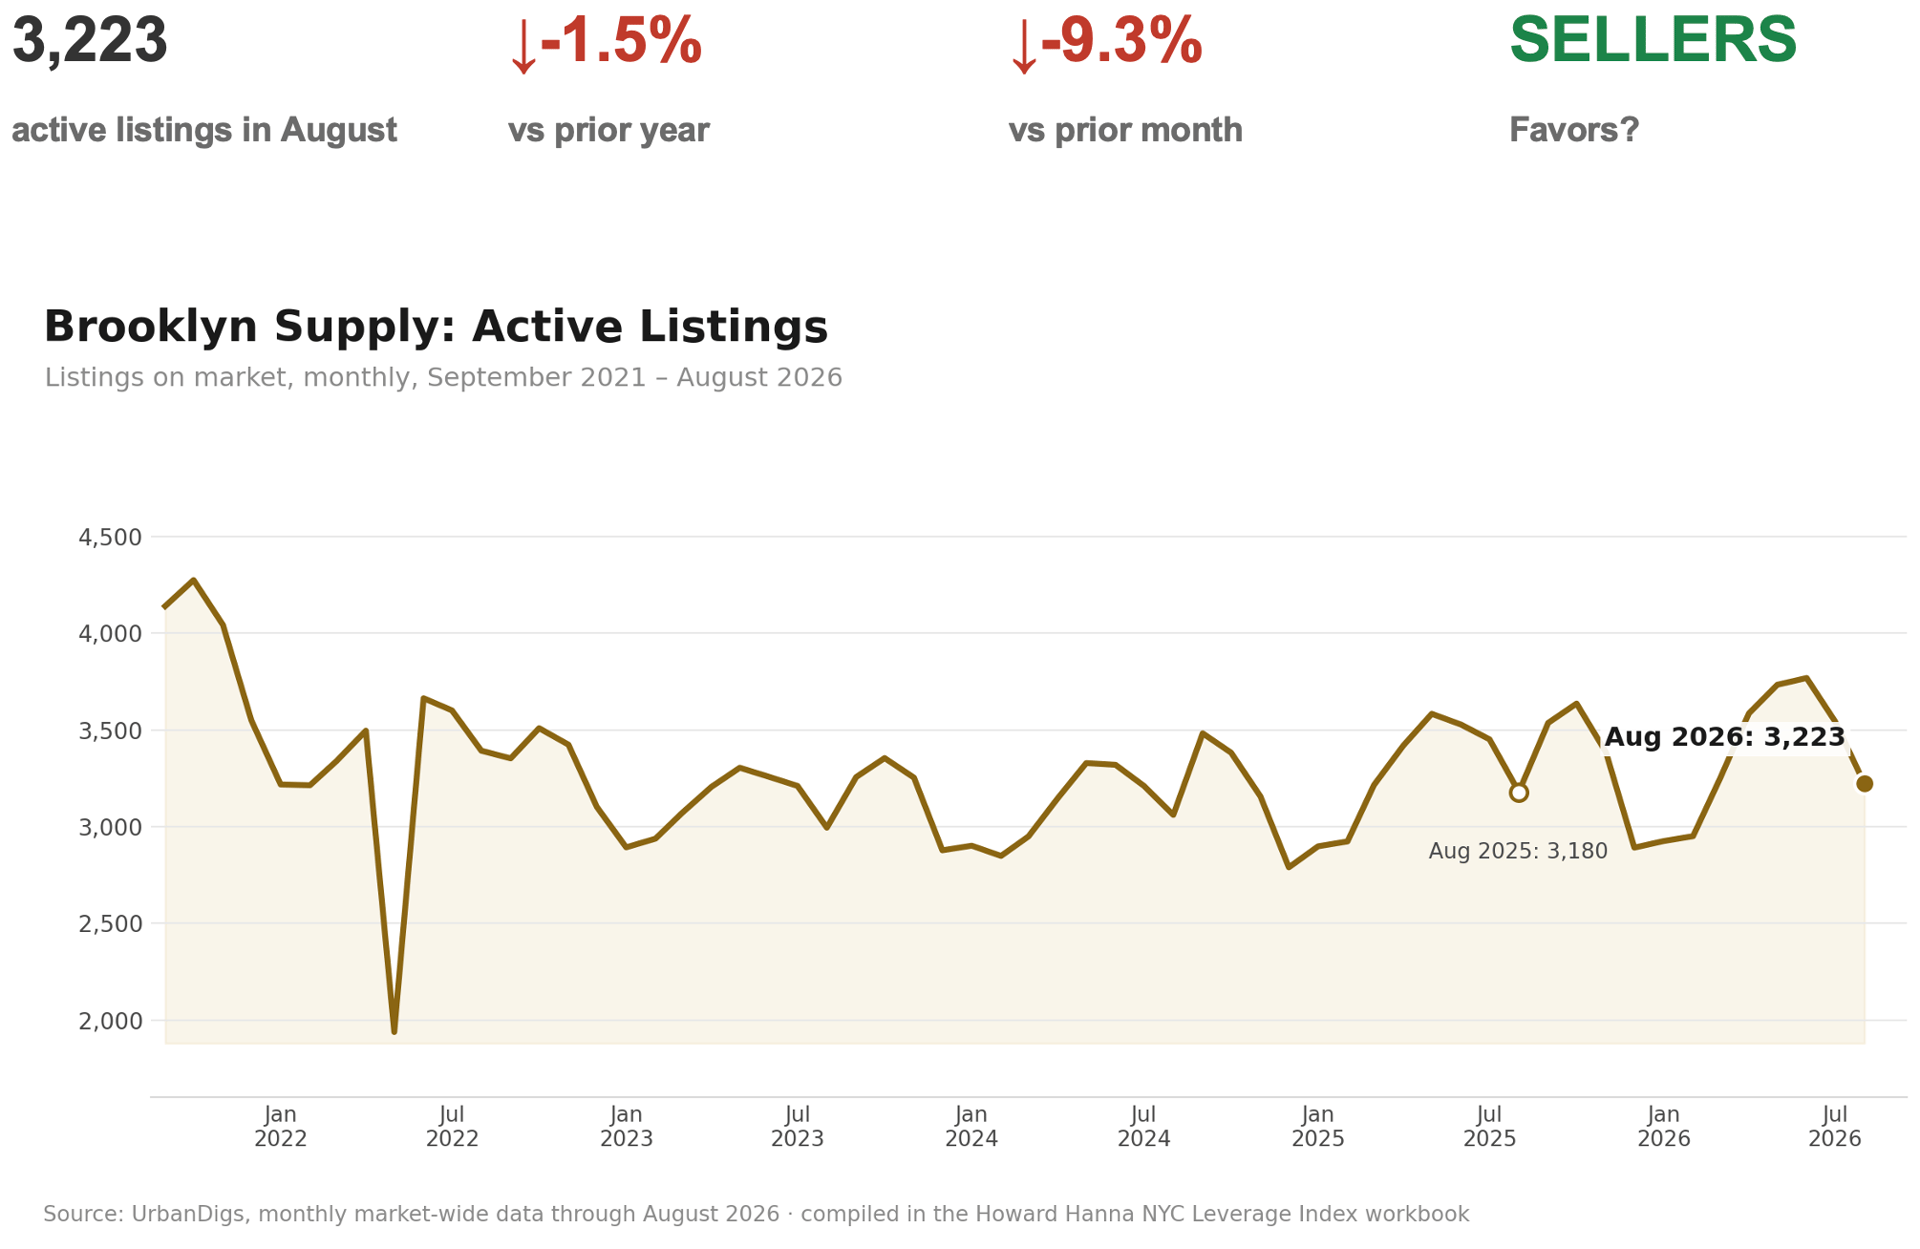
SUPPLY TIGHTENS AS THE COOLDOWN GOES TWO-SIDED
Active listings fell 9.3% from July to 3,223, 1.5% below last August. New listings dropped 30% to 540 and the borough lost a net 345 homes. The spring inventory opening, briefly +4.2% in June, has closed.
Buyers: The spring selection advantage is gone. Leverage lives in listings that sat through the summer, not in fresh supply.
Sellers: Fewer rival listings cushion the demand cooldown. A well-priced August listing faced the least competition of the year.
Outlook: If the September wave lands light, Brooklyn heads into fall with supply below last year for the first time in 2026, a floor under prices even if demand stays seasonal.
Brooklyn Demand
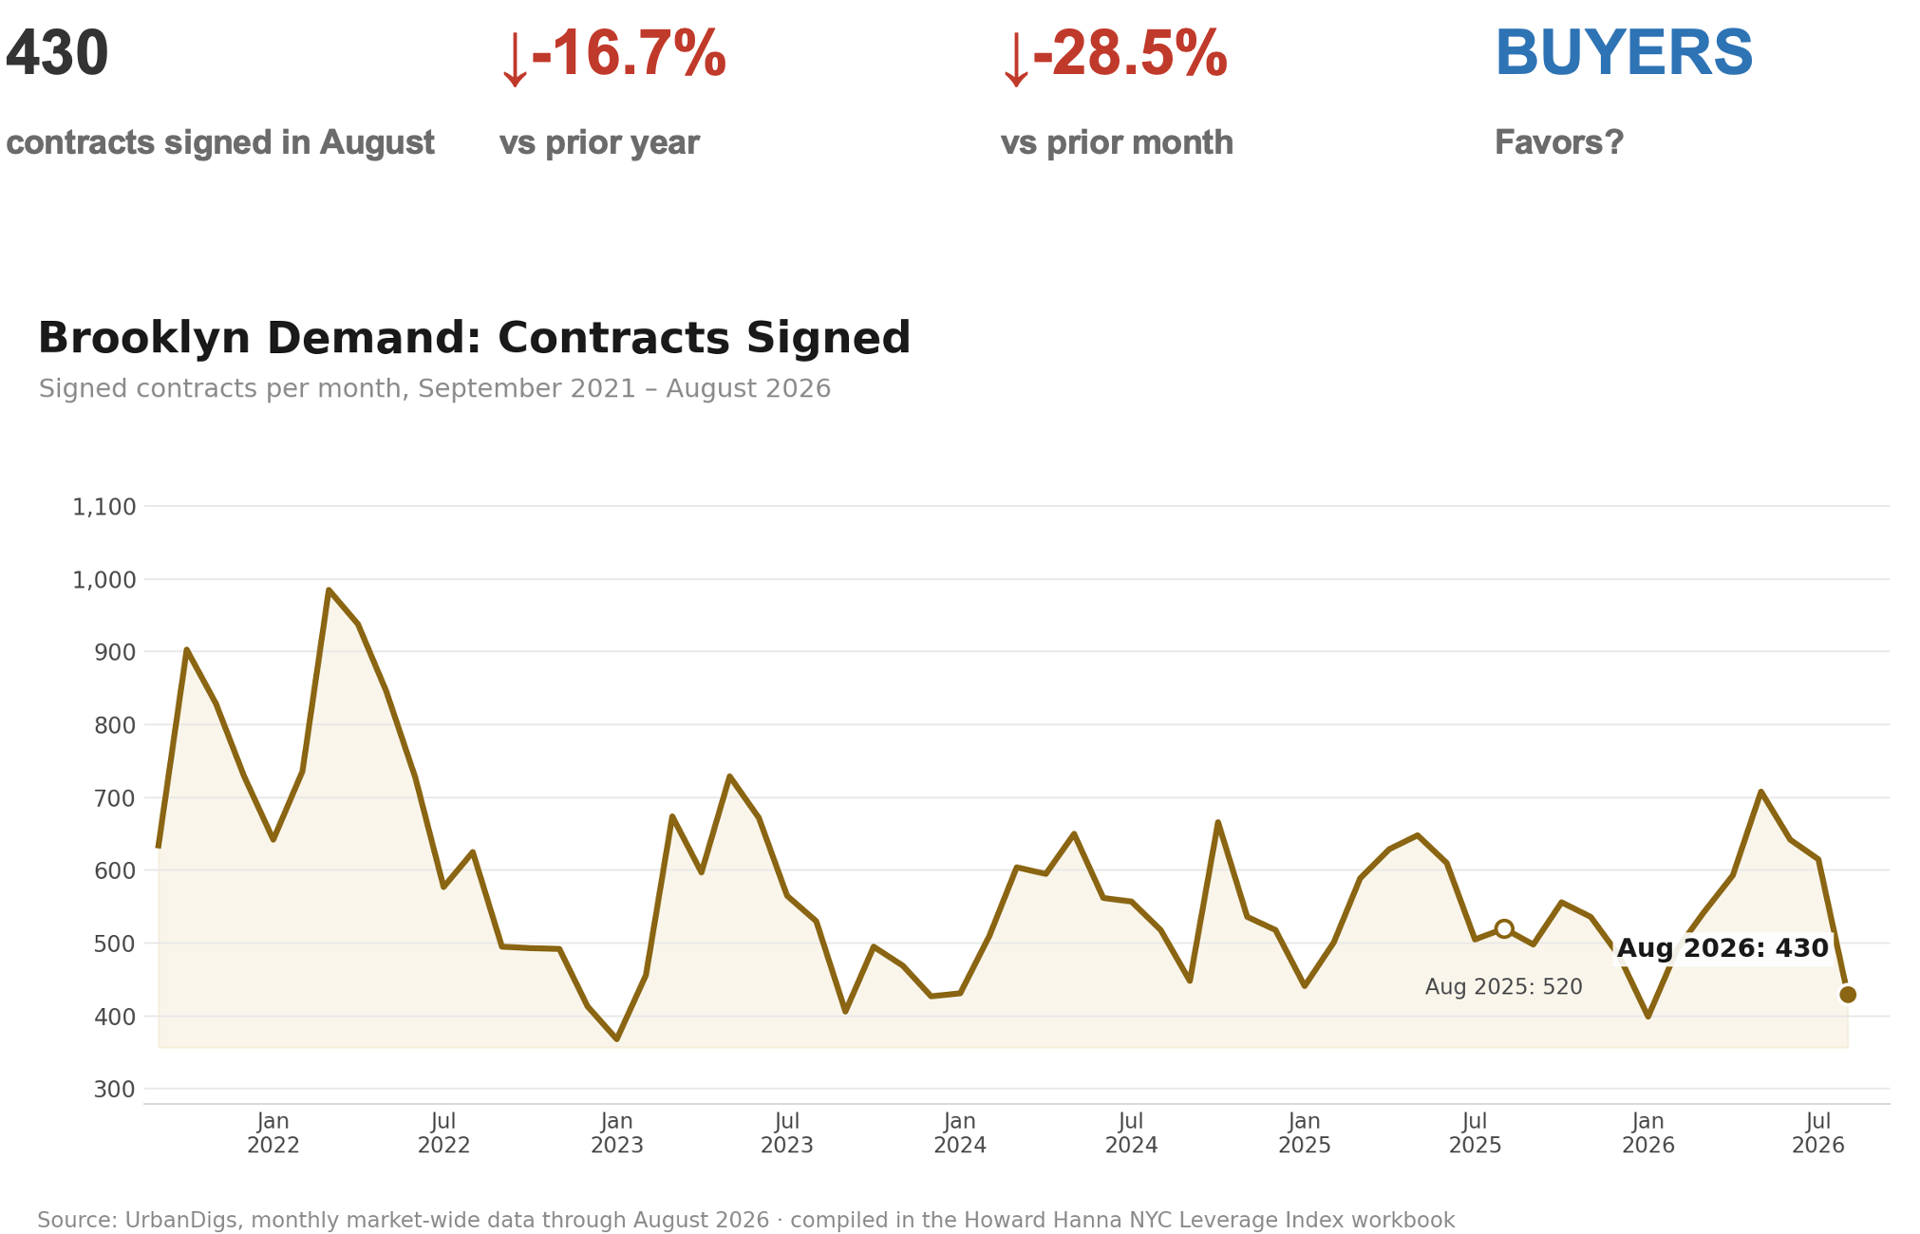
THE STREAK BREAKS: CONTRACTS FALL 16.7% BELOW LAST YEAR
August brought 430 signed contracts, down 28.5% from July and 16.7% below last August, the sharpest cooldown of 2026 after a summer of beating the seasonal script. The Market Pulse slipped to -2.7, below seasonal averages. Pending sales of 1,984 still run 3.6% ahead, so the pipeline bent rather than broke.
Buyers: Competition took a holiday. Move-in-ready product still clears, but early-summer bidding intensity has eased. Use the window before the fall crowd returns.
Sellers: One soft month against the strongest price backdrop in the city is not a trend break, but it is a warning against aspirational pricing. Meet the market at the 2.2% discount.
Outlook: A normal post-Labor Day rebound restores the seller story; a second below-seasonal month would mark a real demand turn.
Brooklyn Median PPSF
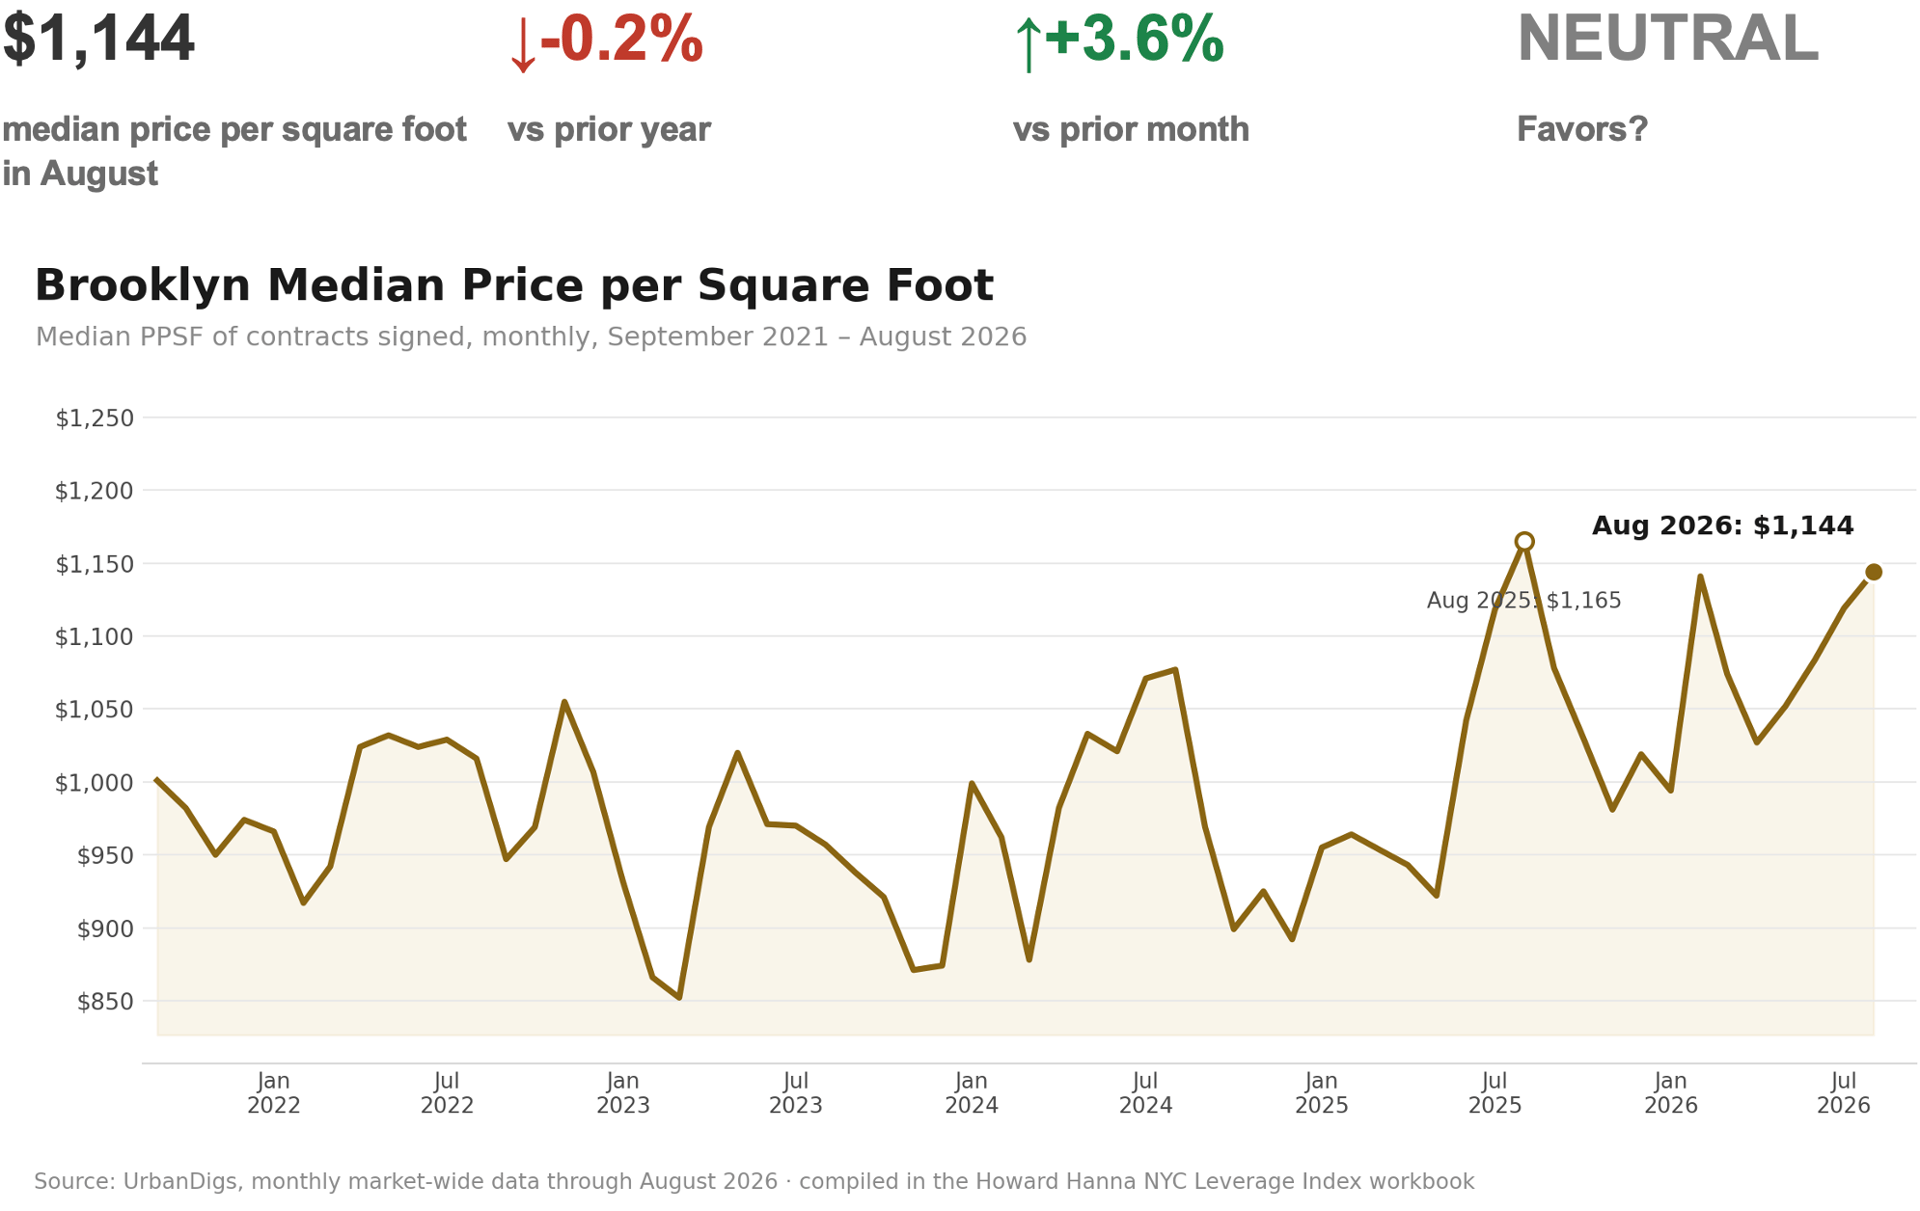
PER-FOOT PRICING RECOVERS THE SUMMER DIP
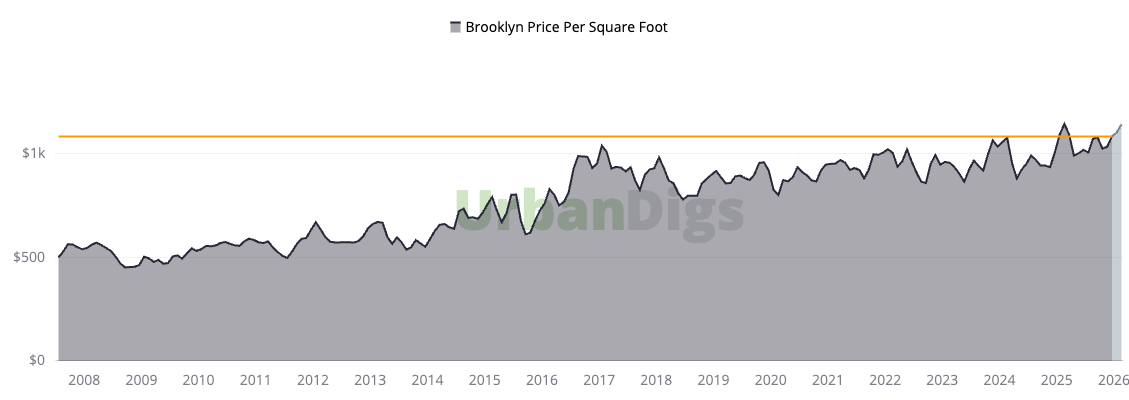
Median PPSF rose to $1,144 in August, up 3.6% from July and 0.2% below a strong August 2025 base. Per-foot pricing has flattened, not fallen: prints held the $1,080-$1,145 band all year while the median pushed to $1.22M on premium mix.
Buyers: Flat per-foot pricing is your entry point. The +10.4% headline overstates what a typical square foot costs; negotiate on the foot, not the headline.
Sellers: Premium, well-located product is carrying the gains. Mid-market listings should anchor to per-foot comps, not the borough median.
Outlook: Expect PPSF to hold $1,100-$1,150 through Q3. The gap between flat per-foot pricing and the surging median is mix, and mix normalizes.
Brooklyn Median Listing Discount
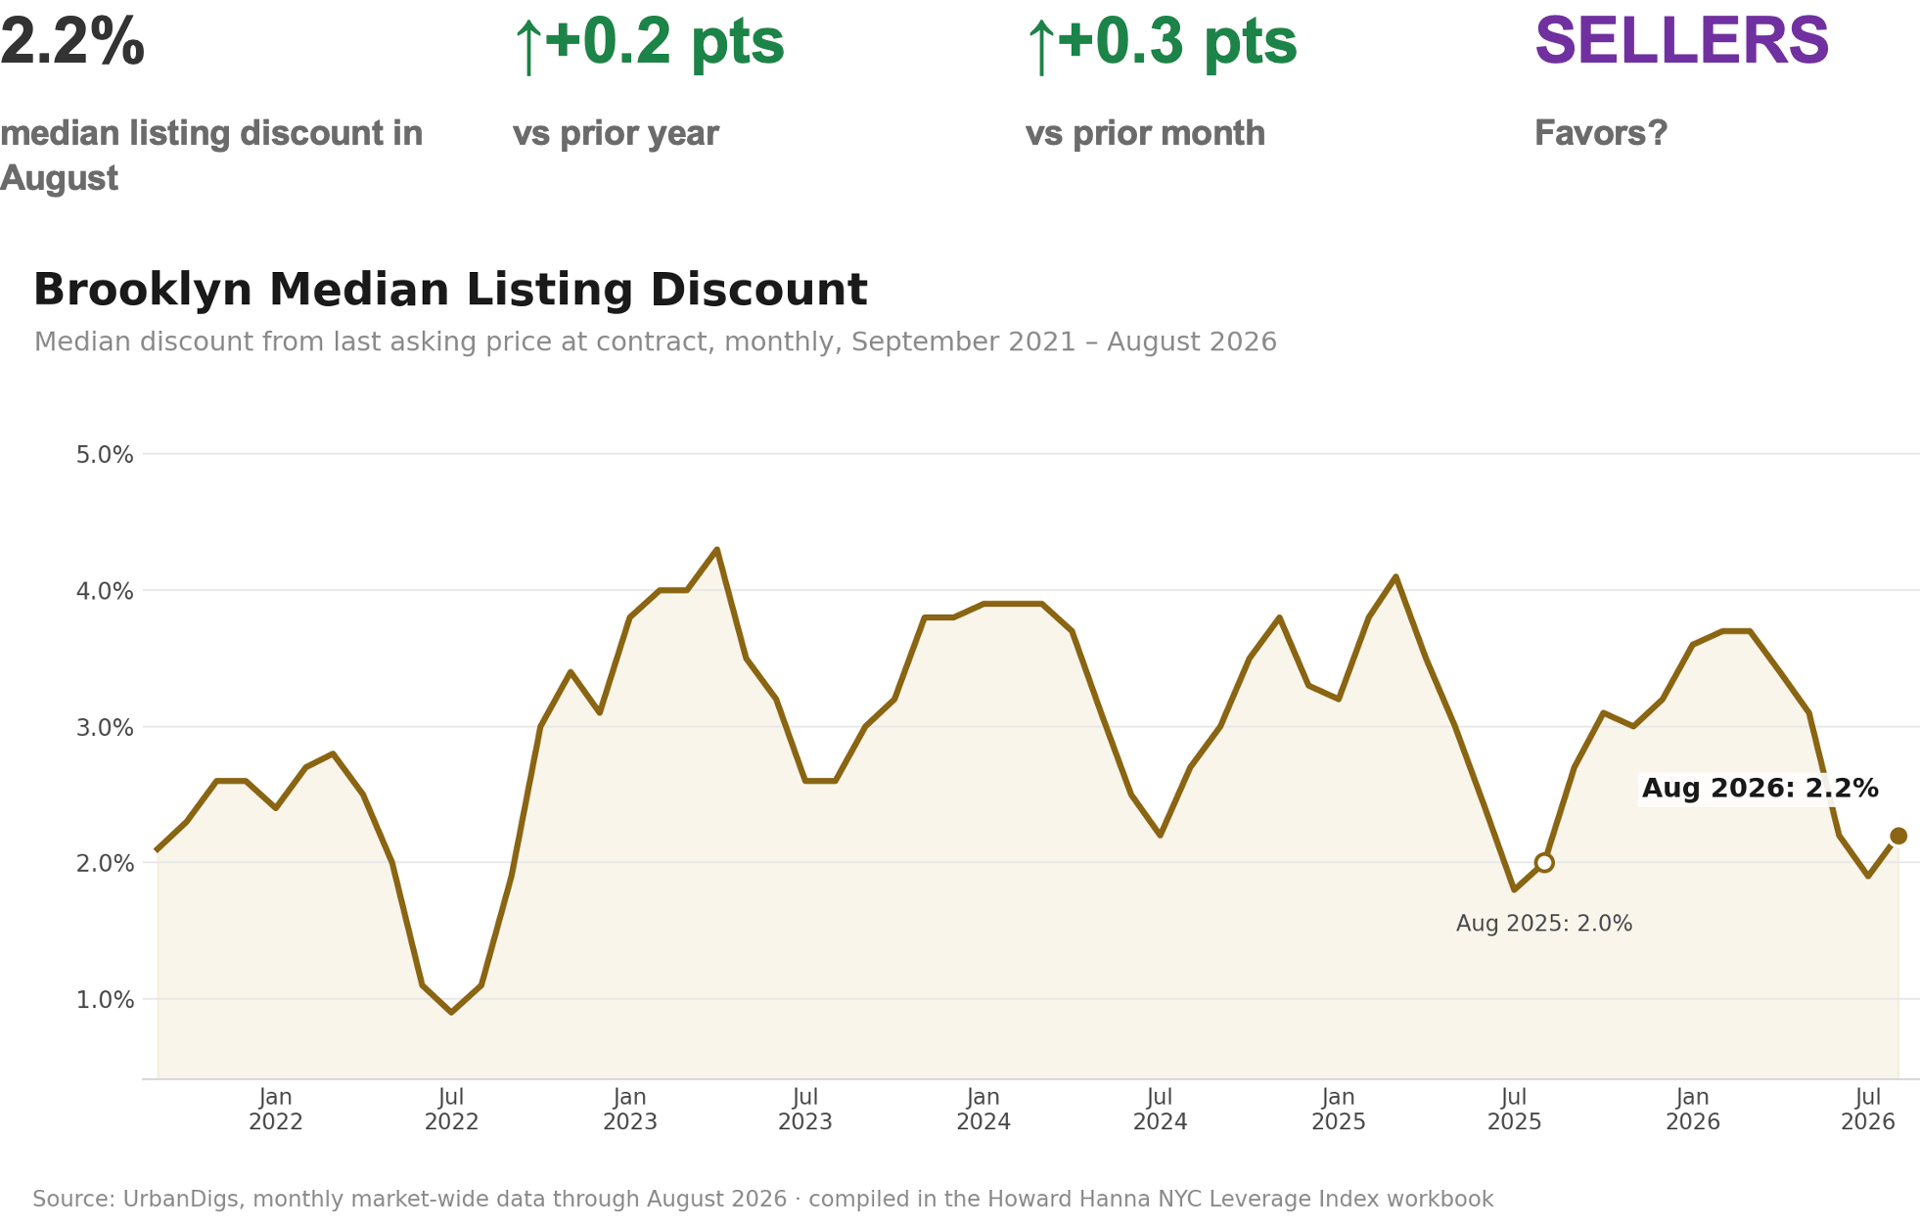
NEGOTIATING ROOM STAYS THE TIGHTEST IN NYC
The median listing discount came in at 2.2% in August, up 0.3 points from July's low but still the tightest in either borough this year. On a $1.2M listing, that is about $26,000 of negotiating room. 29.8% of June sales closed above ask.
Buyers: Well-priced, well-located listings still command clean offers. Aim your negotiating energy at the 120-day-plus pool, where the median discount runs 9.5%.
Sellers: Pricing power held through the demand cooldown. The market protects accurately priced listings and punishes the rest.
Outlook: The low-2% range holds while supply keeps pace with cooling demand. A heavy fall listing wave is the main risk.
Rental Remarks
ASKING RENTS JUMP TO A RECORD $3,990: GROWTH RE-ACCELERATES TO +5.0%
Brooklyn's median asking rent jumped 2.3% in July to $3,990, a record and up 5.0% year over year, re-accelerating from June's 4.0%.
The renter-friendly turn did not last: inventory rose 5.3% to 14,147 listings but sits 2.0% below last July, and the share of listings cutting price eased to 12.5%, well under last year's 15.2%. Peak-season demand absorbed the supply build and then some.
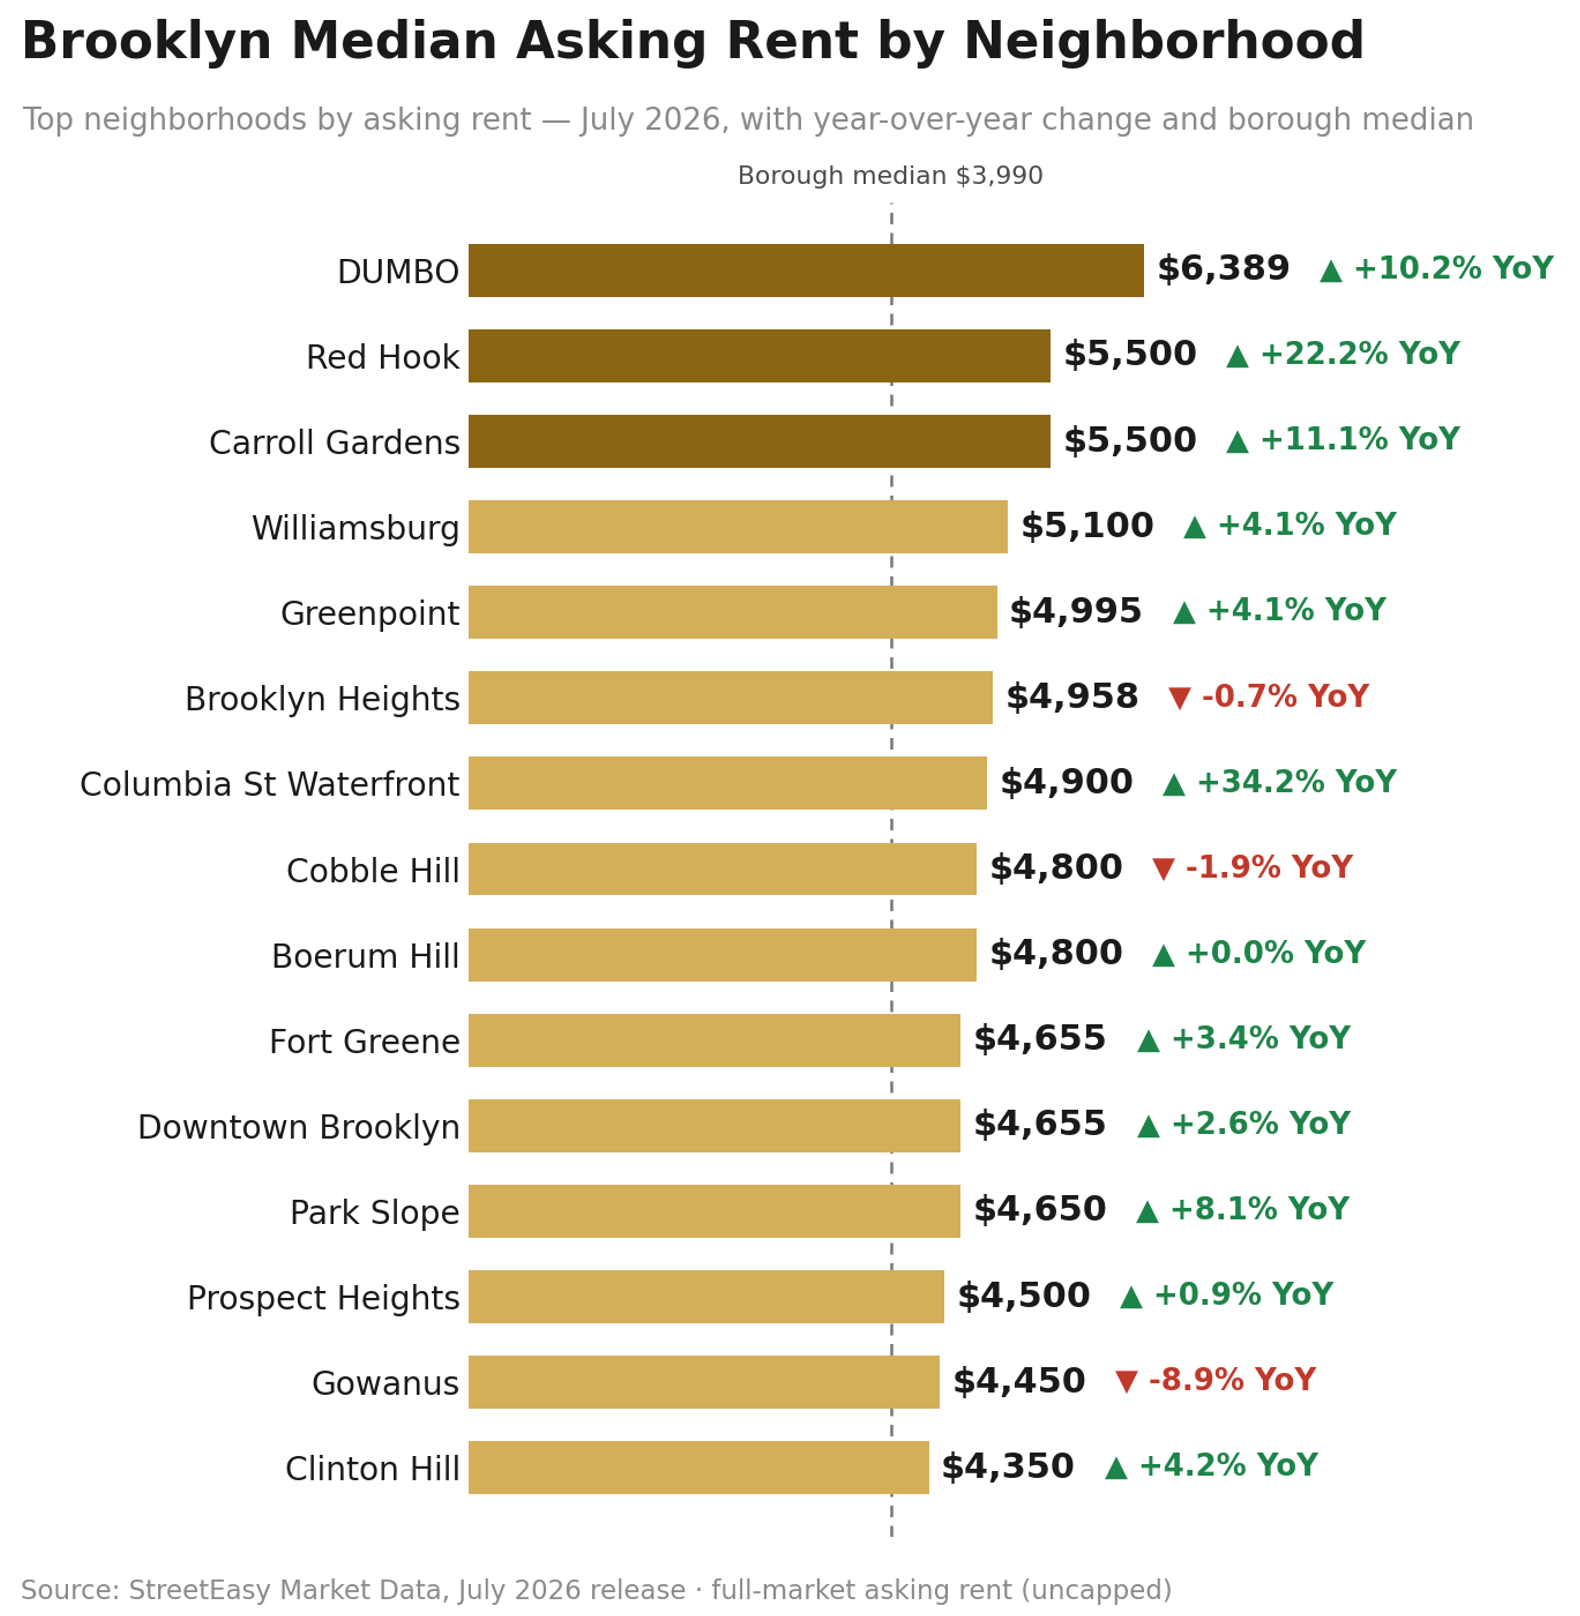
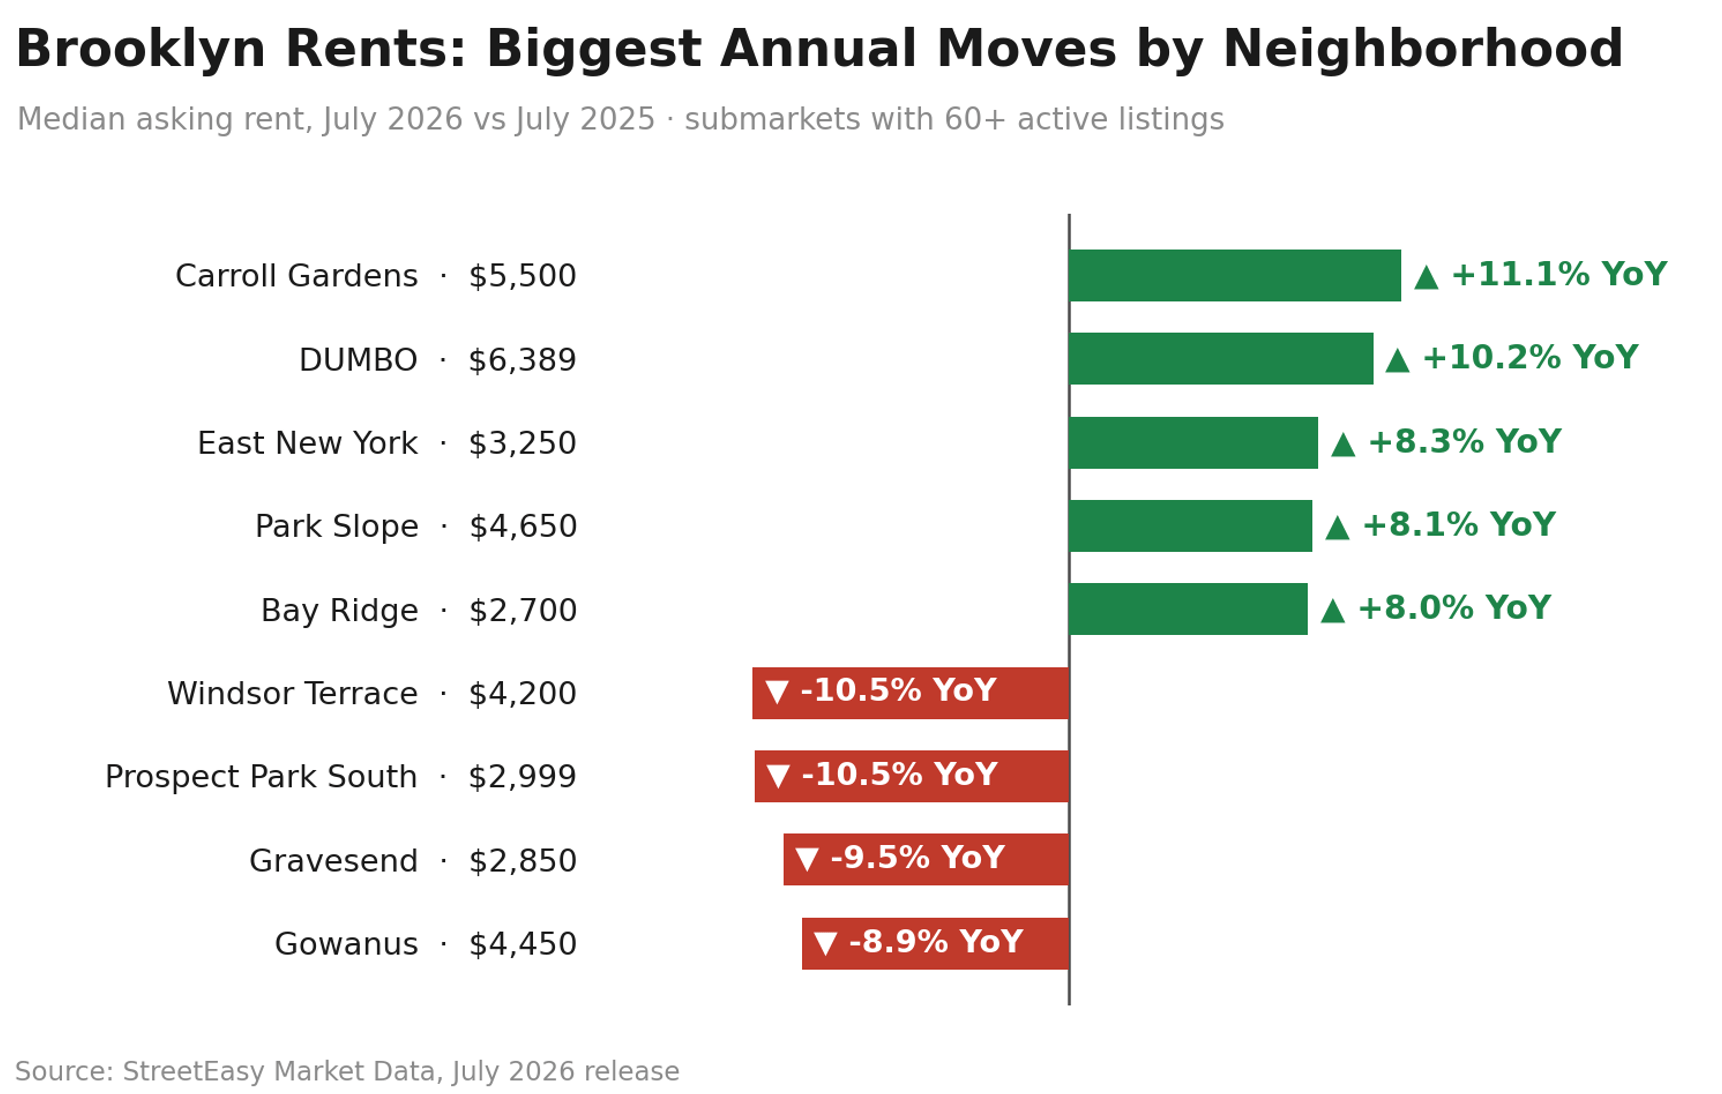
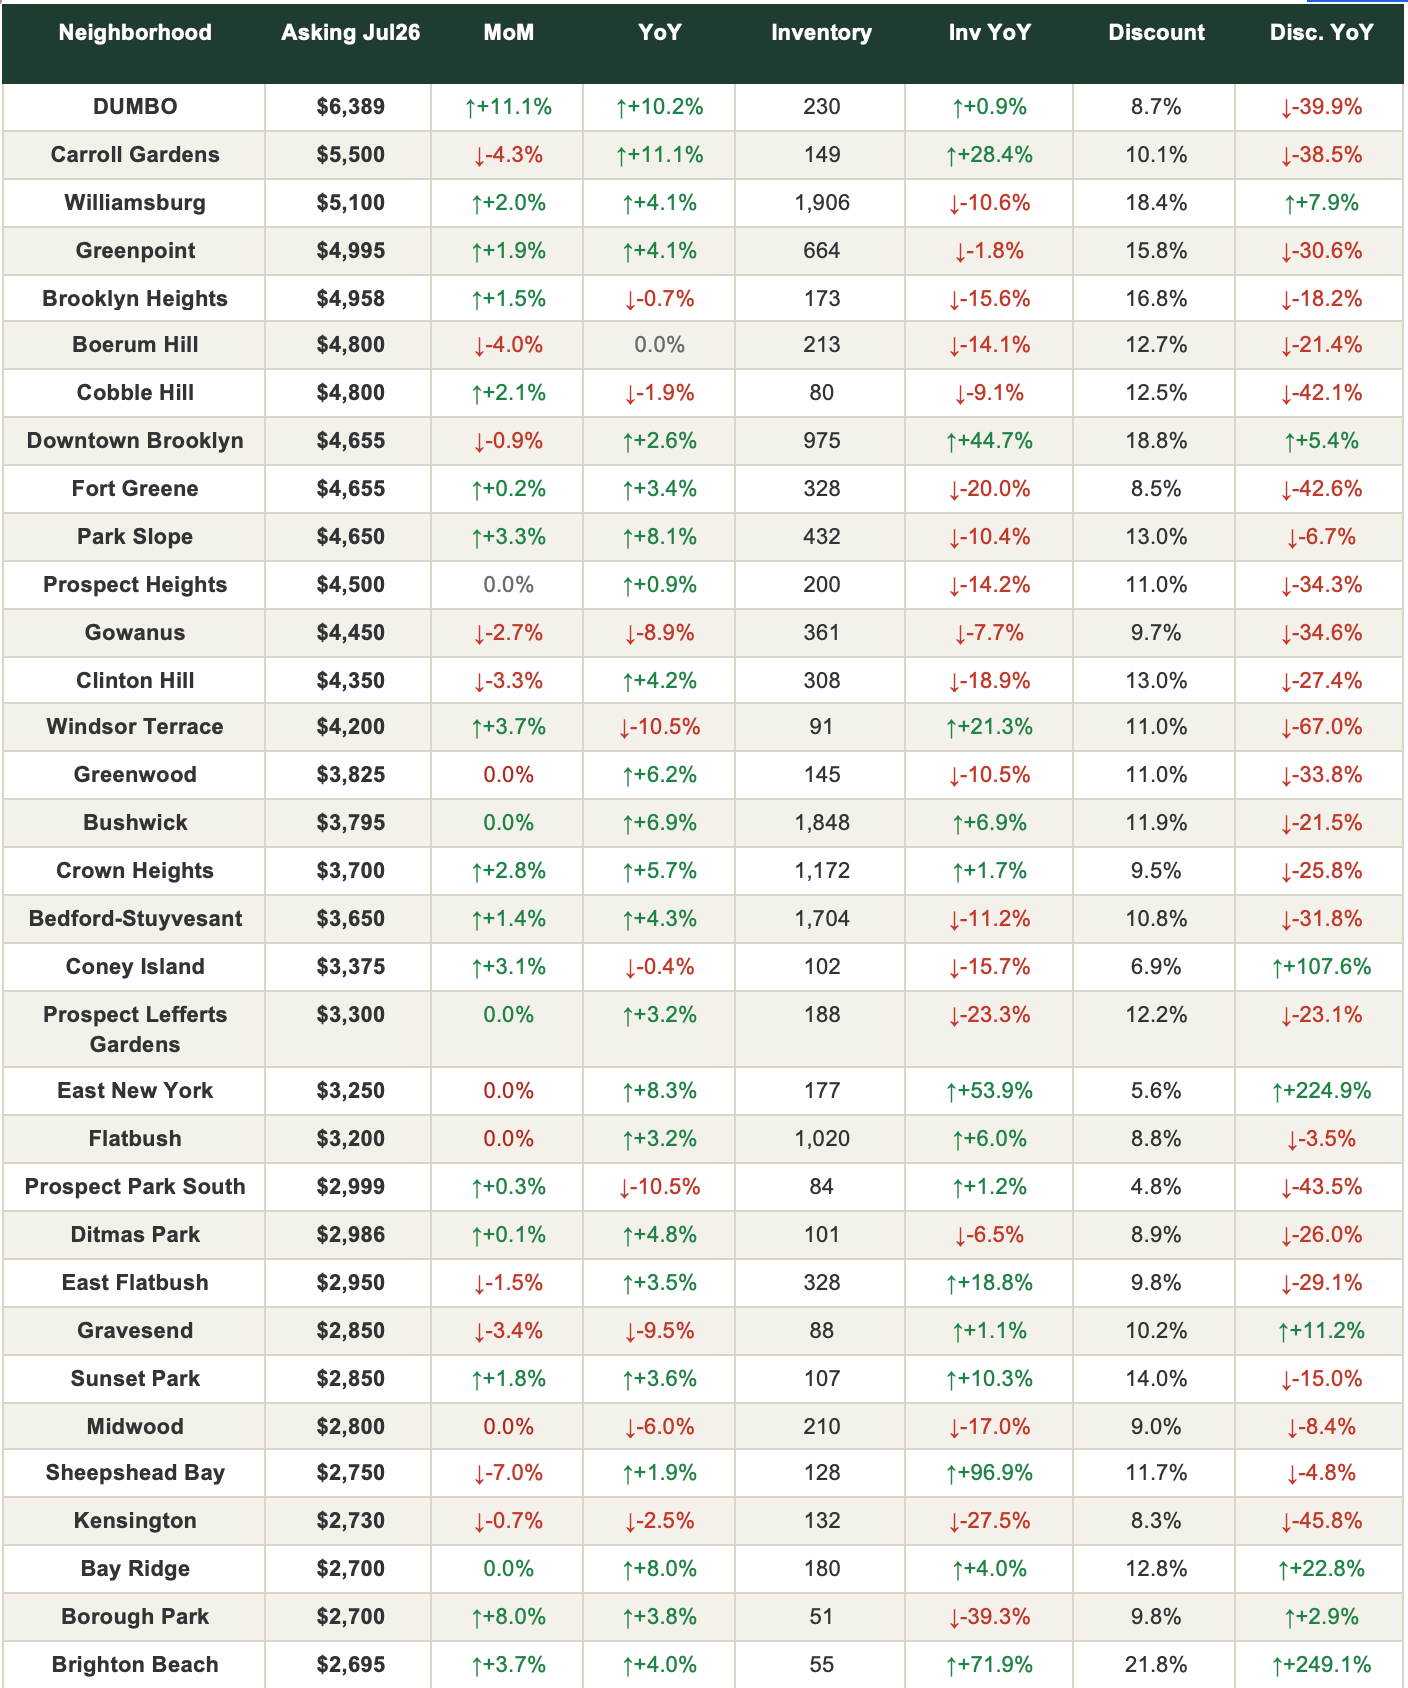
DUMBO holds the top of the market at $6,389, up 10.2% year over year, with Carroll Gardens close behind at $5,500 (+11.1%). The gainers run through the brownstone belt, Park Slope +8.1% and Bay Ridge +8.0%, plus East New York +8.3% at the value end. The soft pockets sit south and west of the park: Windsor Terrace (-10.5%), Prospect Park South (-10.5%), Gravesend (-9.5%) and Gowanus (-8.9%).
A DECADE OF RENTS: RECORDS, AGAIN
Zoom out and the story sharpens. Jonathan Miller's average-rent series, compiled by Howard Hanna NYC Research, puts Brooklyn's average rent at $4,871 in July, up 13.6% year over year and a record six months running; Manhattan's average hit $6,306, up 14.7%.
Averages run above StreetEasy's medians because they carry the luxury tail, and Brooklyn's premium rentals, DUMBO, Carroll Gardens and the brownstone belt, are where 2026's growth sits. The math for renters: the average Brooklyn apartment now costs about $58,500 a year. At ~7% jumbo rates, that is a buy-versus-rent conversation worth having, especially in the yield corridor, where rent covers more of a unit's cost than anywhere else in the city.
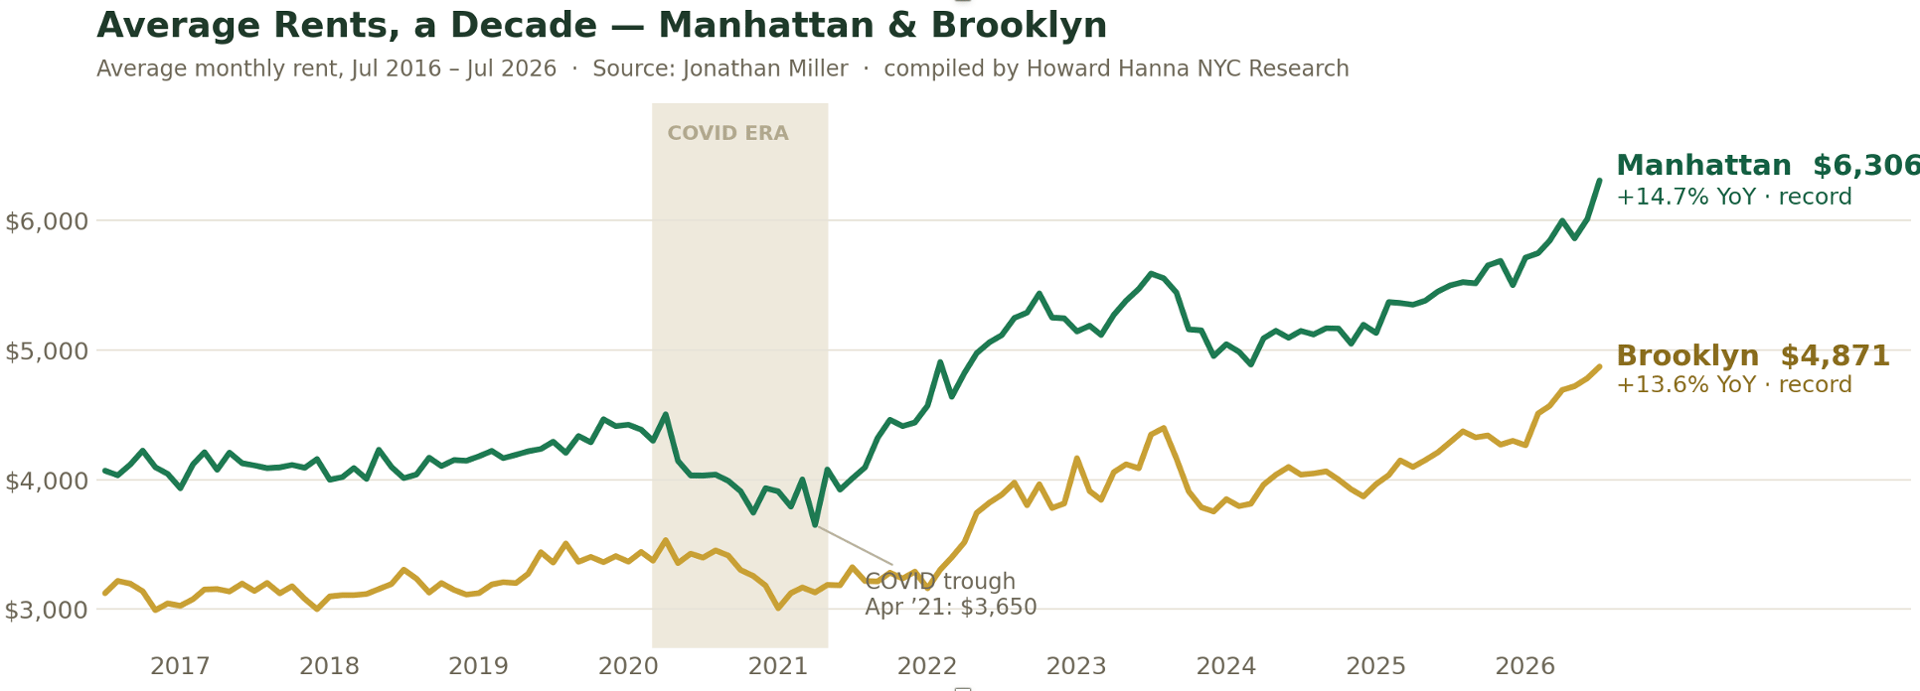
Source: Jonathan Miller average rent series, July 2026, compiled by Howard Hanna NYC Research; average monthly rent, Manhattan and Brooklyn, July 2016 to July 2026.
For Renters: June's window narrowed fast: the price-cut share fell to 12.5% and growth re-accelerated. Selection is best where rents are falling, Windsor Terrace, Gowanus and Gravesend; elsewhere, move decisively.
For Landlords: A record $3,990 median restores pricing power, but it is neighborhood-specific: the brownstone belt is running while the park's southern rim discounts.
Outlook: Expect 4-5% annual gains through the fall, with the widest neighborhood spread of the year underneath.
Cross-Check: Brooklyn Sales by Neighborhood
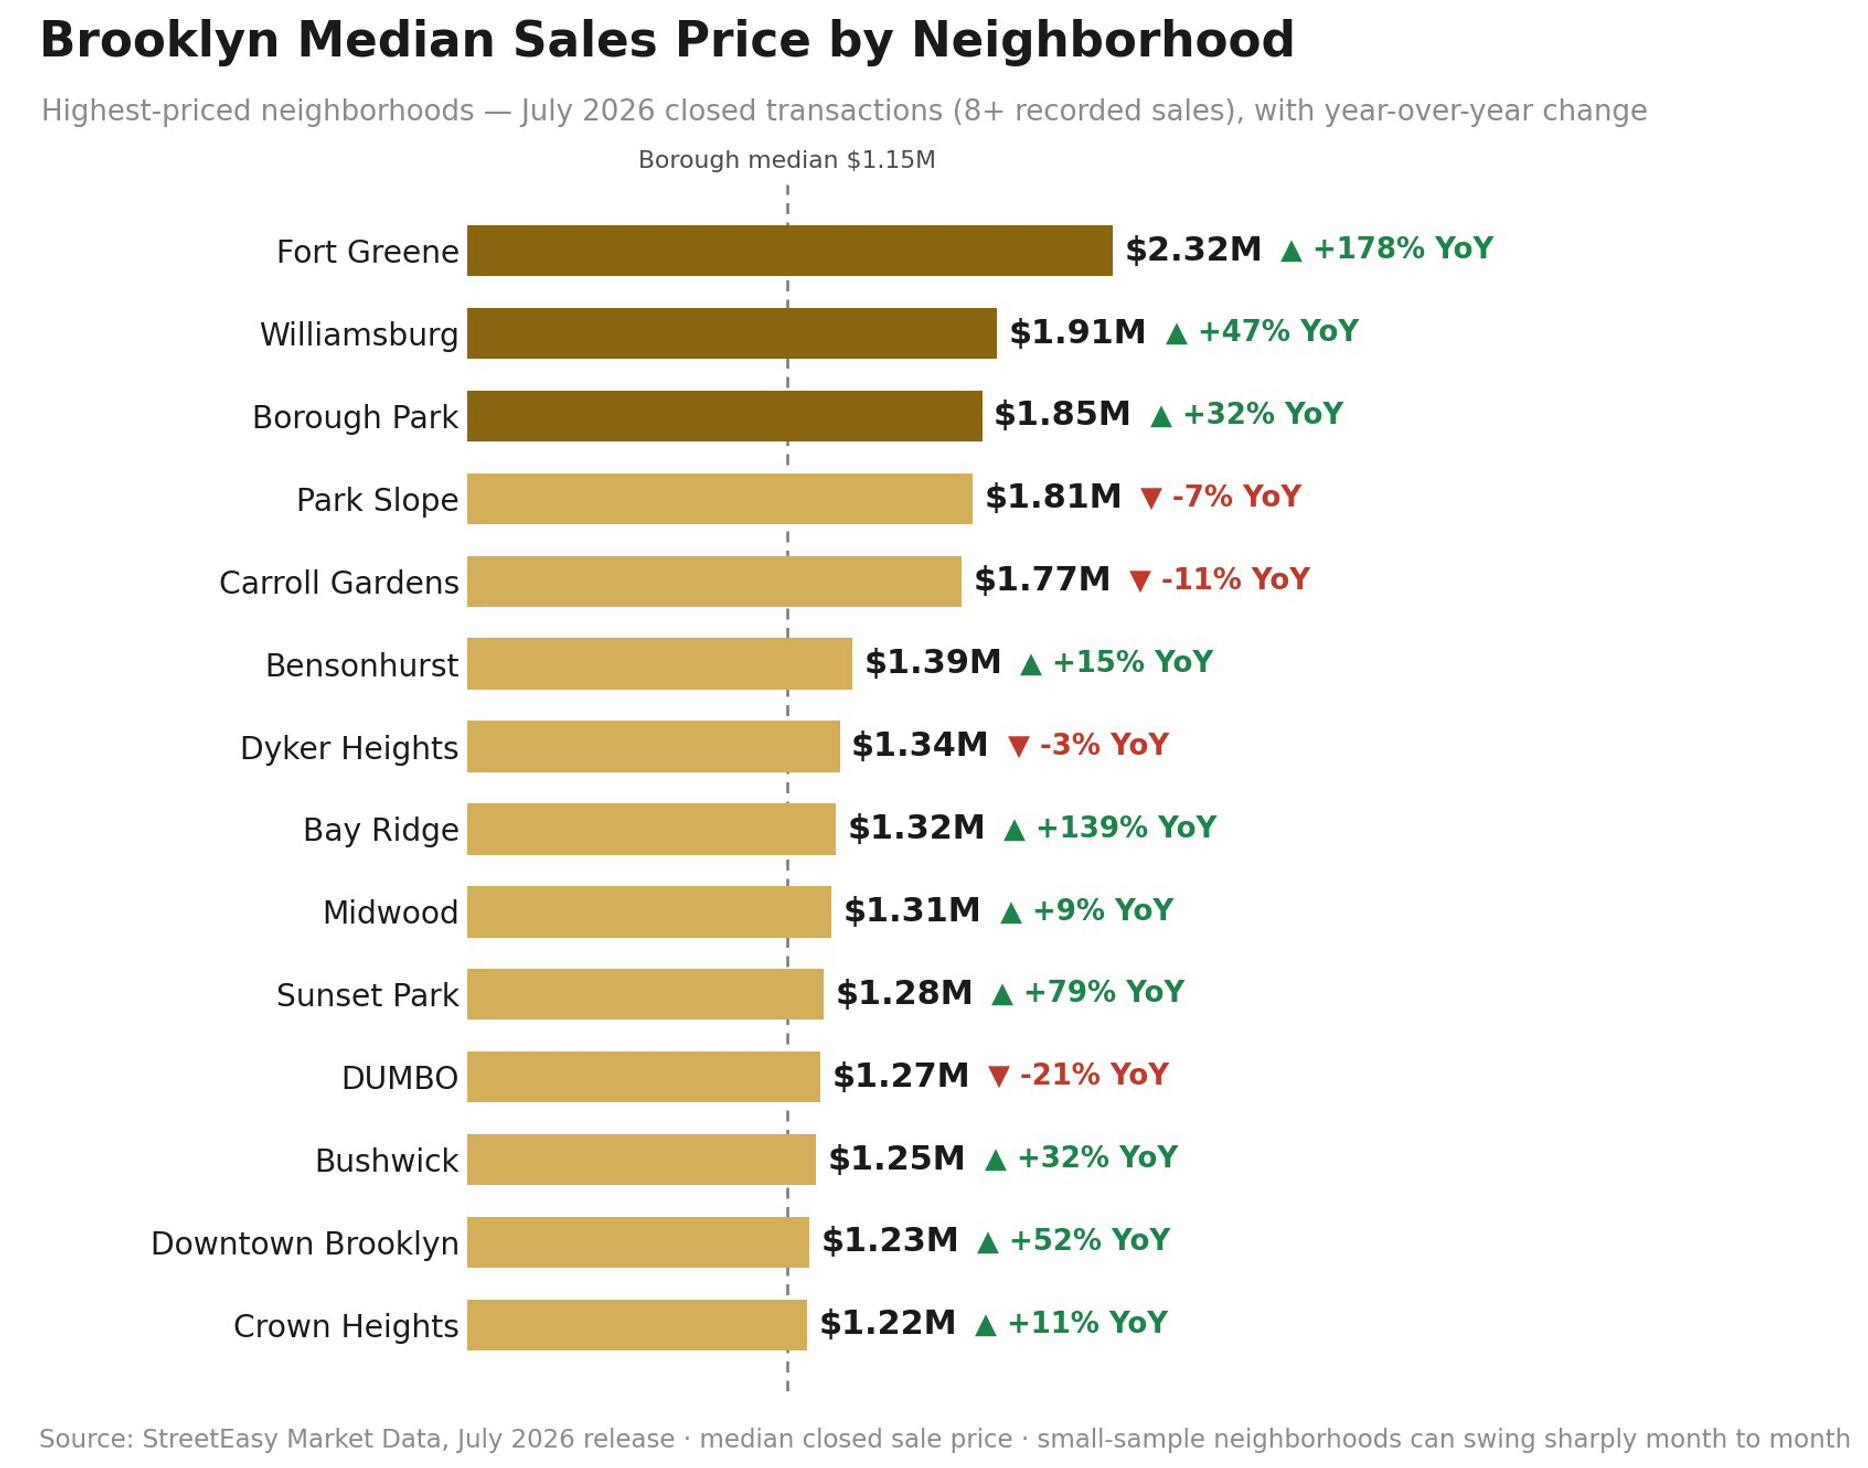
StreetEasy's July closings put the borough median at $1.15M, up 12.4% year over year. Among neighborhoods with eight or more recorded sales, Fort Greene leads at $2.32M, ahead of Williamsburg ($1.91M on 36 closings, the deepest sample), Borough Park ($1.85M) and Park Slope ($1.82M). The value end: Windsor Terrace $650K, East New York $615K, Brighton Beach $480K.
Mortgage Remarks
JUMBO APRS AT ~7%: A REAL PAYMENT EVENT AT BROOKLYN PRICE POINTS
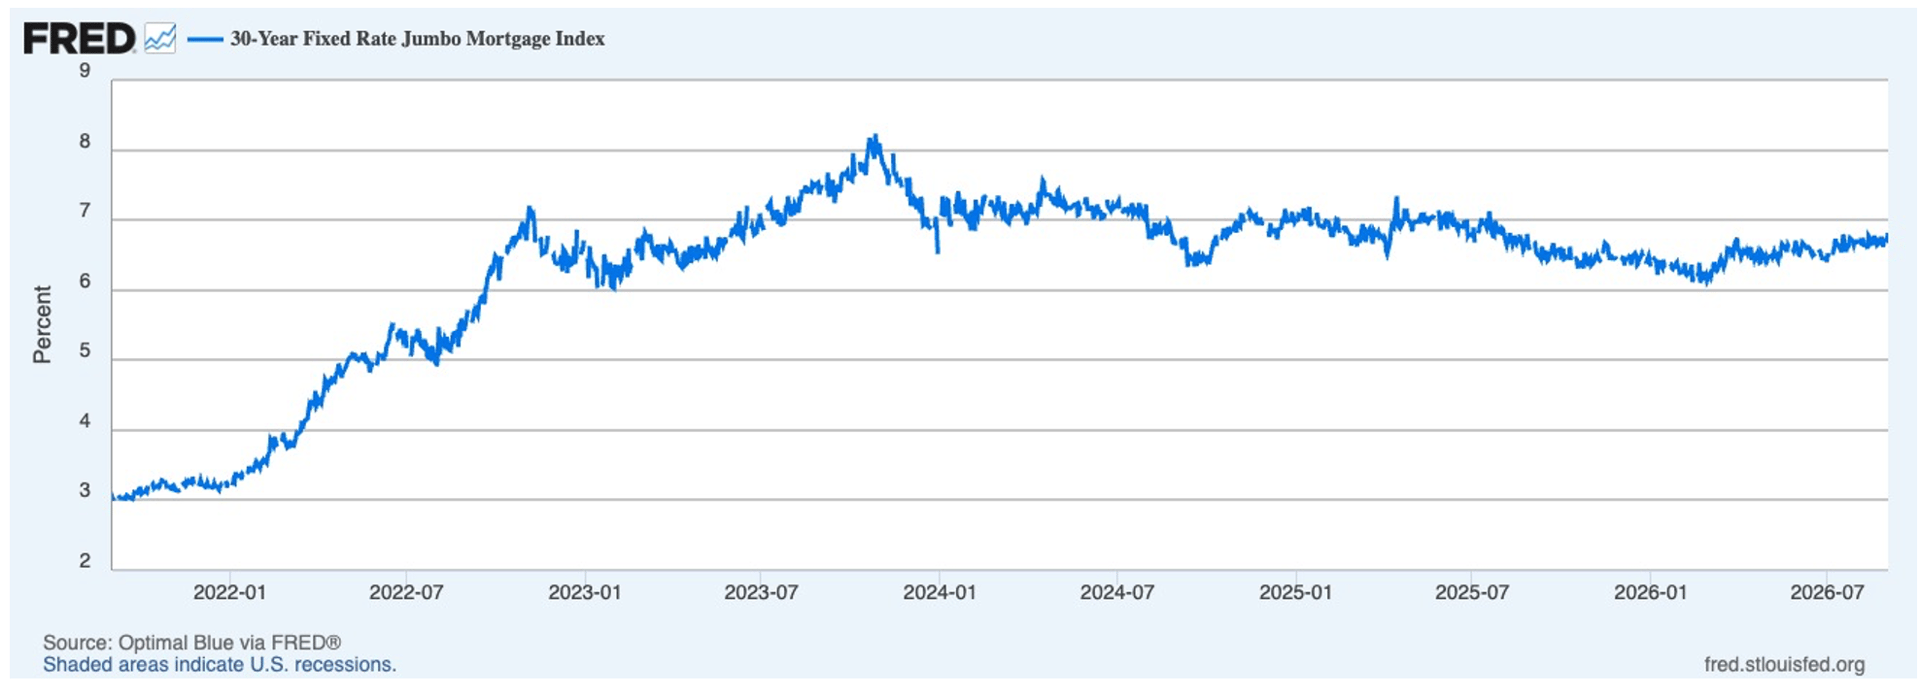
Thirty-year jumbo APRs at the major banks averaged 6.99% as of September 2, per our tracker: Bank of America 7.11%, Chase 6.72%, Wells Fargo 7.14%. That is up from 6.73% in early August and 6.07% in late February, the highest of 2026 and the first 7-handle at two of the three banks.
Brooklyn's buyer pool leans on financing more than Manhattan's, so the move bites harder here: about $305 more per month per $500K borrowed than at February's low, $90 of it since early August. Demand is feeling it: August contracts fell 16.7% below last year.
Buyers: Refresh the pre-approval at ~7%, not the spring quote. Every $50,000 off the price is worth about $330 a month at today's rates.
Sellers: APRs reached ~7% just as August contracts cooled 16.7% below last year. Accurate pricing is what still converts; correctly priced homes are clearing near ask.
Outlook: The Fed held in July with three dissents favoring a hike; September 16 is next. Expect a 7-handle into the fall; the entry-level segment feels it first.
THE RATE BEHIND THE RATE: THE 10-YEAR TREASURY AT A THREE-YEAR HIGH
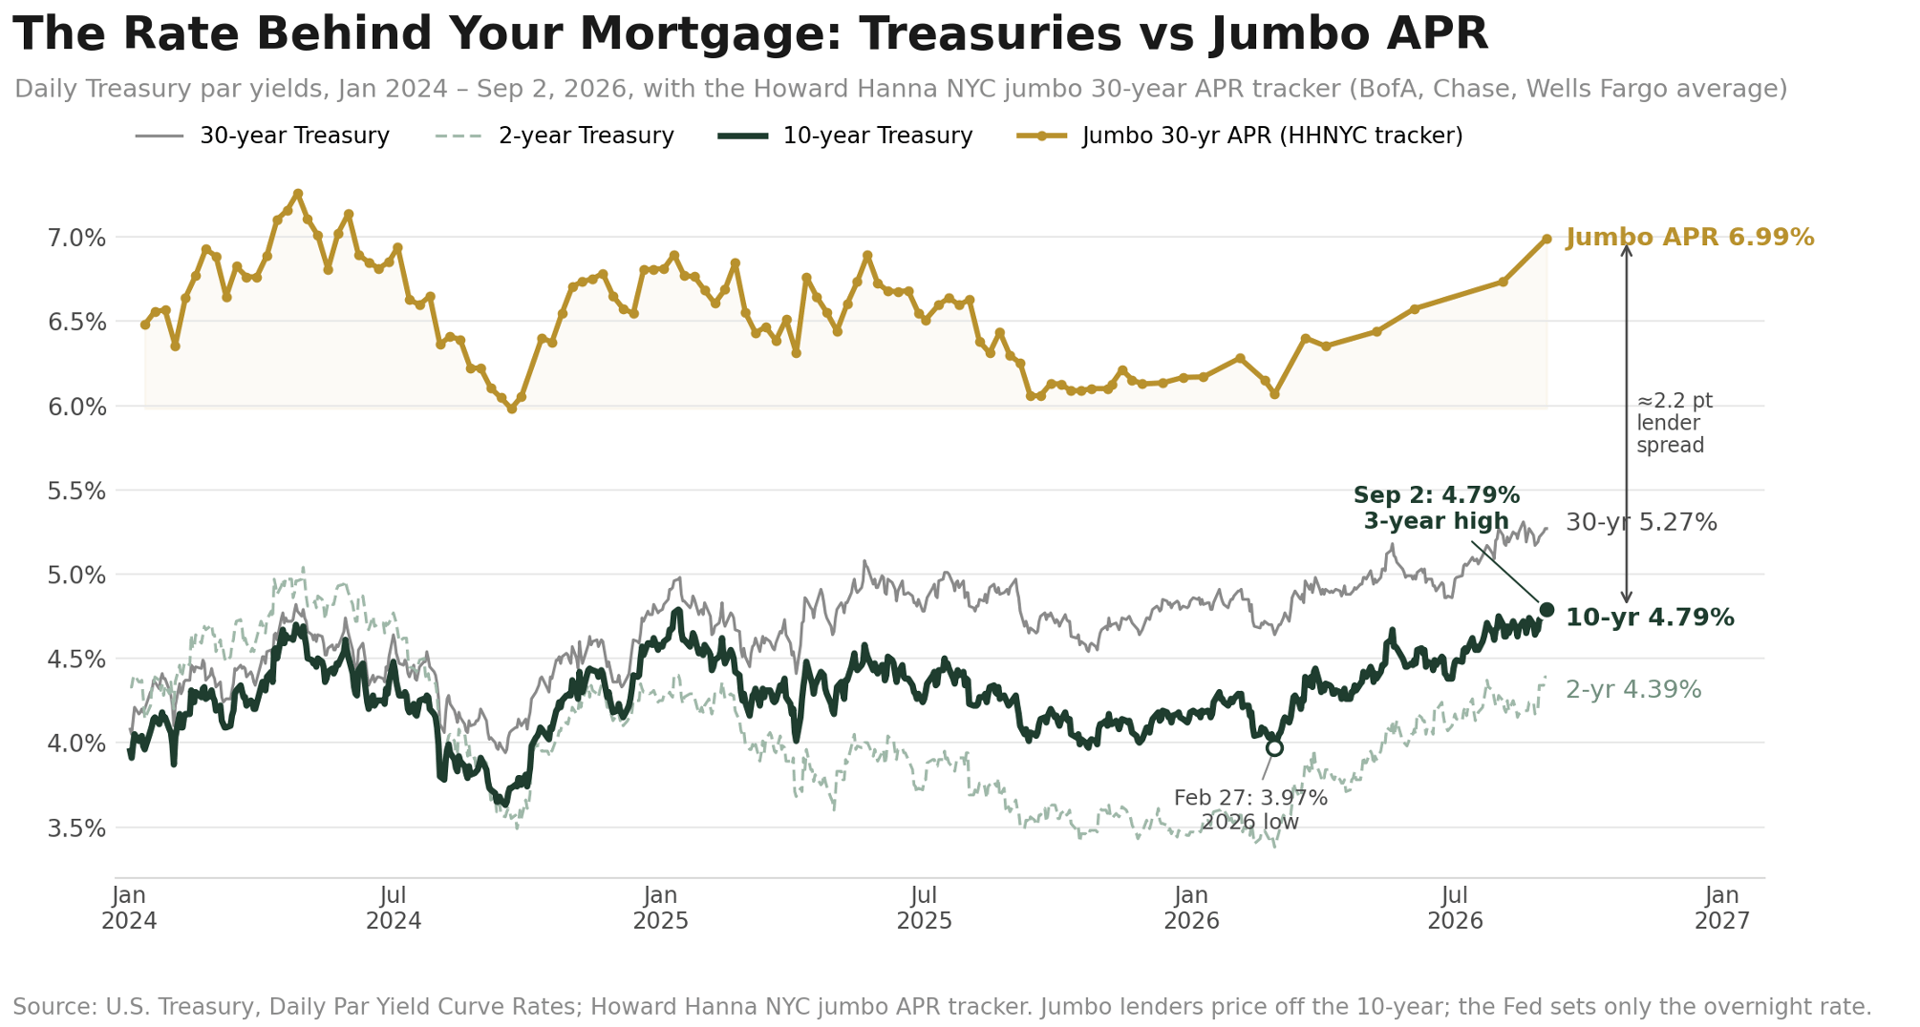
Mortgage rates take their cue from the bond market, not the Fed. The 10-year Treasury yield, the benchmark jumbo lenders price against, has climbed from 4.19% at the start of 2026 to 4.79% on September 2, matching its highest level in three years, and the 30-year sits at 5.27%, near the top of the same range.
The 2-year, which tracks expectations for Fed policy, has risen even faster, from 3.47% to 4.39%, as the market moved from pricing cuts to pricing the hikes three FOMC members are already arguing for. That is why jumbo APRs reached ~7% with the Fed on hold: lenders add roughly 2.2 points over the 10-year, and the 10-year did the moving.
For Brooklyn buyers, who lean on financing more than Manhattan's, the practical read is simple. Relief will show up in the Treasury market before it shows up at the bank; watch the 10-year, and treat any dip toward 4.5% as a financing window, not a trend.
Consumer Sentiment
THE NATIONAL MOOD IS NEAR RECORD LOWS. BROOKLYN SHOWS WHAT THAT LOOKS LIKE LOCALLY
The University of Michigan's Index of Consumer Sentiment, the country's longest-running gauge of how households feel about their finances and the economy, fell to 51.7 in August, down 6.3% on the month and 11.2% from a year ago. Higher means more confident: the index is scaled to 100 in 1966 and has averaged around 85. The low 50s rank below the 1st percentile of the survey's history, and May's 44.8 was a new all-time low. The worry is inflation, which households expect to run 4.0% over the next year.
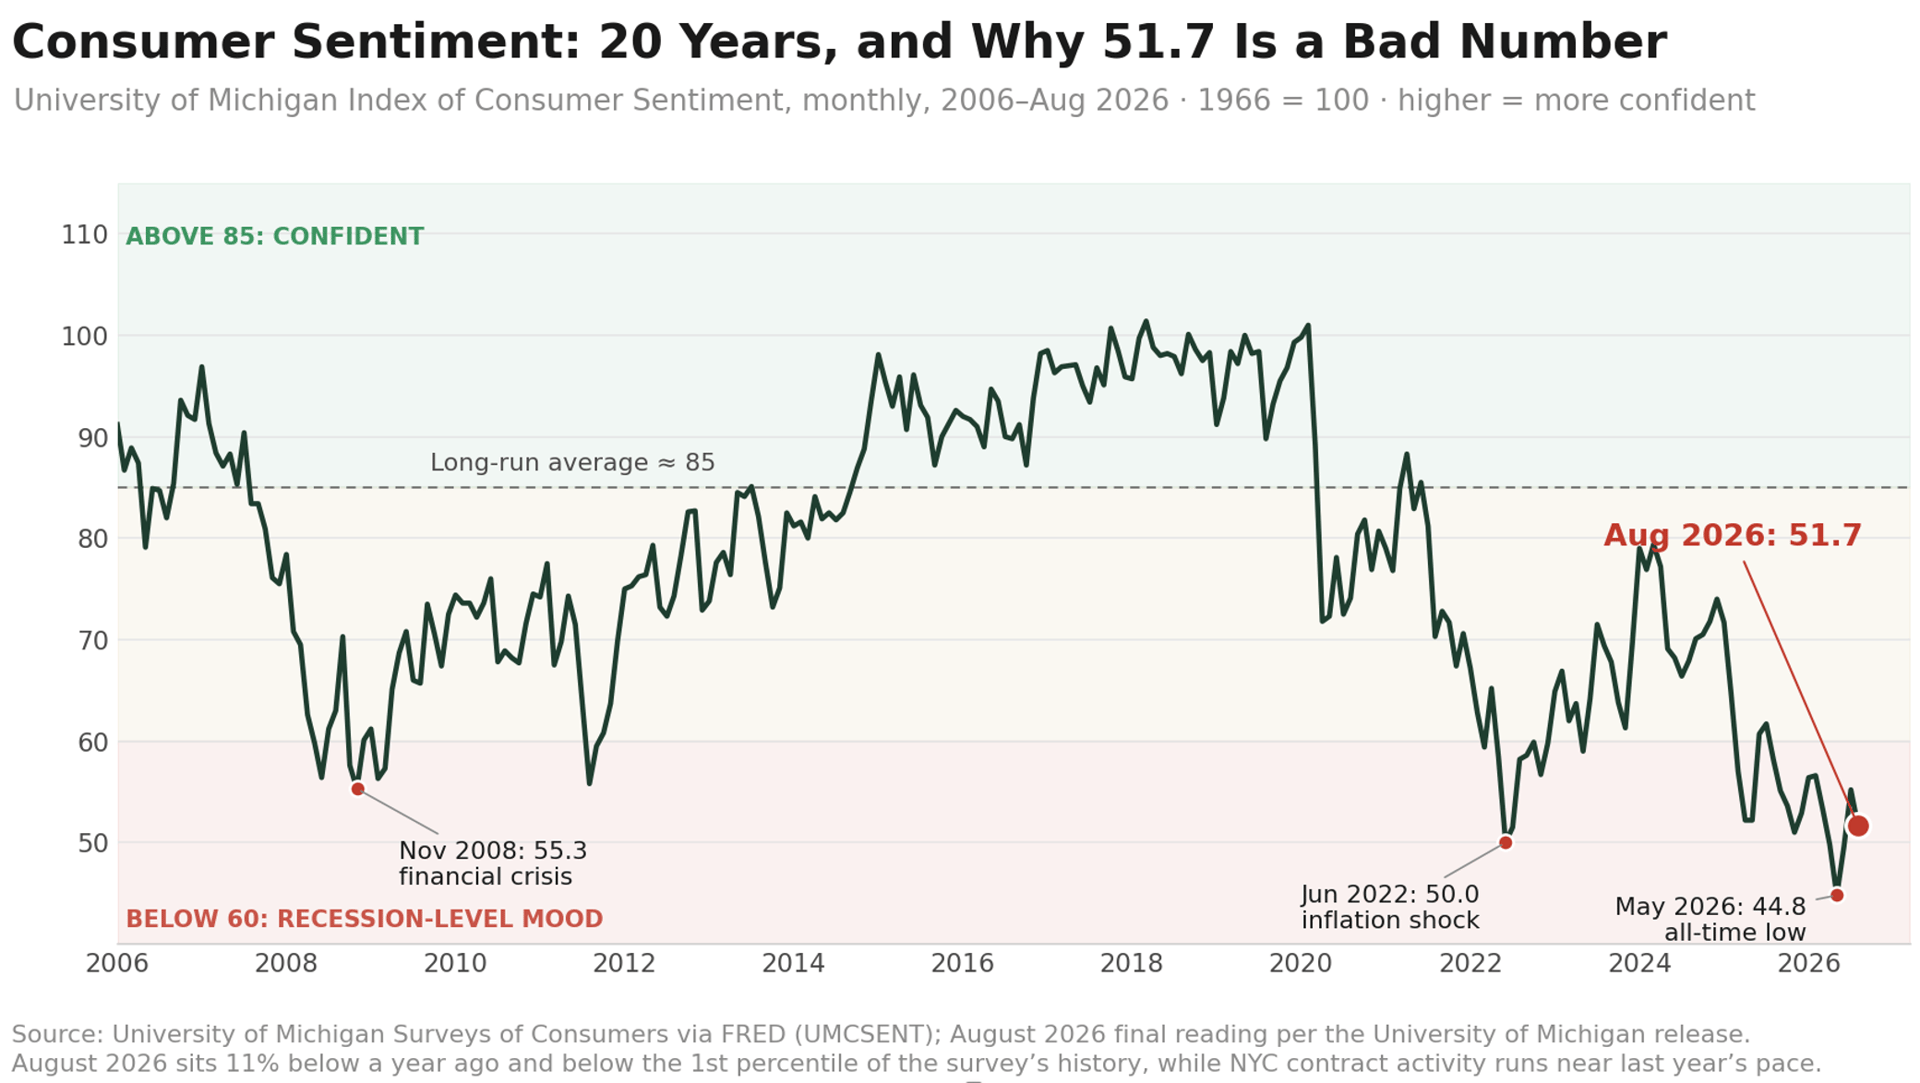
Brooklyn tells the sentiment story in two halves. Closed prices up 10.4% and a 2.2% discount say active buyers are paying up for the right home. The 28.5% drop in contracts and a below-seasonal pulse say fewer of them are stepping forward. That is a low-sentiment market at street level: conviction intact, participation thinner. It also explains the bedroom data, where turnkey premium product sets records while entry-level condos negotiate.
Buyers: Thinner participation is your opening: fewer rival bidders, a 9.5% median discount on 120-day-plus listings, and sellers who would rather deal than relist in a crowded September.
Sellers: The buyers in the market are serious and comparing you against closings, not your neighbor's aspiration. Price to the 2.2% discount and present turnkey; hesitation is answered with data, not waiting.
Outlook: Sentiment tends to snap back when inflation expectations ease. Until then, expect a deliberate buyer and a market that rewards preparation.
Investor Insights
Currency and International Demand
As in Manhattan, the FX story cooled in July: the dollar index ended the month just below 100 with EUR/USD near 1.15, roughly flat on the summer after June's breakout. For international buyers, Brooklyn's case now rests on fundamentals, a lower entry point than Manhattan and record borough rents, rather than on currency.
Domestic Investors and Yield
Brooklyn's investment case sharpened in July: a lower entry point than Manhattan ($1.15M vs $1.23M on July closings), the city's highest gross yields, and record rents at $3,990 with growth re-accelerating to 5.0%. With jumbo APRs at ~7%, the spread between what a unit earns and what it costs to carry matters more than ever, and it is widest in the south-of-the-park yield corridor.
New This Month: The Investor Yield Map
Updated for July: Coney Island tops the entire city at 8.5% gross ($3,375 median rent against a $479K median ask), ahead of Flatbush at 6.4% and Sheepshead Bay at 6.0%, with Midwood and Brighton Beach at 5.4%. Clinton Hill (5.2%) remains the standout blend of yield and rent momentum. Cobble Hill (1.3%), Borough Park (1.6%) and Sunset Park (2.0%) stay trophy territory. Inside one borough, the spread runs from 1.3% to 8.5%.
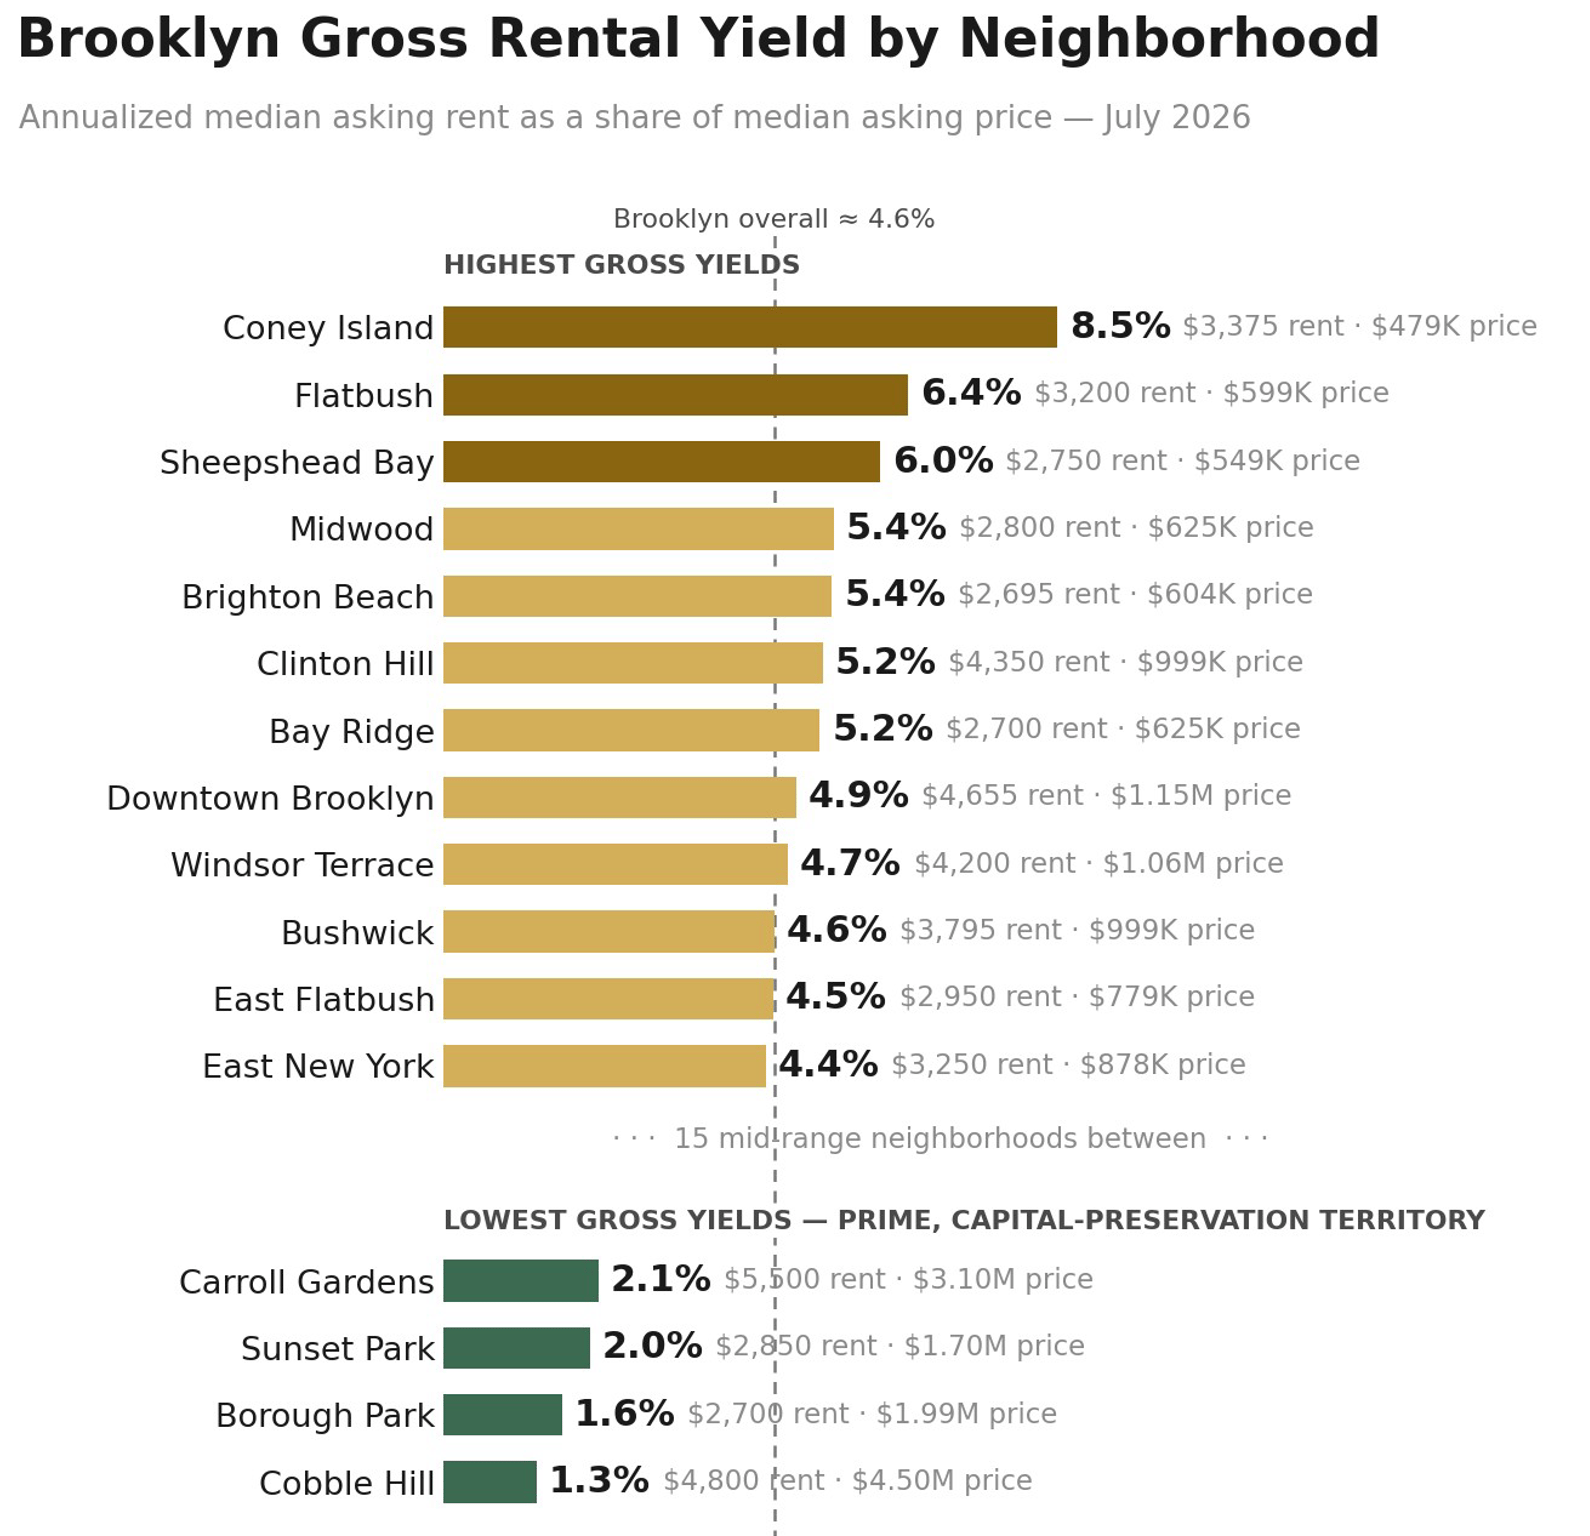
Method: gross yield = annualized StreetEasy median asking rent ÷ median asking price, both July 2026, same source and stage. A screening measure before property taxes, common charges, insurance and vacancy, not a cap rate. Submarkets with fewer than 50 active rentals or 30 active sale listings excluded.
Pied-à-Terre Surcharge: What Non-Primary Owners Need to Do by October 6
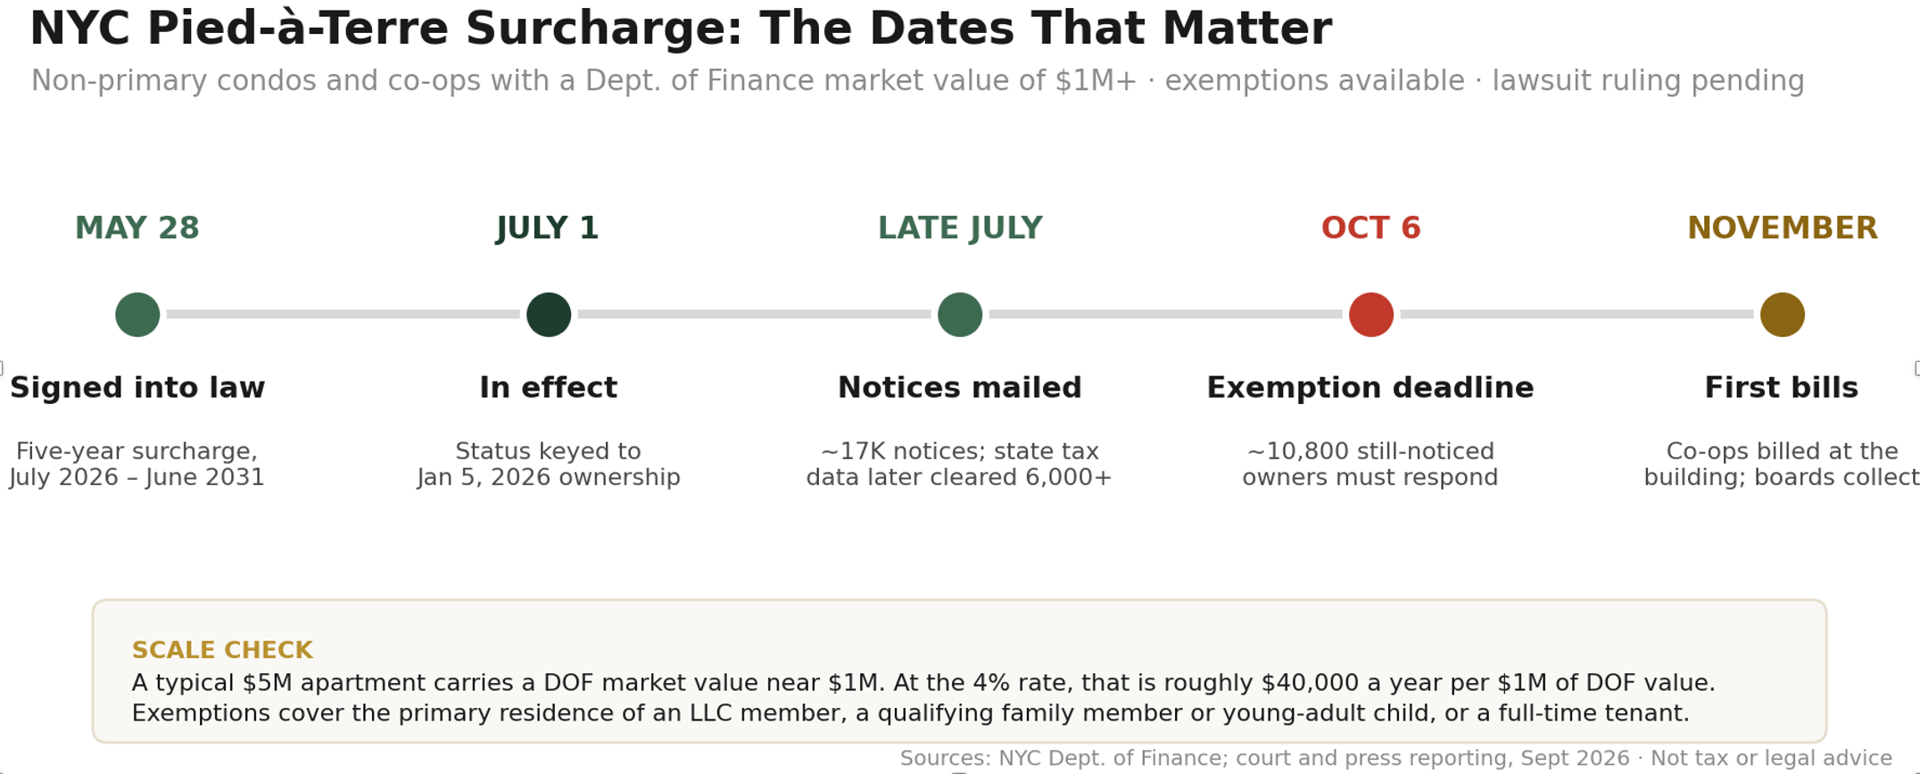
NYC's surcharge on non-primary residences has been in effect since July 1. It applies to condos and co-ops with a Department of Finance market value of $1 million or more that are not the owner's primary residence, at 4% of that DOF value. Scale check: a typical $5 million apartment carries a DOF market value near $1 million, so the surcharge runs roughly $40,000 a year per $1 million of DOF value.
Notices went out in late July; state tax data has since cleared more than 6,000 recipients, leaving about 10,800 apartments still asked to respond.
Three things owners should know. The exemption filing deadline is October 6, 2026. A lawsuit over the rollout is pending, but it contests how the city implemented the tax, not the tax itself, so owners who may qualify should file by October 6 regardless.
Exemptions exist: the property is the primary residence of an LLC member, a qualifying family member or young-adult child, or a full-time tenant. Nominal leases to friends fail the arm's-length test.
For Owners: If you received a notice, file for any exemption before October 6, with counsel and a tax professional. If you did not, confirm your status rather than assume it. Co-op owners: the building gets the bill and the board collects, so expect it in board correspondence this fall.
For Buyers and Investors: Underwrite the surcharge into any non-primary purchase from $1 million of DOF value. A unit with a full-time tenant is exempt; an empty pied-à-terre is not. The math tilts toward income-producing ownership, the same direction Brooklyn's yield corridor points.
This is market information, not tax or legal advice. Howard Hanna NYC can tell you what your apartment would rent for and sell for today; your advisors should drive the exemption decision.
The Brooklyn PPSF Story
Brooklyn's median PPSF has climbed from a post-crisis trough near $700/sf to a sustained $900-$1,100 range. August's $1,144 sits above that band even after the demand cooldown, consistent with the borough's re-rating as a primary destination rather than a Manhattan alternative. The record median, even mix-assisted, confirms the trajectory is intact.
Questions About This Month’s Market?
If you would like to chat about the most recent market activity,
feel free to contact us at [email protected] or connect with one of our Advisors.
About this report: The Brooklyn Real Estate Market Update is compiled monthly by Rihards Gederts, Howard Hanna NYC Research.
References
1. Sales and pricing data, Supply, Demand, PPSF, Listing Discount, Median Sale Price, Days on Market, Leverage Index inputs: UrbanDigs, August 2026 actuals.
2. Bedroom-level median sale price (Condo and Co-op): UrbanDigs Charts Room, 5-year monthly series, by closed date.
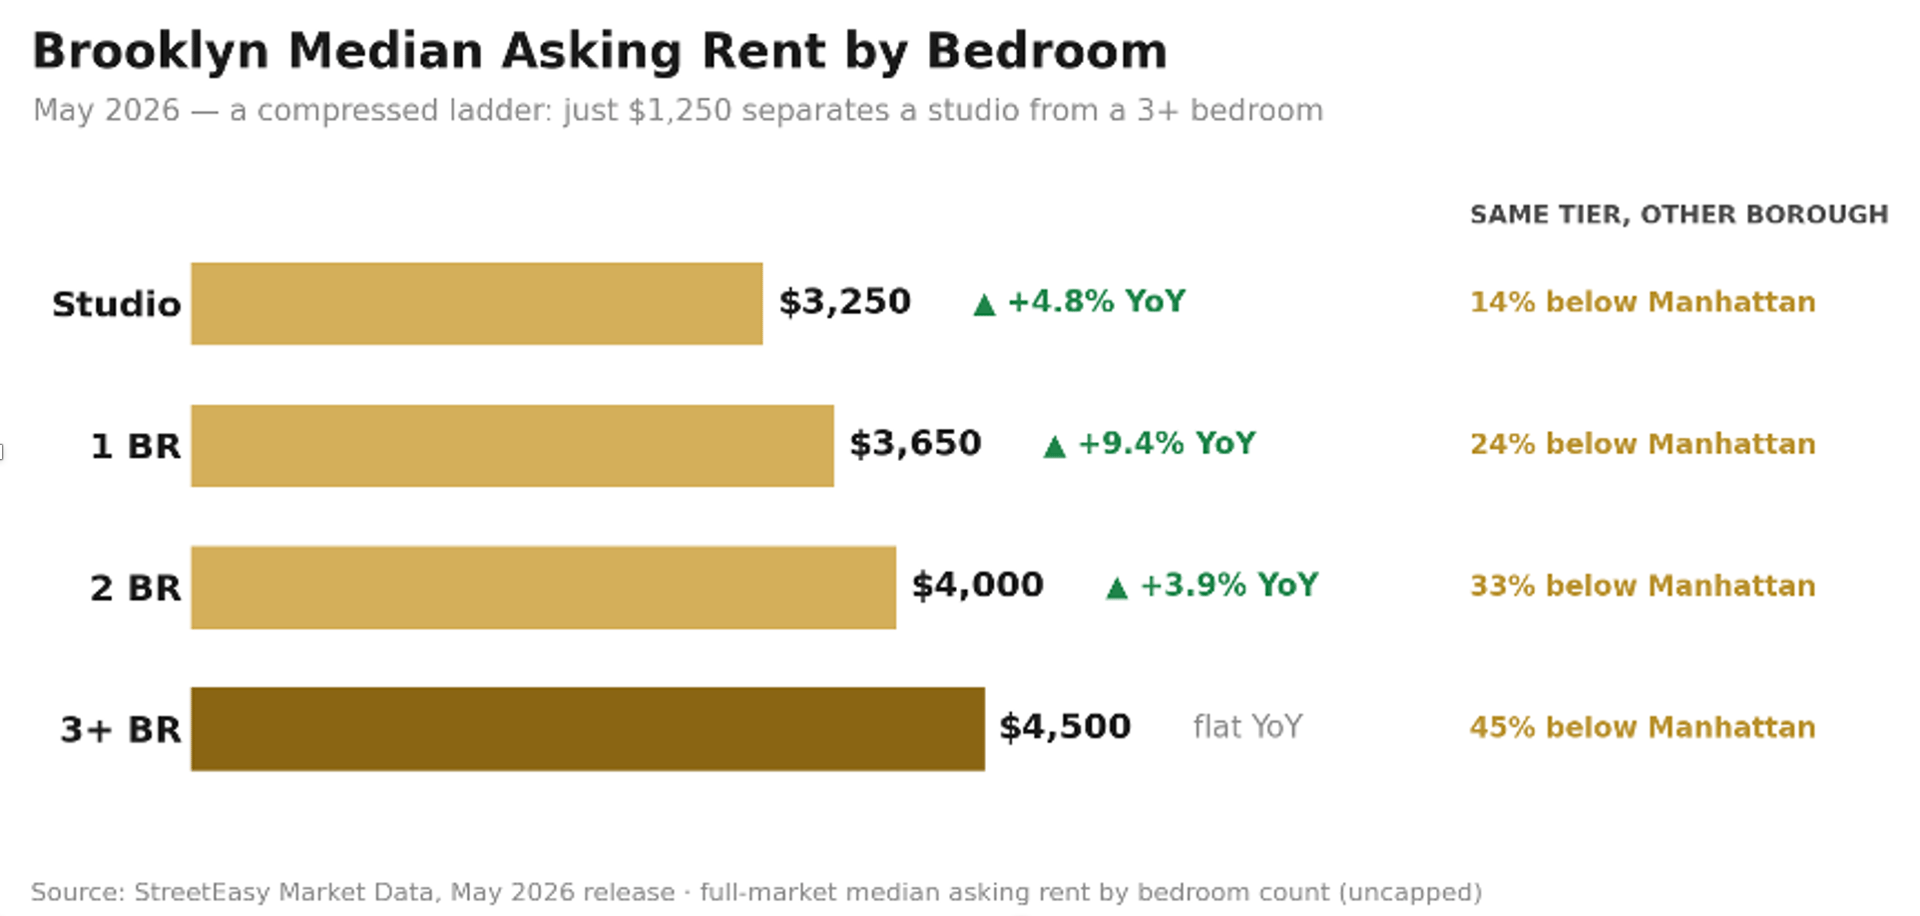
3. Rental data (asking rent, inventory, discount share, neighborhood table): StreetEasy Market Data, July 2026 release. Bedroom-level rent chart: May 2026 release.
4. Sales cross-check by neighborhood: StreetEasy Market Data, July 2026 release.
5. Mortgage rate data: Optimal Blue via Federal Reserve Bank of St. Louis (FRED); Howard Hanna NYC jumbo APR tracker (Bank of America, Chase, Wells Fargo), September 2, 2026.
https://www.federalreserve.gov/newsevents/pressreleases/monetary20260617a.htm6. Federal Reserve policy: Federal Reserve Board, FOMC statement, July 29, 2026. https://www.federalreserve.gov/newsevents/pressreleases/monetary20260729a.htm
7. Currency data: EUR/USD, GBP/USD, and U.S. Dollar Index market data, as of late July 2026.
8. Gross rental yield: annualized StreetEasy median asking rent ÷ median asking price, by neighborhood, July 2026 release. Screening measure; thin submarkets excluded (see chart footnote).
9. Leverage Index: Howard Hanna NYC Leverage Index 2026; inputs courtesy of UrbanDigs.
10. Consumer sentiment: University of Michigan Surveys of Consumers, August 2026 final; history via FRED (UMCSENT).
11. Average rent history: Jonathan Miller average rent series, July 2026, compiled by Howard Hanna NYC Research.
12. Pied-à-terre surcharge: NYC Department of Finance non-primary residence surcharge notices and guidance; court and press reporting, September 2026. Not tax or legal advice.
13. Treasury yields: U.S. Department of the Treasury, Daily Treasury Par Yield Curve Rates (home.treasury.gov), 2024 to September 2, 2026.
Howard Hanna NYC brings the nation’s largest independent and family-owned brokerage to New York City, uniting the strength of a national network with the insight and sophistication of a local firm. Formed through joining forces with Elegran Real Estate, Howard Hanna NYC delivers a seamless, full-service experience backed by more than 15,000 agents across 500 offices in 14 states. The firm’s forward-thinking, agent-first culture continues to shape the future of real estate across Manhattan and the Tri-State area. Learn more at www.howardhannanyc.com.