Manhattan Market Pulse ¹ September 2026
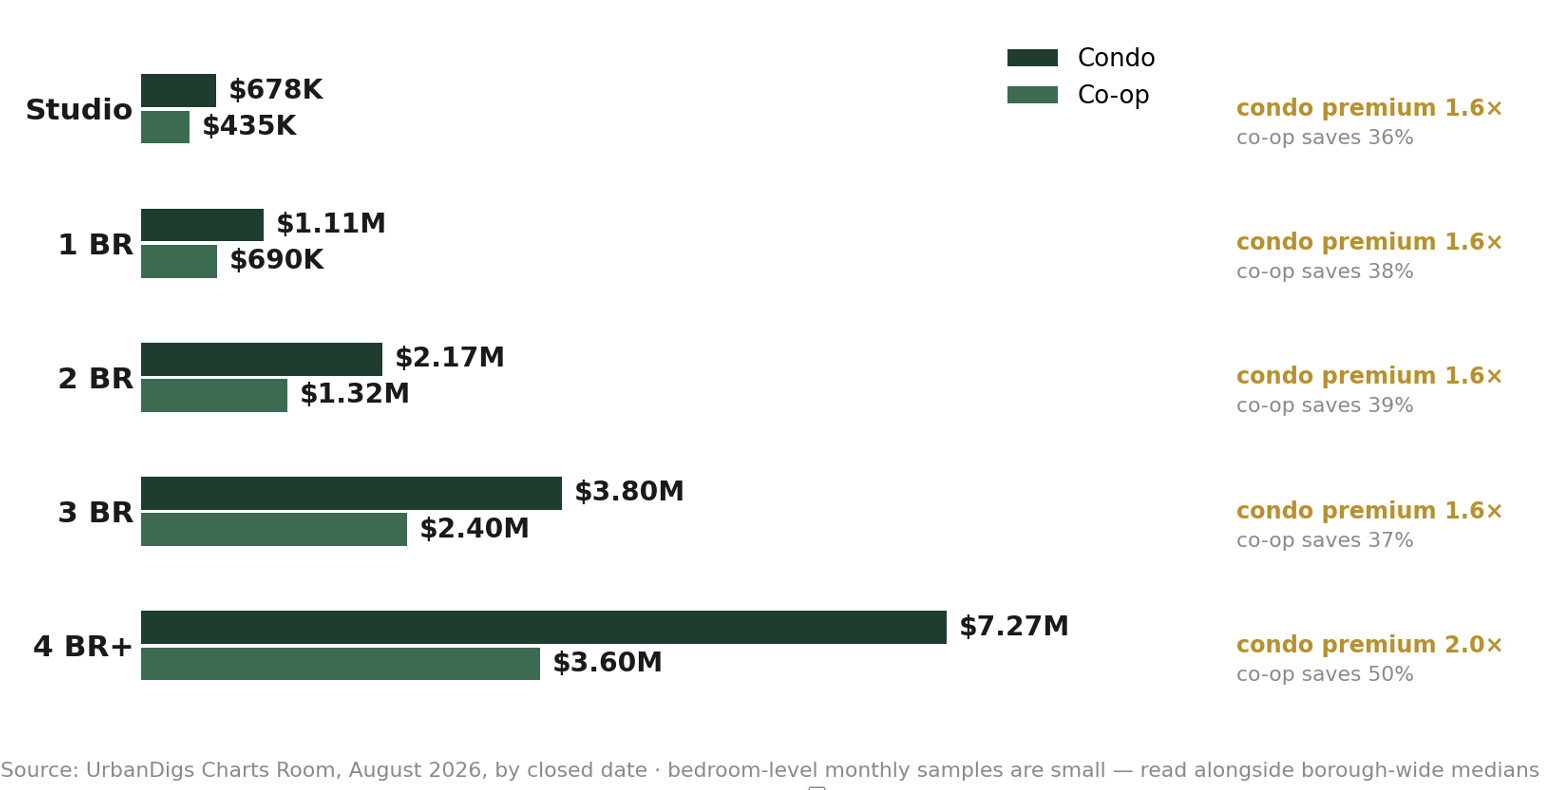
MEDIAN SALE PRICE BY BEDROOM — ALL MANHATTAN (AUGUST, BY CLOSED DATE)
Scarcity Deepens: Supply Hits a 2026 Low as August Goes Quiet
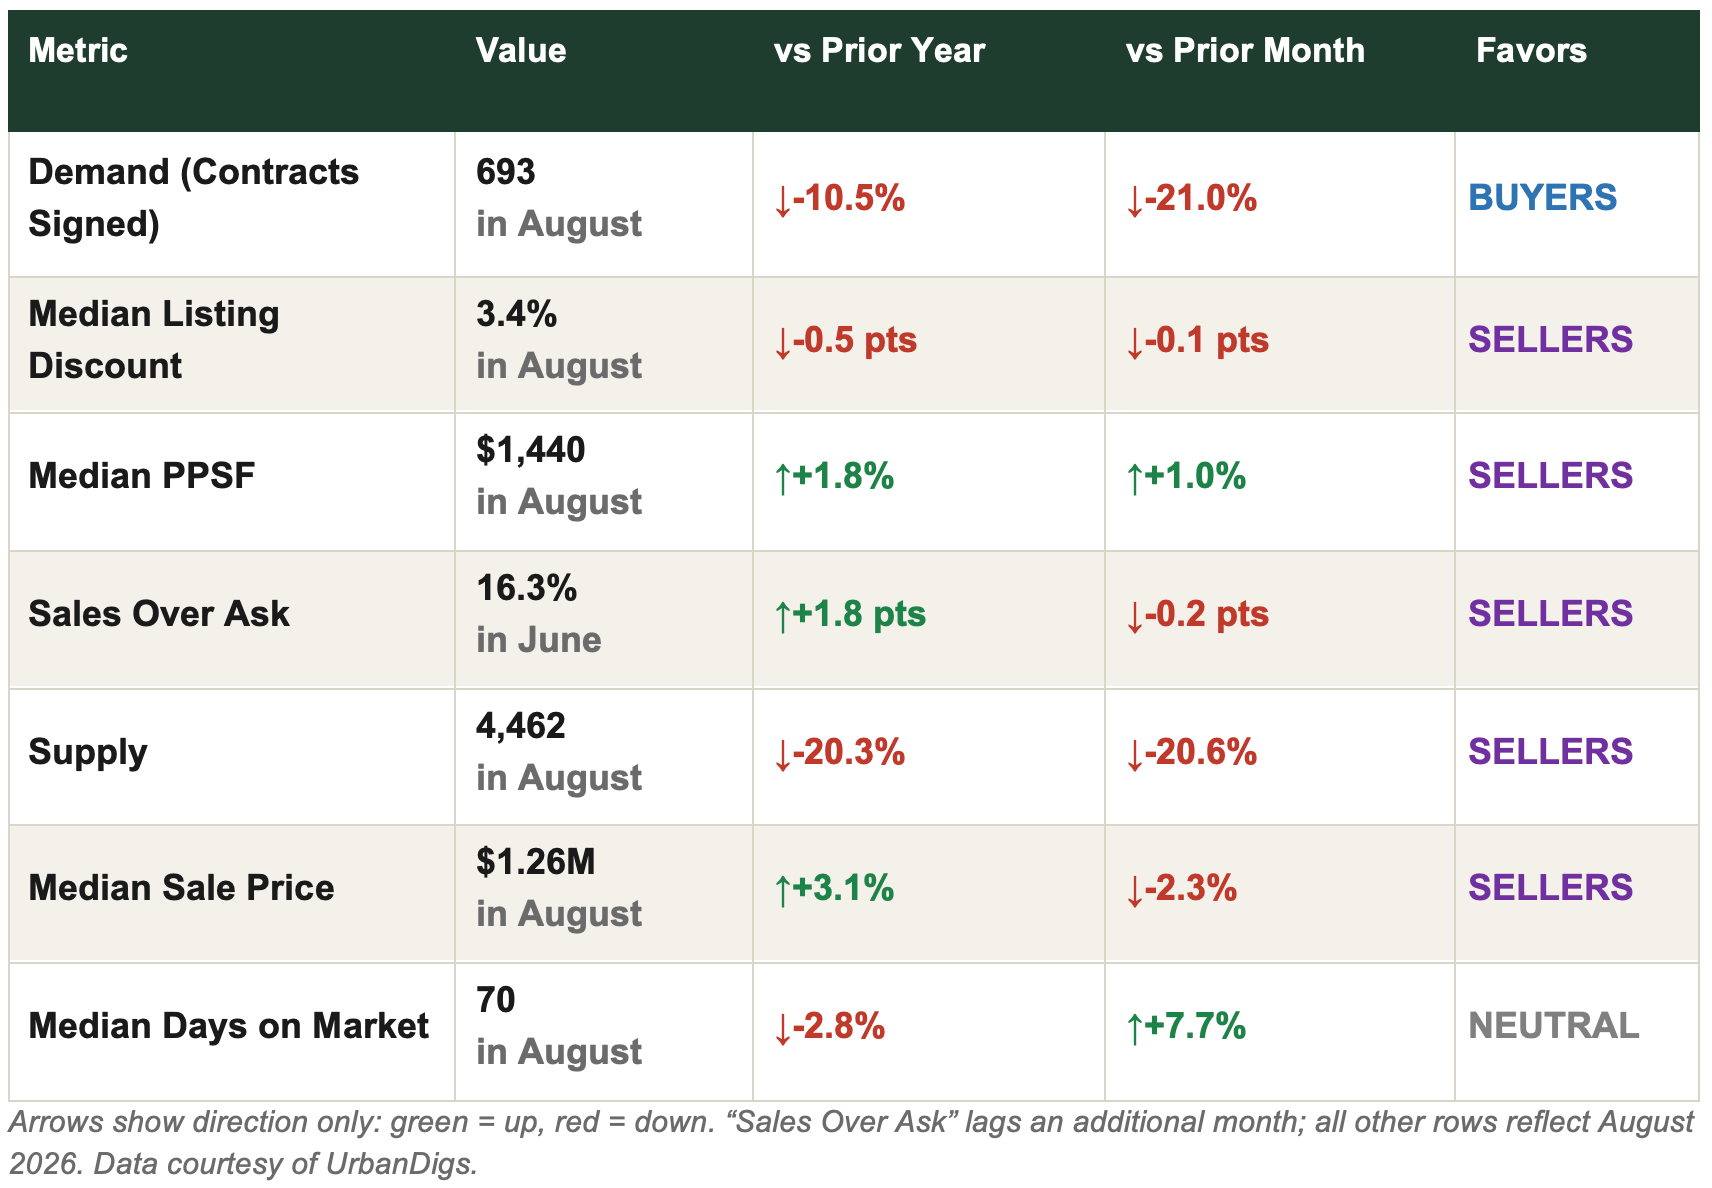
August was the deepest supply drought of the year. Active listings fell 20.6% from July to 4,462, 20.3% below last August; new listings dropped 40% to 526 and the market lost a net 1,191 homes. Demand paused with the season: 693 contracts, down 21% on the month and 10.5% on the year, while pending sales of 3,203 still run 9.3% ahead of 2025. Pricing held. The median came in at $1.26M, up 3.1% year over year, PPSF edged up to $1,440, and the listing discount tightened to 3.4%, the lowest of 2026.
Bottom line: both sides stepped back in August, but sellers stepped back harder. A 20% supply deficit keeps price with sellers; 70 days on market gives buyers time. September's listing wave decides whether scarcity carries into the fall.
Market Snapshot: Five Numbers That Matter
• 693 contracts signed in August, down 21% from July and 10.5% year over year. Pending sales of 3,203 still run 9.3% ahead.
• 4,462 active listings, down 20.3% year over year after the sharpest monthly drop of 2026. New listings fell 40% to 526.
• $1.26M median sale price, up 3.1% year over year, off July's 2026 high.
• $1,440 median PPSF, up 1.8% year over year and within 3% of the 2026 high.
• 16.3% of June sales closed above ask, up 1.8 points year over year.
Key Takeaways
• Scarcity is the story: a net 1,191 homes left the market in August and new listings fell 40%. Sellers withdrew faster than buyers paused.
• The listing discount tightened to 3.4%, the least negotiating room of 2026, even in the slow season.
• By bedroom: condo 2BRs held firm at $2.18M (+3.4% YoY); condo 3BRs (-5.7%) and large co-ops (4BR+ -14.4%) are the soft corner.
• Days on market stretched to 70, up 7.7% from July but still below last year. Recorded closings (623) reflect recording lag, not a halt in activity.
Outlook
Manhattan enters September with scarcity doing the work: a 20% supply deficit, a pipeline ahead of last year, and pricing near 2026 highs. If the September listing wave arrives light, sellers keep their leverage into the fall; a heavy wave hands buyers their first real selection in months.
For Sellers: List early into the September wave, priced to the 3.4% discount, and you meet the thinnest competition of the year.
For Buyers: The quiet window is closing. With 70 days on market and 450 August price cuts, target listings that sat through the summer; that is where negotiating room lives.
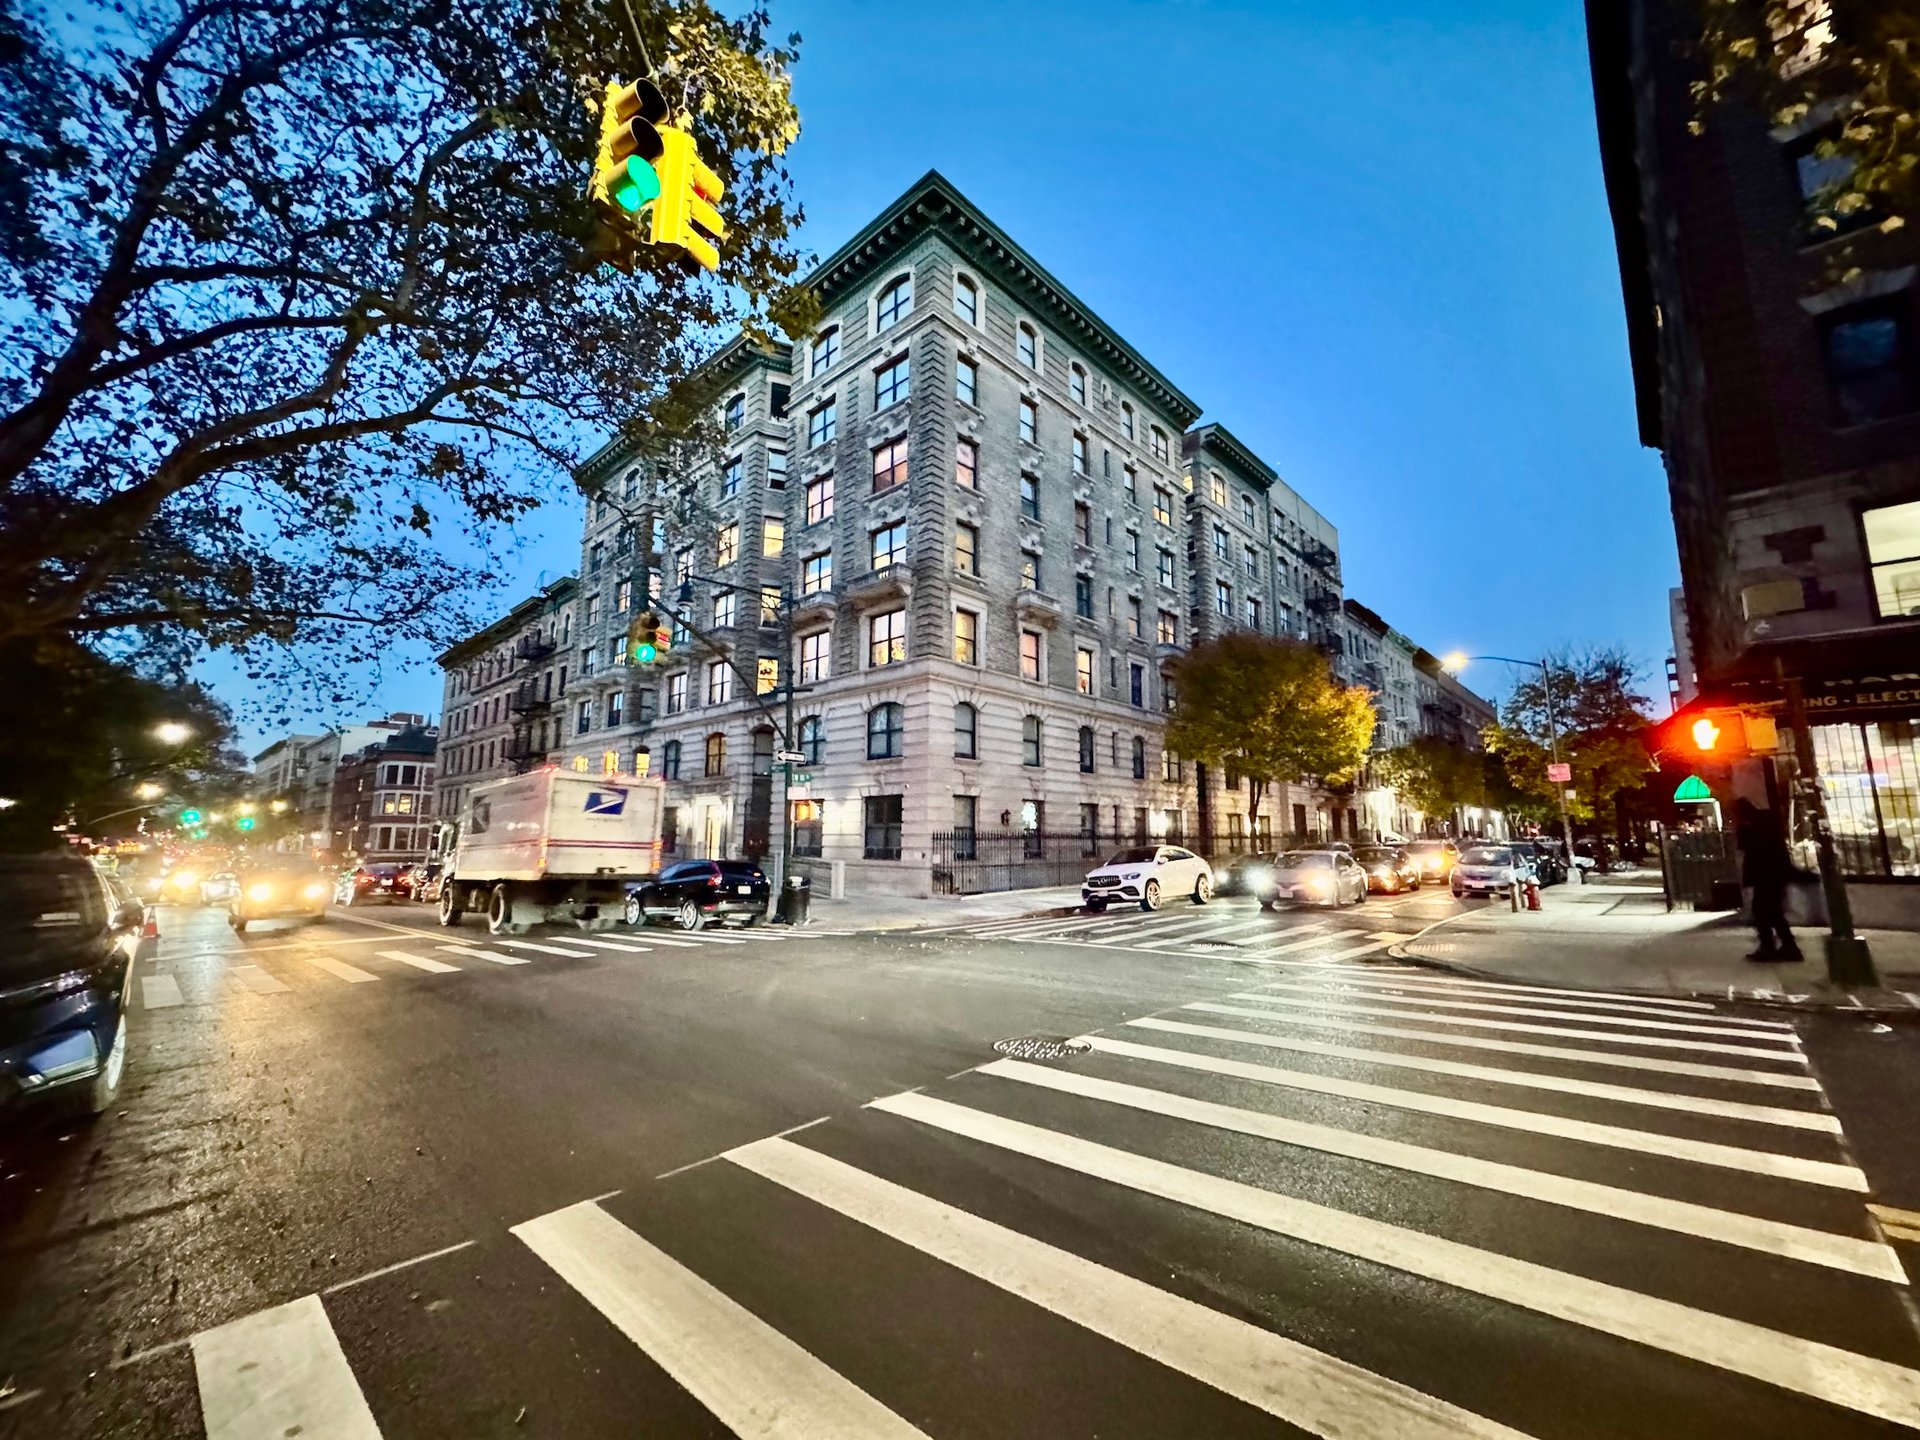
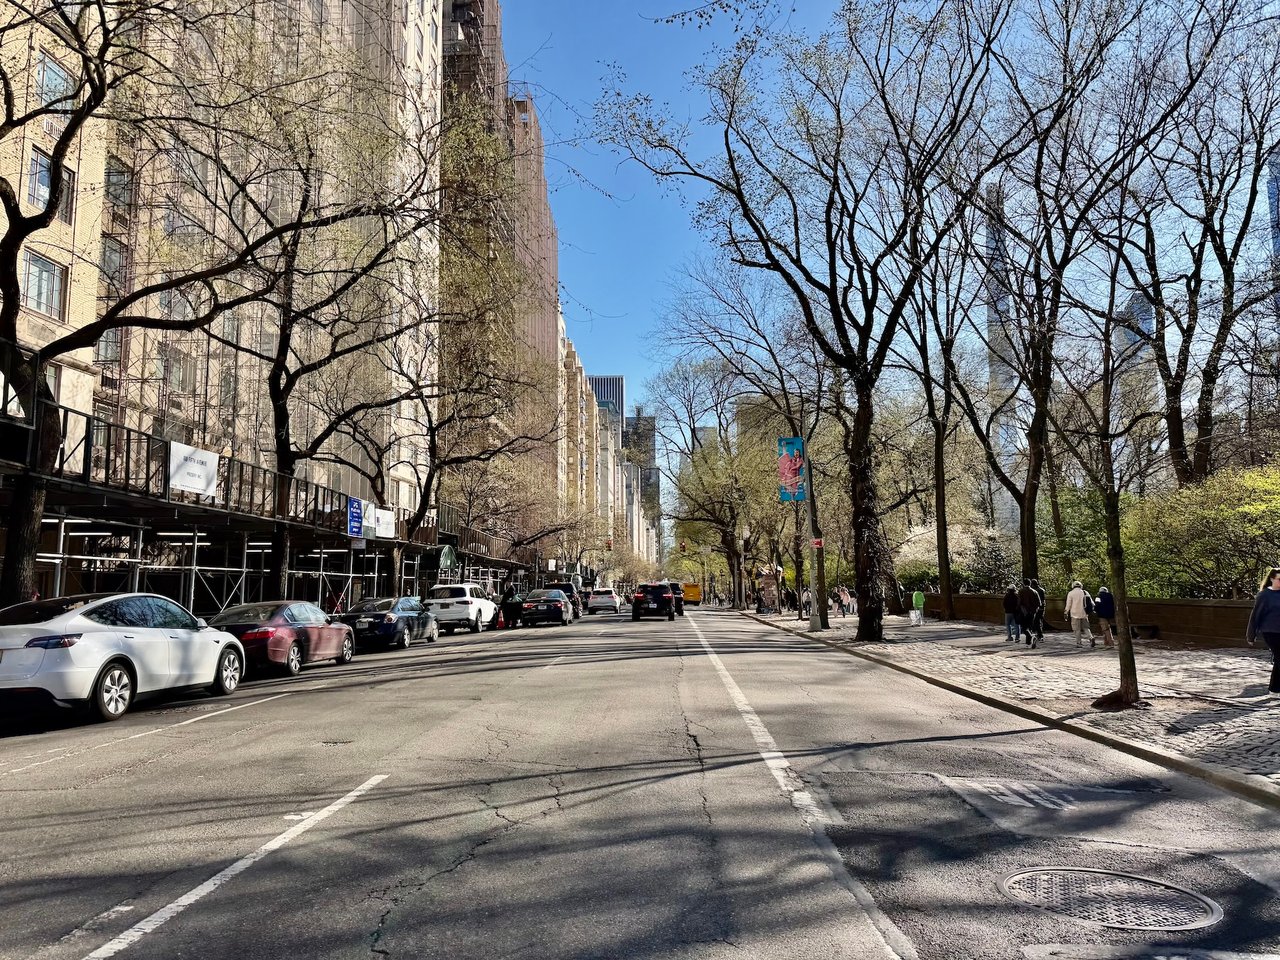
Photo by Rihards Gederts | Howard Hanna NYC
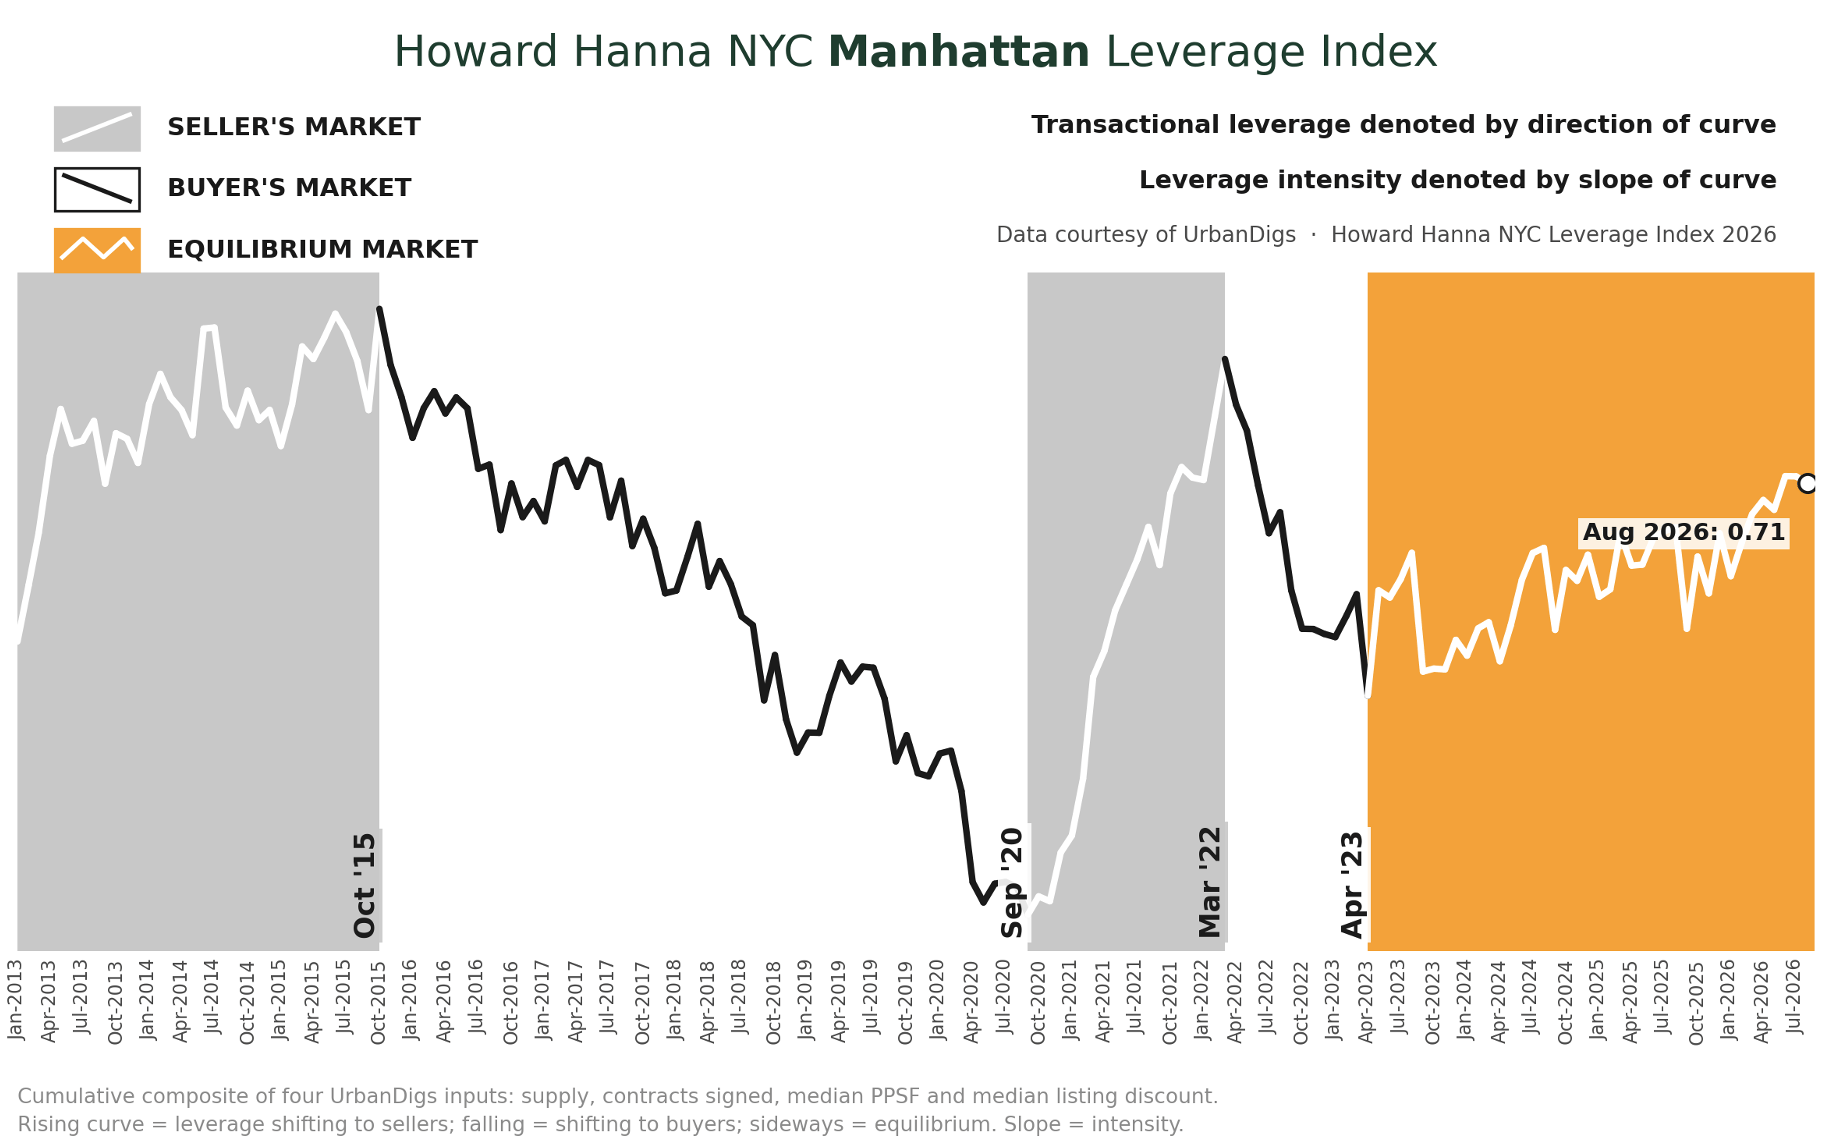
Howard Hanna NYC Manhattan Leverage Index
The Howard Hanna NYC Manhattan Leverage Index blends four signals, supply, demand, median PPSF and listing discount, into one reading of who holds the leverage. Tightening supply, rising demand, firming PPSF and shrinking discounts point to sellers; the reverse points to buyers.
The index read 0.71 in August, from 0.74 in July and June's 0.75, the 2026 high. The number barely moved; the engine changed. Supply swung from a slight drag to the strongest seller-side push of the year as listings fell 20.6%, while demand flipped negative as contracts dropped 10.5% below last August. PPSF and a 3.4% discount kept the balance with sellers.
August is the third-highest reading since the equilibrium era began in April 2023, and the index has more than doubled since January's 0.29: seller-leaning, carried by scarcity rather than buyer urgency. Source: Howard Hanna NYC Leverage Index 2026, data courtesy of UrbanDigs.
Manhattan Supply
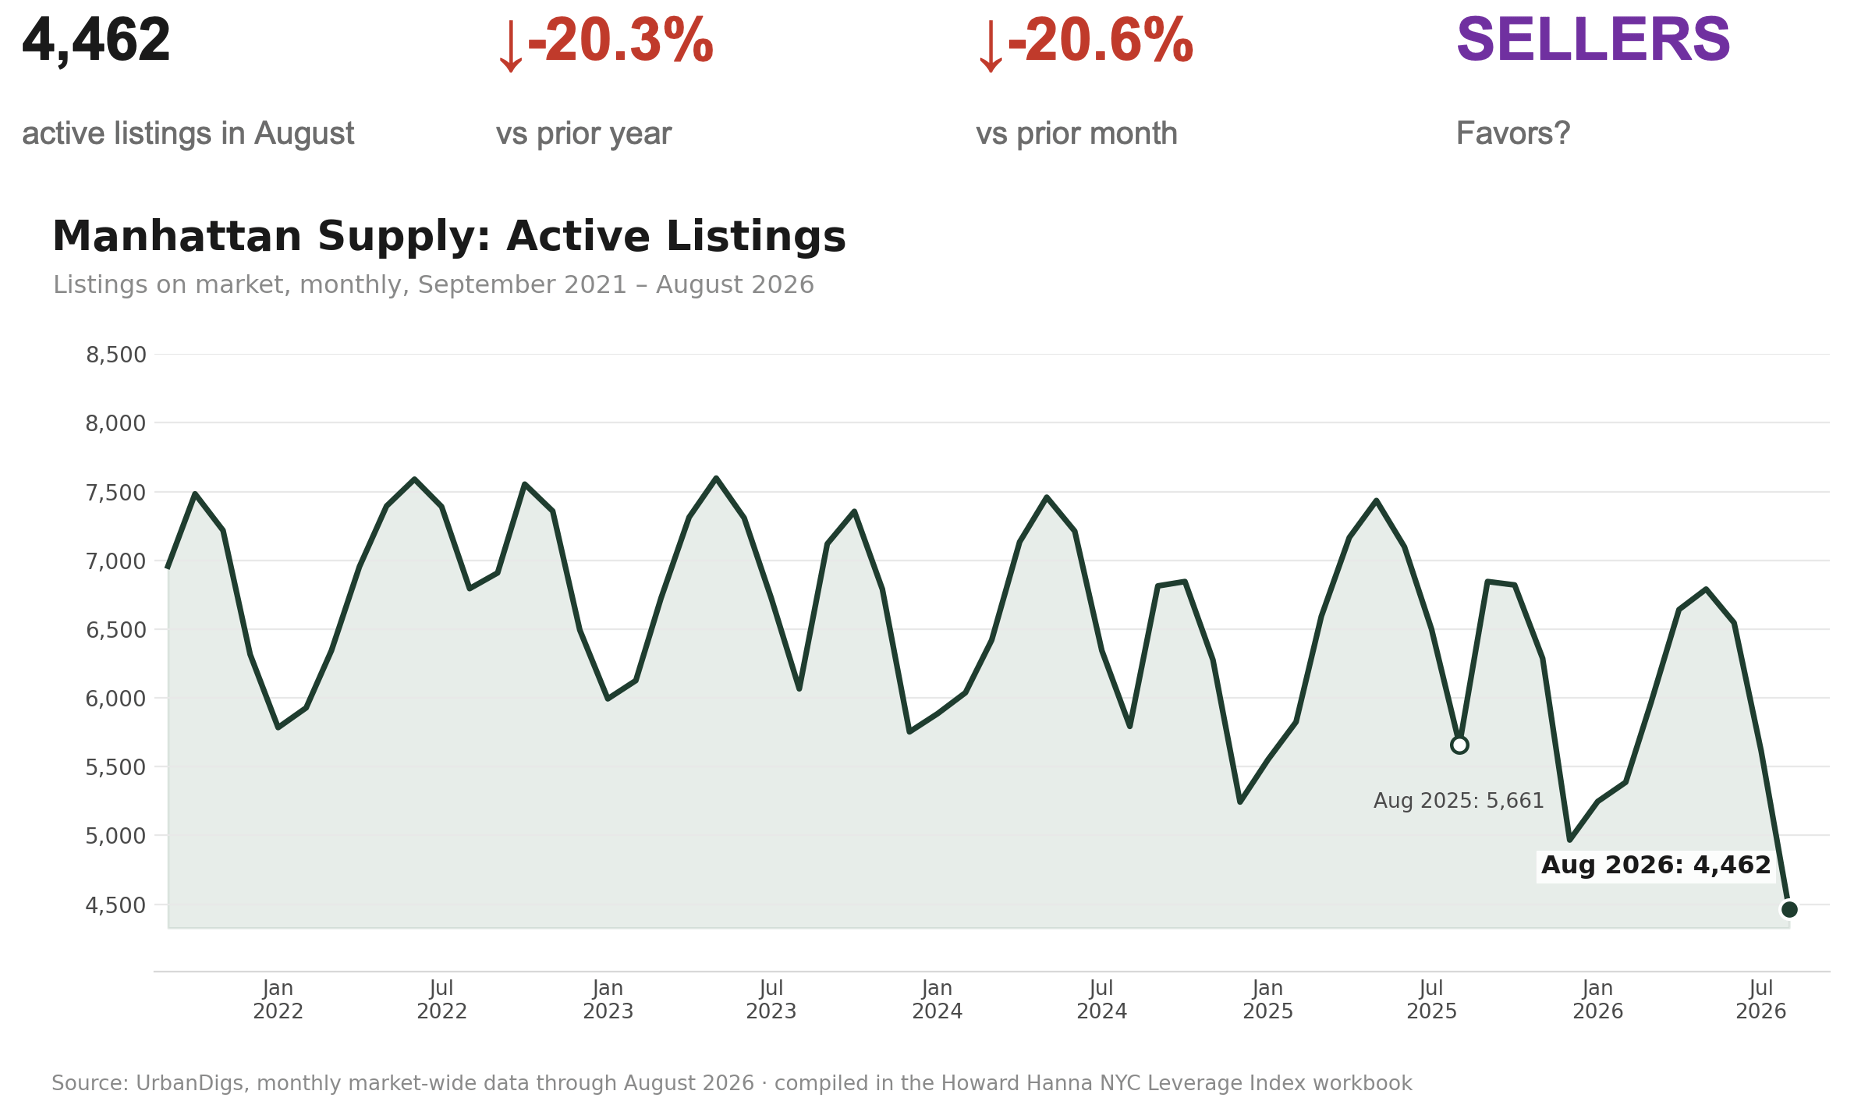
SUPPLY CRATERS: THE DEFICIT WIDENS TO 20%
Active listings fell to 4,462 in August, down 20.6% from July and 20.3% below last August, the sharpest monthly contraction of 2026 and the lowest level in years. New listings all but stopped at 526, and the market lost a net 1,191 homes.
Buyers: Selection is the thinnest of the year. When a well-priced listing appears, competition finds it fast: 16.3% of June sales closed above ask.
Sellers: A listing priced accurately today faces the least competition of 2026.
Outlook: If the September wave arrives light, the 20% deficit carries into the fall and keeps the floor under prices.
Manhattan Demand
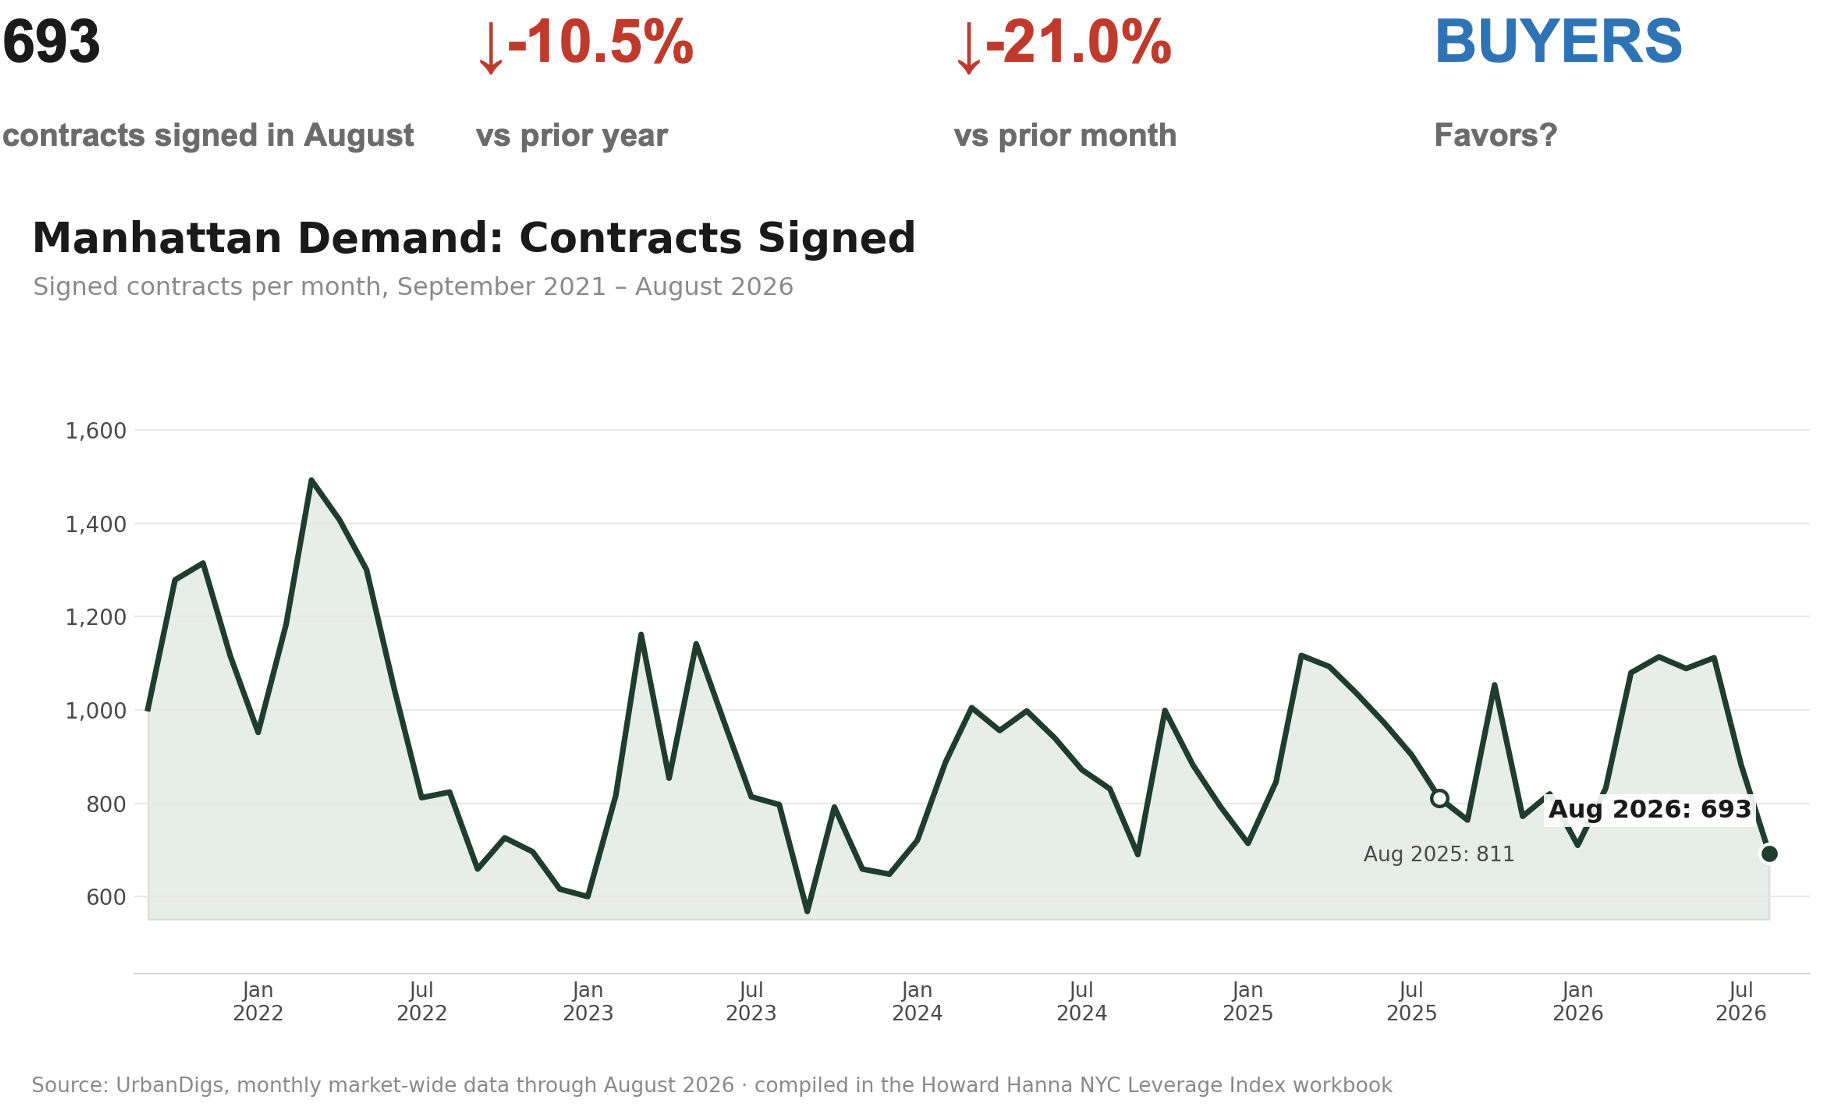
CONTRACTS DOWNSHIFT TO THE SEASONAL LOW
August brought 693 signed contracts, down 21% from July and 10.5% below last August: the late-summer pause, on schedule. The pipeline held: pending sales of 3,203 run 9.3% above last year.
Buyers: Sellers who listed in August are motivated sellers. Engage them before the fall crowd returns.
Sellers: A softer August buyer pool against a 20% supply deficit still favors you. Price to the data, not to the quiet.
Outlook: Activity should re-accelerate after Labor Day; a pipeline 9.3% ahead of last year points to a firm start to fall.
Manhattan Median PPSF
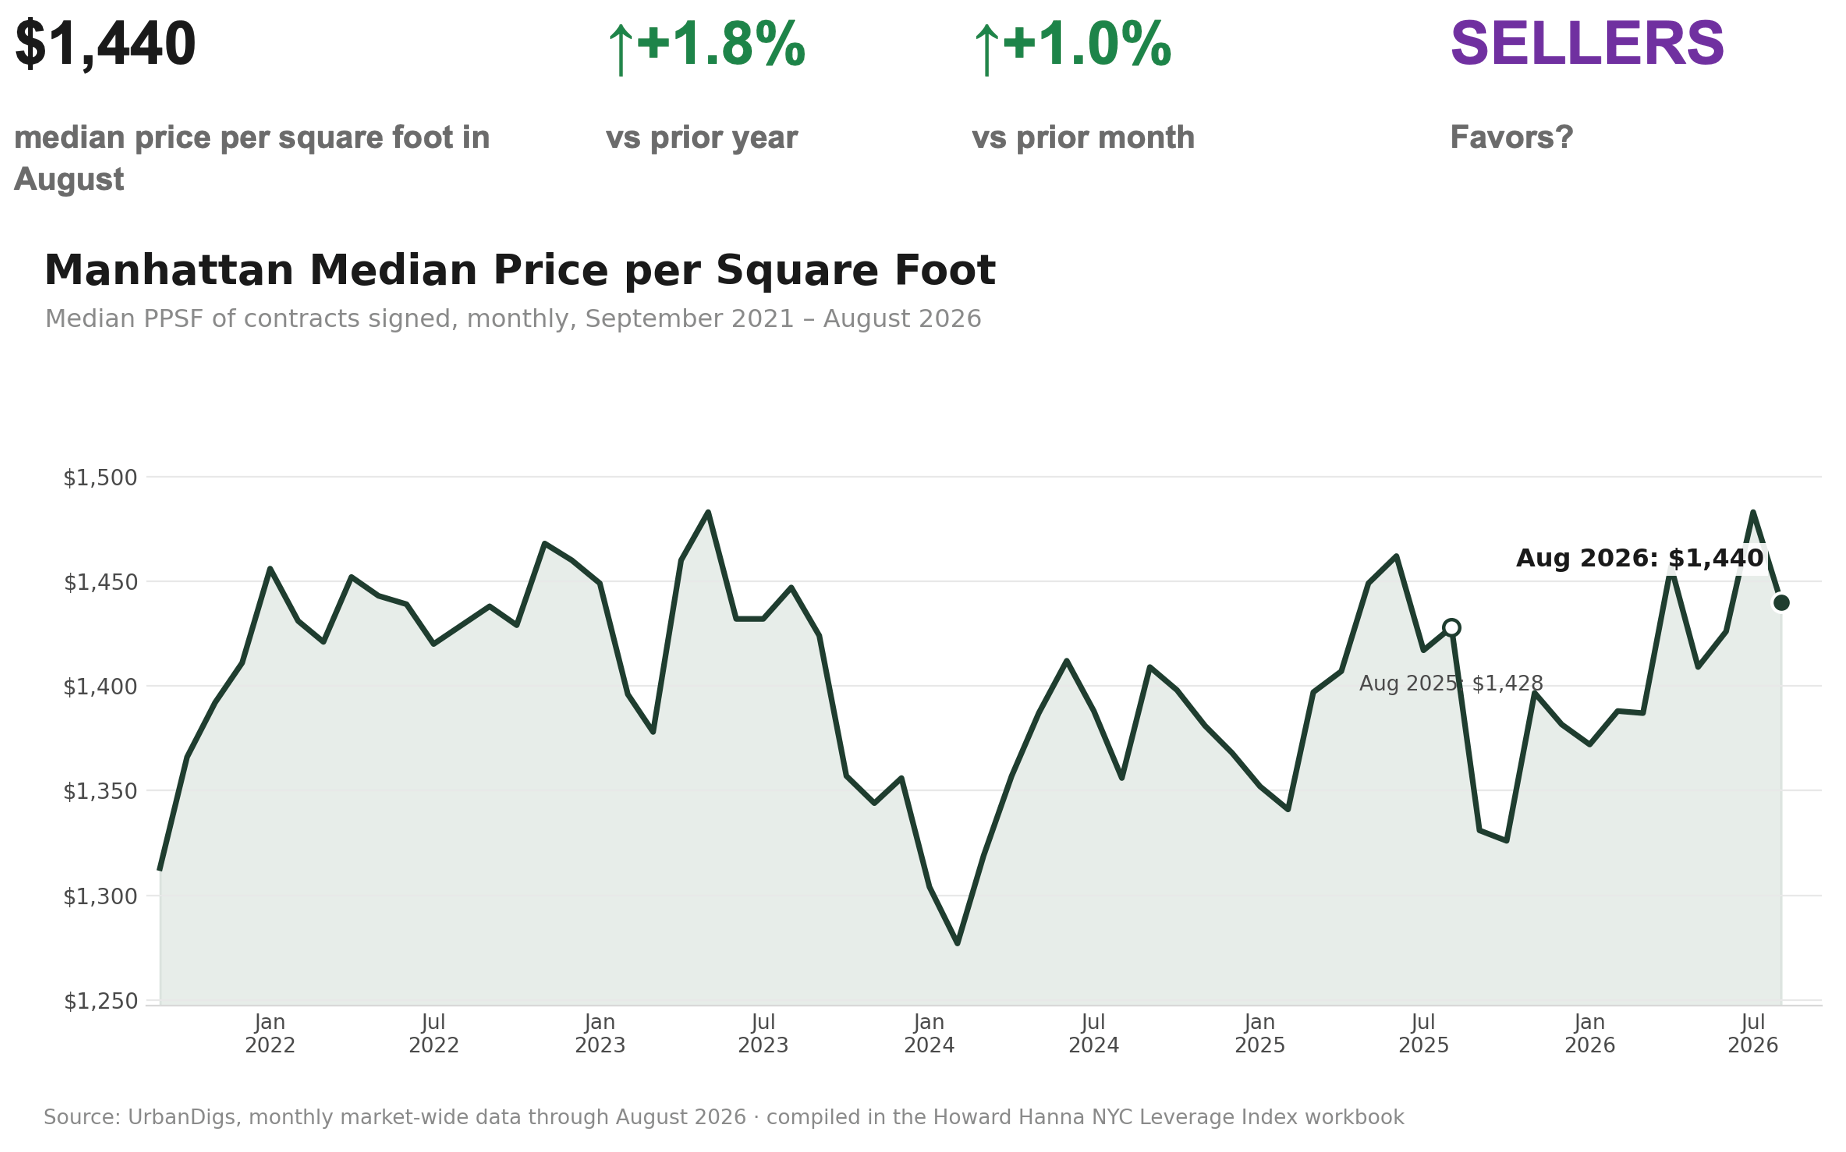
PER-FOOT PRICING HOLDS NEAR 2026 HIGHS
Median PPSF came in at $1,440 in August, up 1.0% from July and 1.8% year over year. July's $1,483 eased on thin late-summer volume, but per-foot pricing sits within 3% of its 2026 high with supply still shrinking.
Buyers: Headline pricing is not softening. Real negotiating room is concentrated in larger co-ops, the one segment still below last year.
Sellers: Pricing power held through the quietest month of the year. Comparable-based pricing can stay confident into the fall.
Outlook: $1,425 to $1,485 looks sustainable through Q3. The September listing wave is the variable to watch.
Manhattan Median Listing Discount
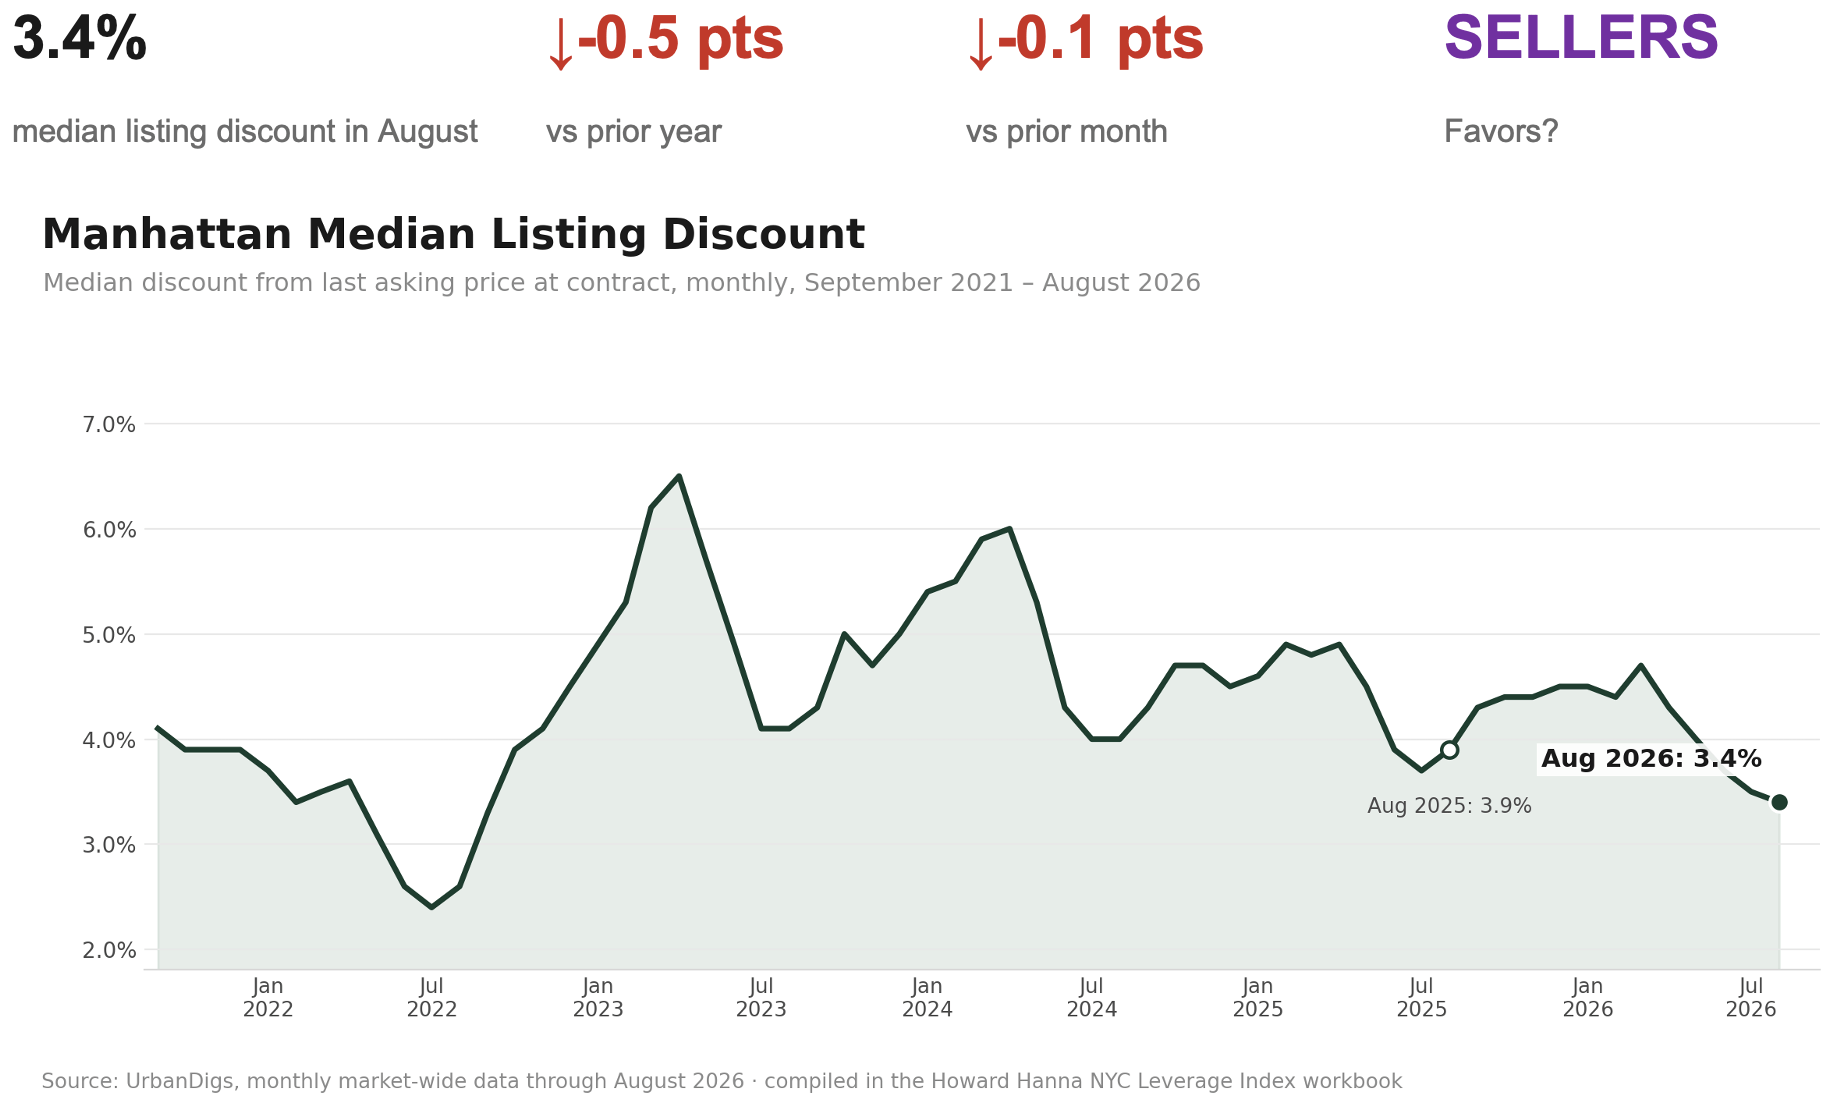
NEGOTIATING ROOM TIGHTENS TO THE LOWEST OF 2026
The median listing discount tightened to 3.4% in August, a tenth below July and half a point below last August. On a $1.5M listing, that is about $51,000 off ask, the least of the year.
Buyers: Bring a clean offer on well-priced listings. Save the deep discount for inventory that sat through the summer, where the 120-day-plus median runs 9%.
Sellers: Accurately priced listings are converting near ask, and a meaningful share above it.
Outlook: With supply down 20%, the discount should hold in the mid-3% range into the fall. Only a heavy September wave widens it.
Rental Remarks
ASKING RENTS AT $4,995: GROWTH HOLDS AT +5.2% AS PRICE CUTS SPREAD
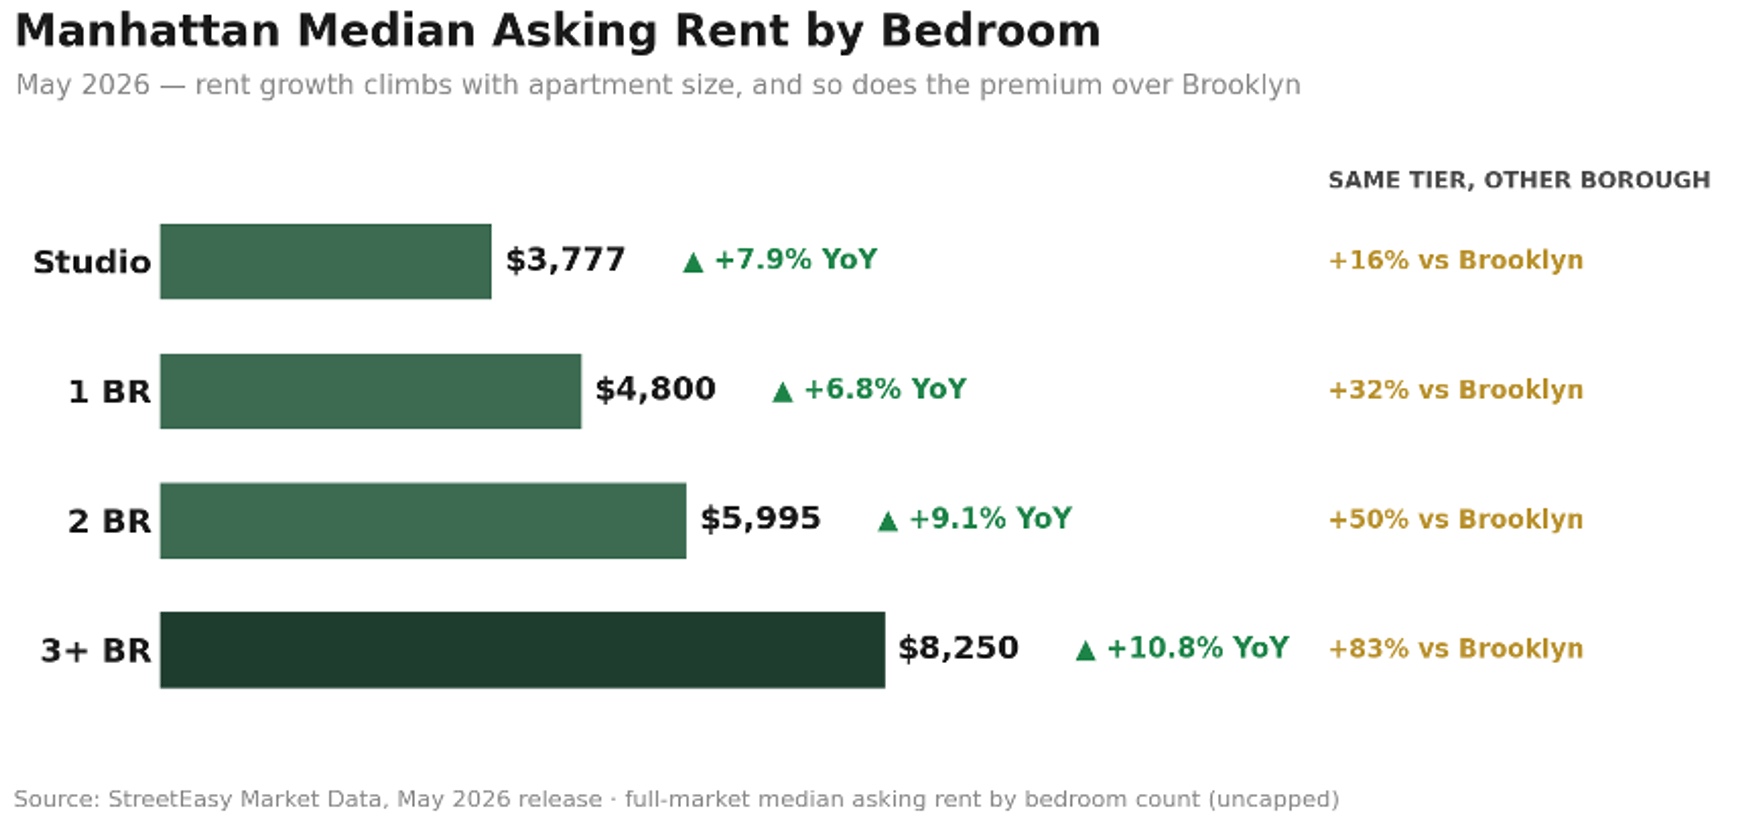
Manhattan's median asking rent reached $4,995 in July, up 0.6% from June and 5.2% year over year, a hair under the $5,000 line. Two things changed underneath. Inventory rose 3.0% to 17,026 listings but still sits 8.1% below last July. And the share of listings cutting price jumped from 14.0% to 17.2%, the highest of 2026 though under last July's 19.1%. Landlords are defending record rents, and more of them are blinking to do it.
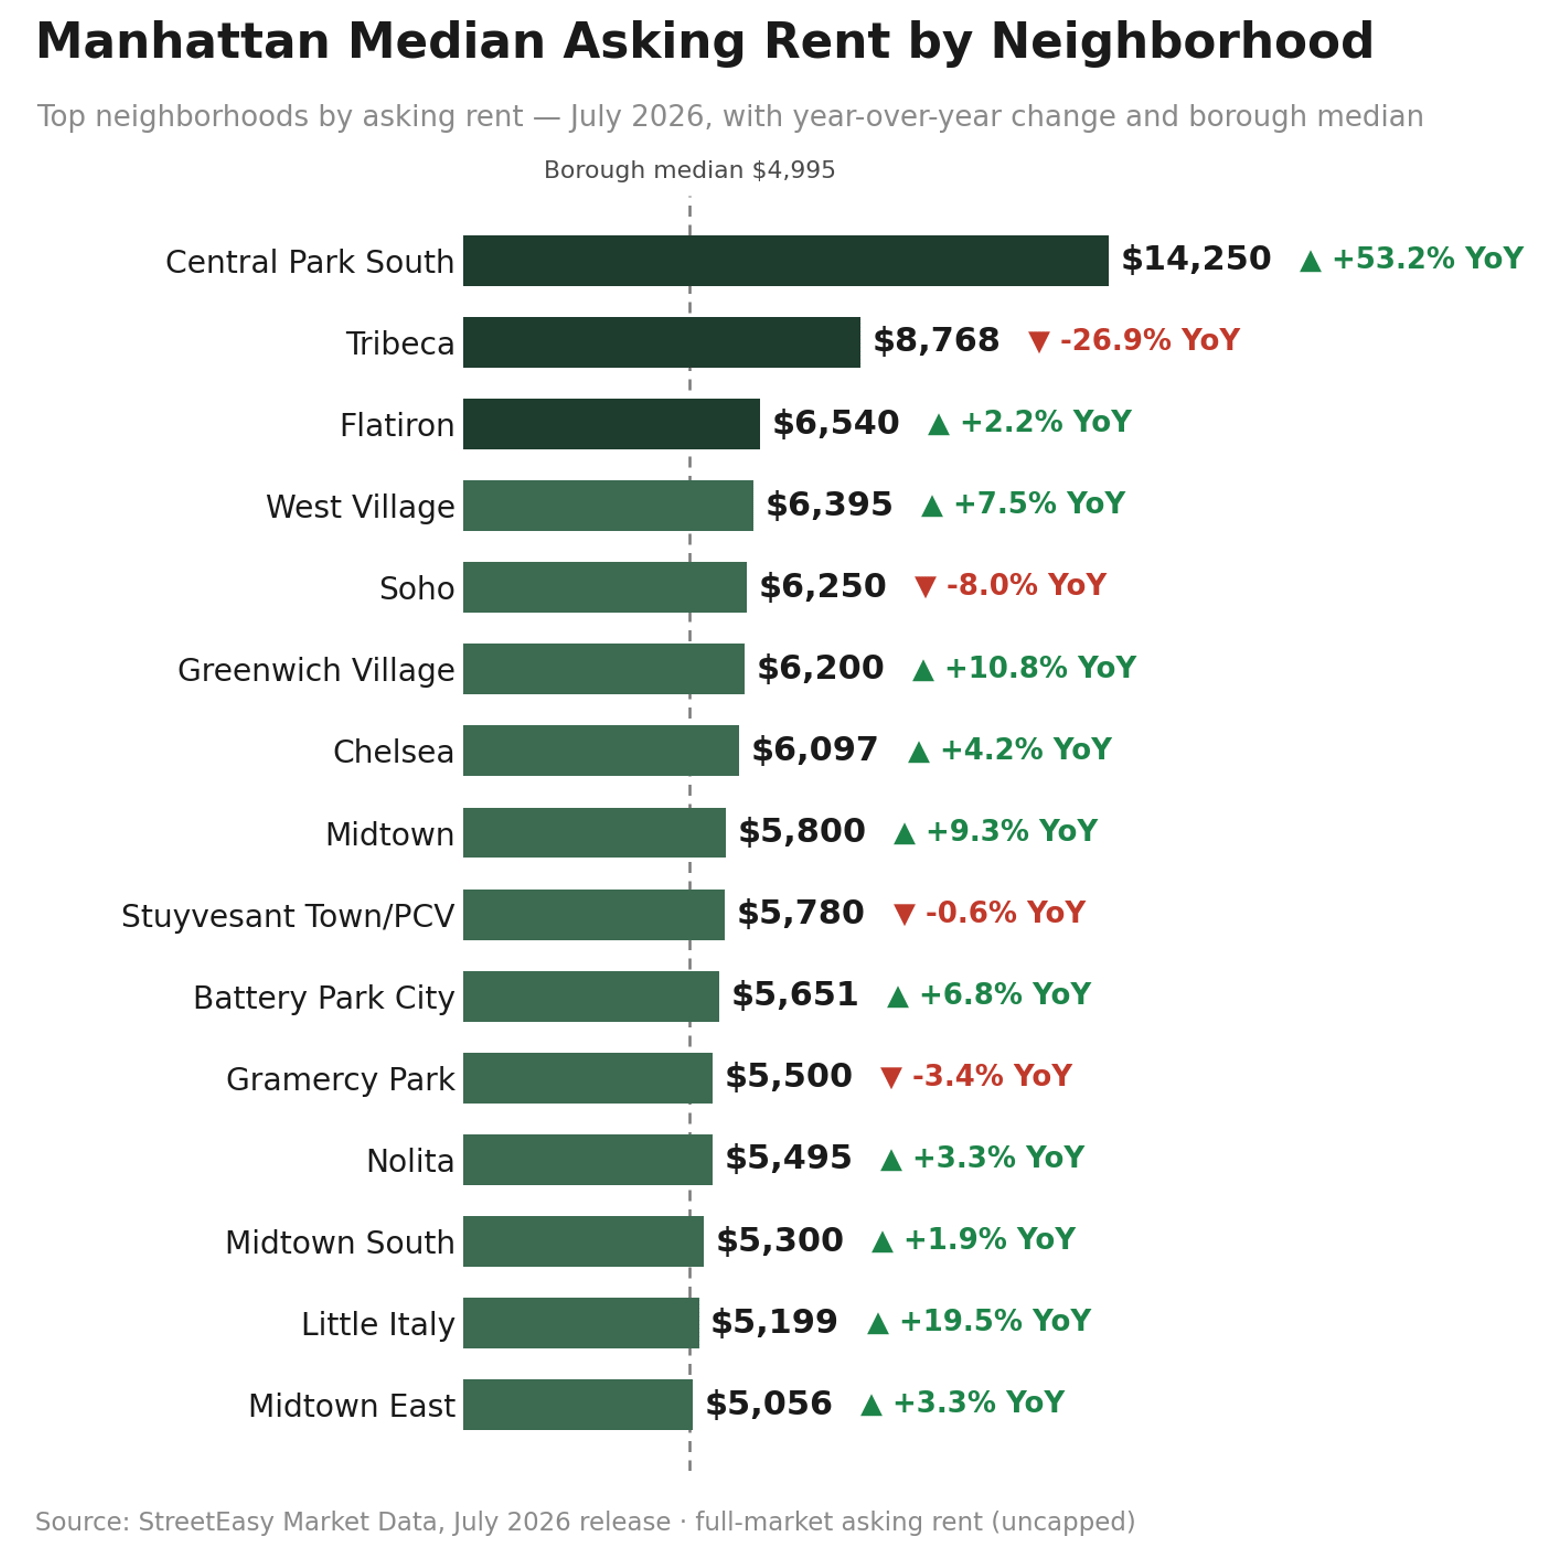
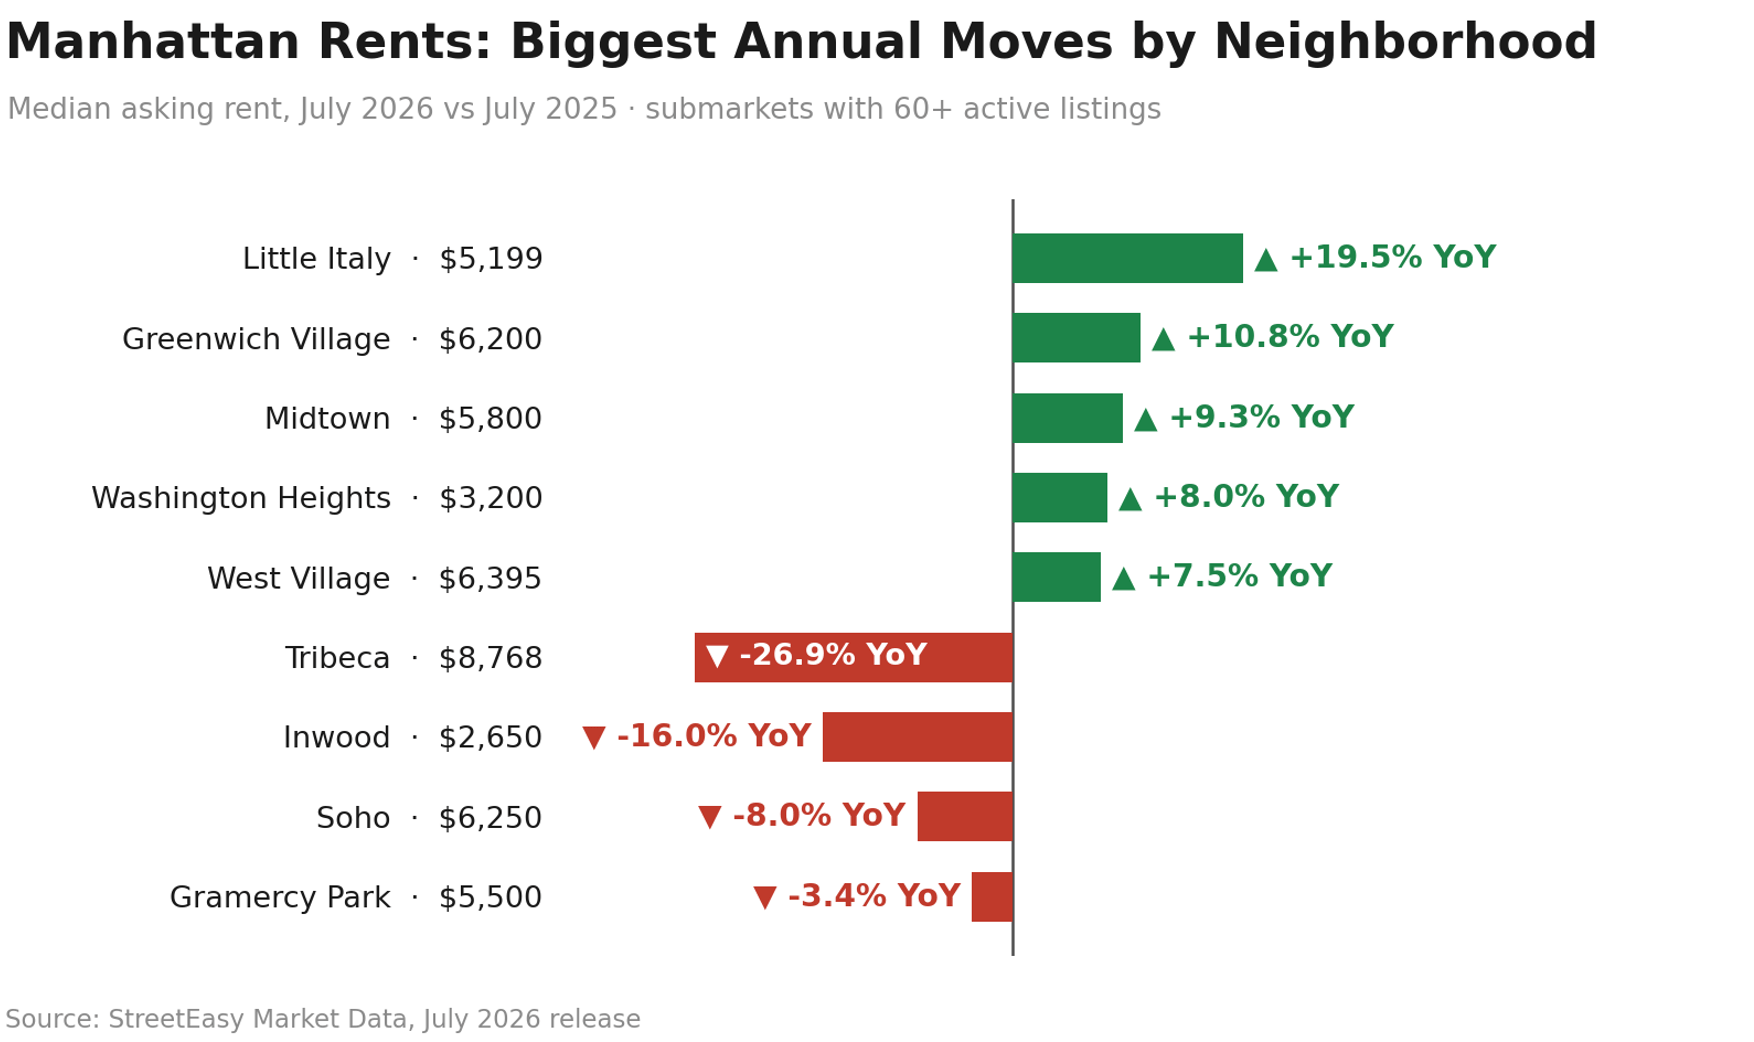
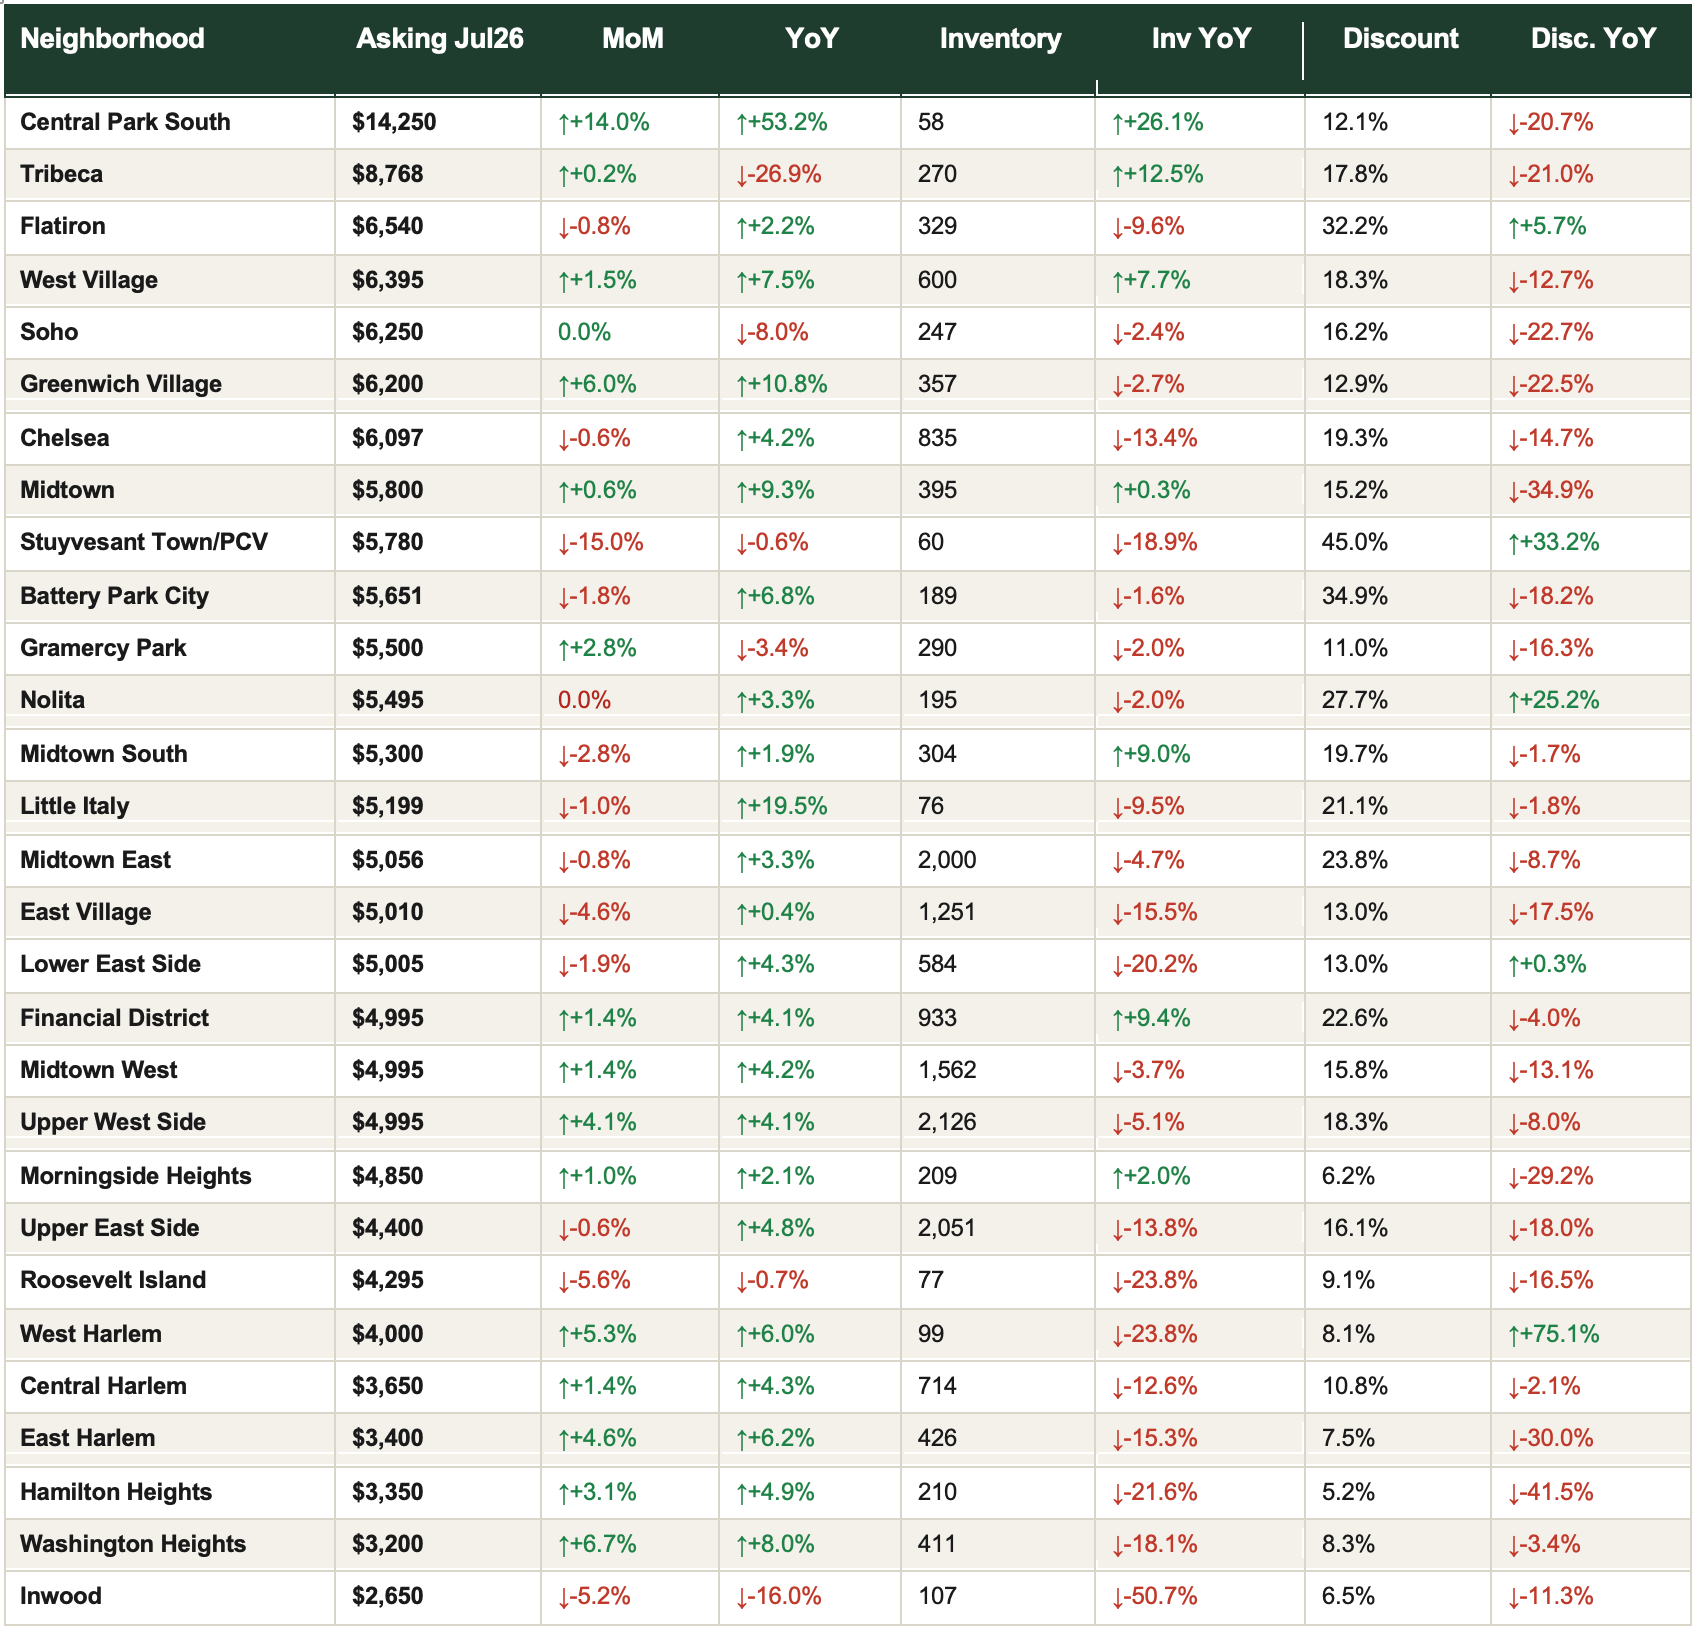
Central Park South leads at $14,250, up 53.2% on a thin ultra-luxury market of about 58 listings. The micro-markets tell the real story: Little Italy (+19.5%) and Greenwich Village (+10.8%) lead the gainers, and Washington Heights keeps climbing on yield-driven demand, +8.0% to $3,200. Tribeca has repriced hard, down 26.9% to $8,768, with Inwood (-16.0%) and Soho (-8.0%) also giving ground.
A DECADE OF RENTS: RECORDS, AGAIN
Zoom out and the story sharpens. Jonathan Miller's average-rent series, compiled by Howard Hanna NYC Research, puts Manhattan's average rent at $6,306 in July, up 14.7% year over year, with six record highs in seven months. Brooklyn's average hit $4,871, up 13.6%, a record six months running.
From the April 2021 trough of $3,650, Manhattan is up 73% in five years. Averages run above StreetEasy's medians because they carry the luxury tail, which is where 2026's growth sits. The math for renters: the average Manhattan apartment now costs about $75,700 a year. At ~7% jumbo rates, that is the buy-versus-rent lever at record leverage.
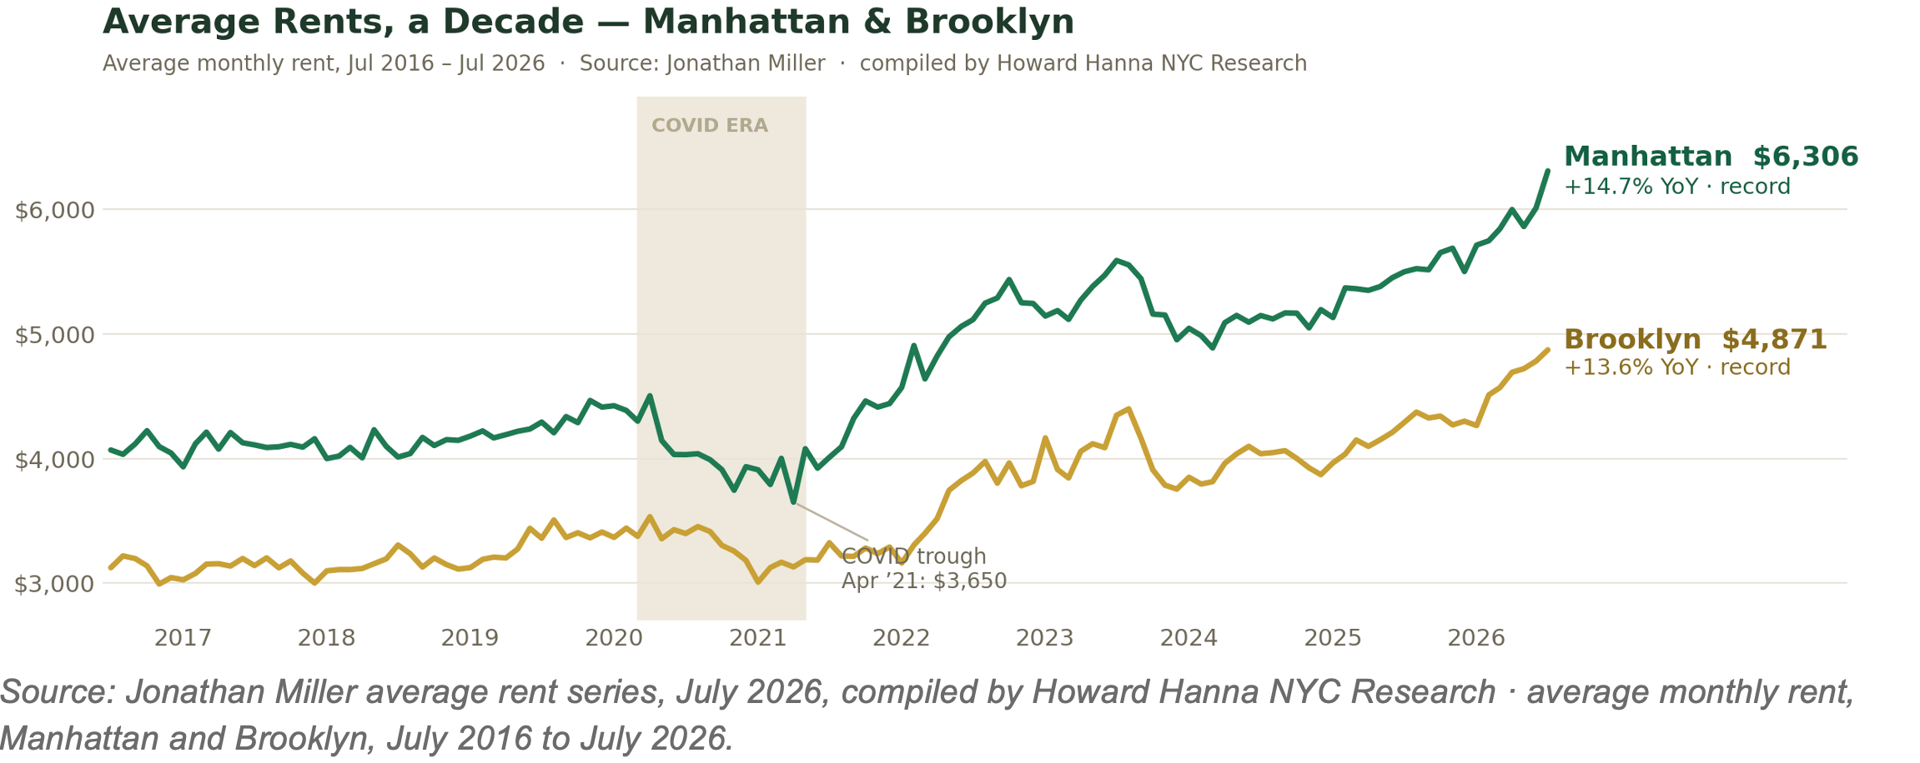
Zoom out and the story sharpens. Jonathan Miller's average-rent series, compiled by Howard Hanna NYC Research, puts Manhattan's average rent at $6,306 in July, up 14.7% year over year, with six record highs in seven months. Brooklyn's average hit $4,871, up 13.6%, a record six months running.
From the April 2021 trough of $3,650, Manhattan is up 73% in five years. Averages run above StreetEasy's medians because they carry the luxury tail, which is where 2026's growth sits. The math for renters: the average Manhattan apartment now costs about $75,700 a year. At ~7% jumbo rates, that is the buy-versus-rent lever at record leverage.
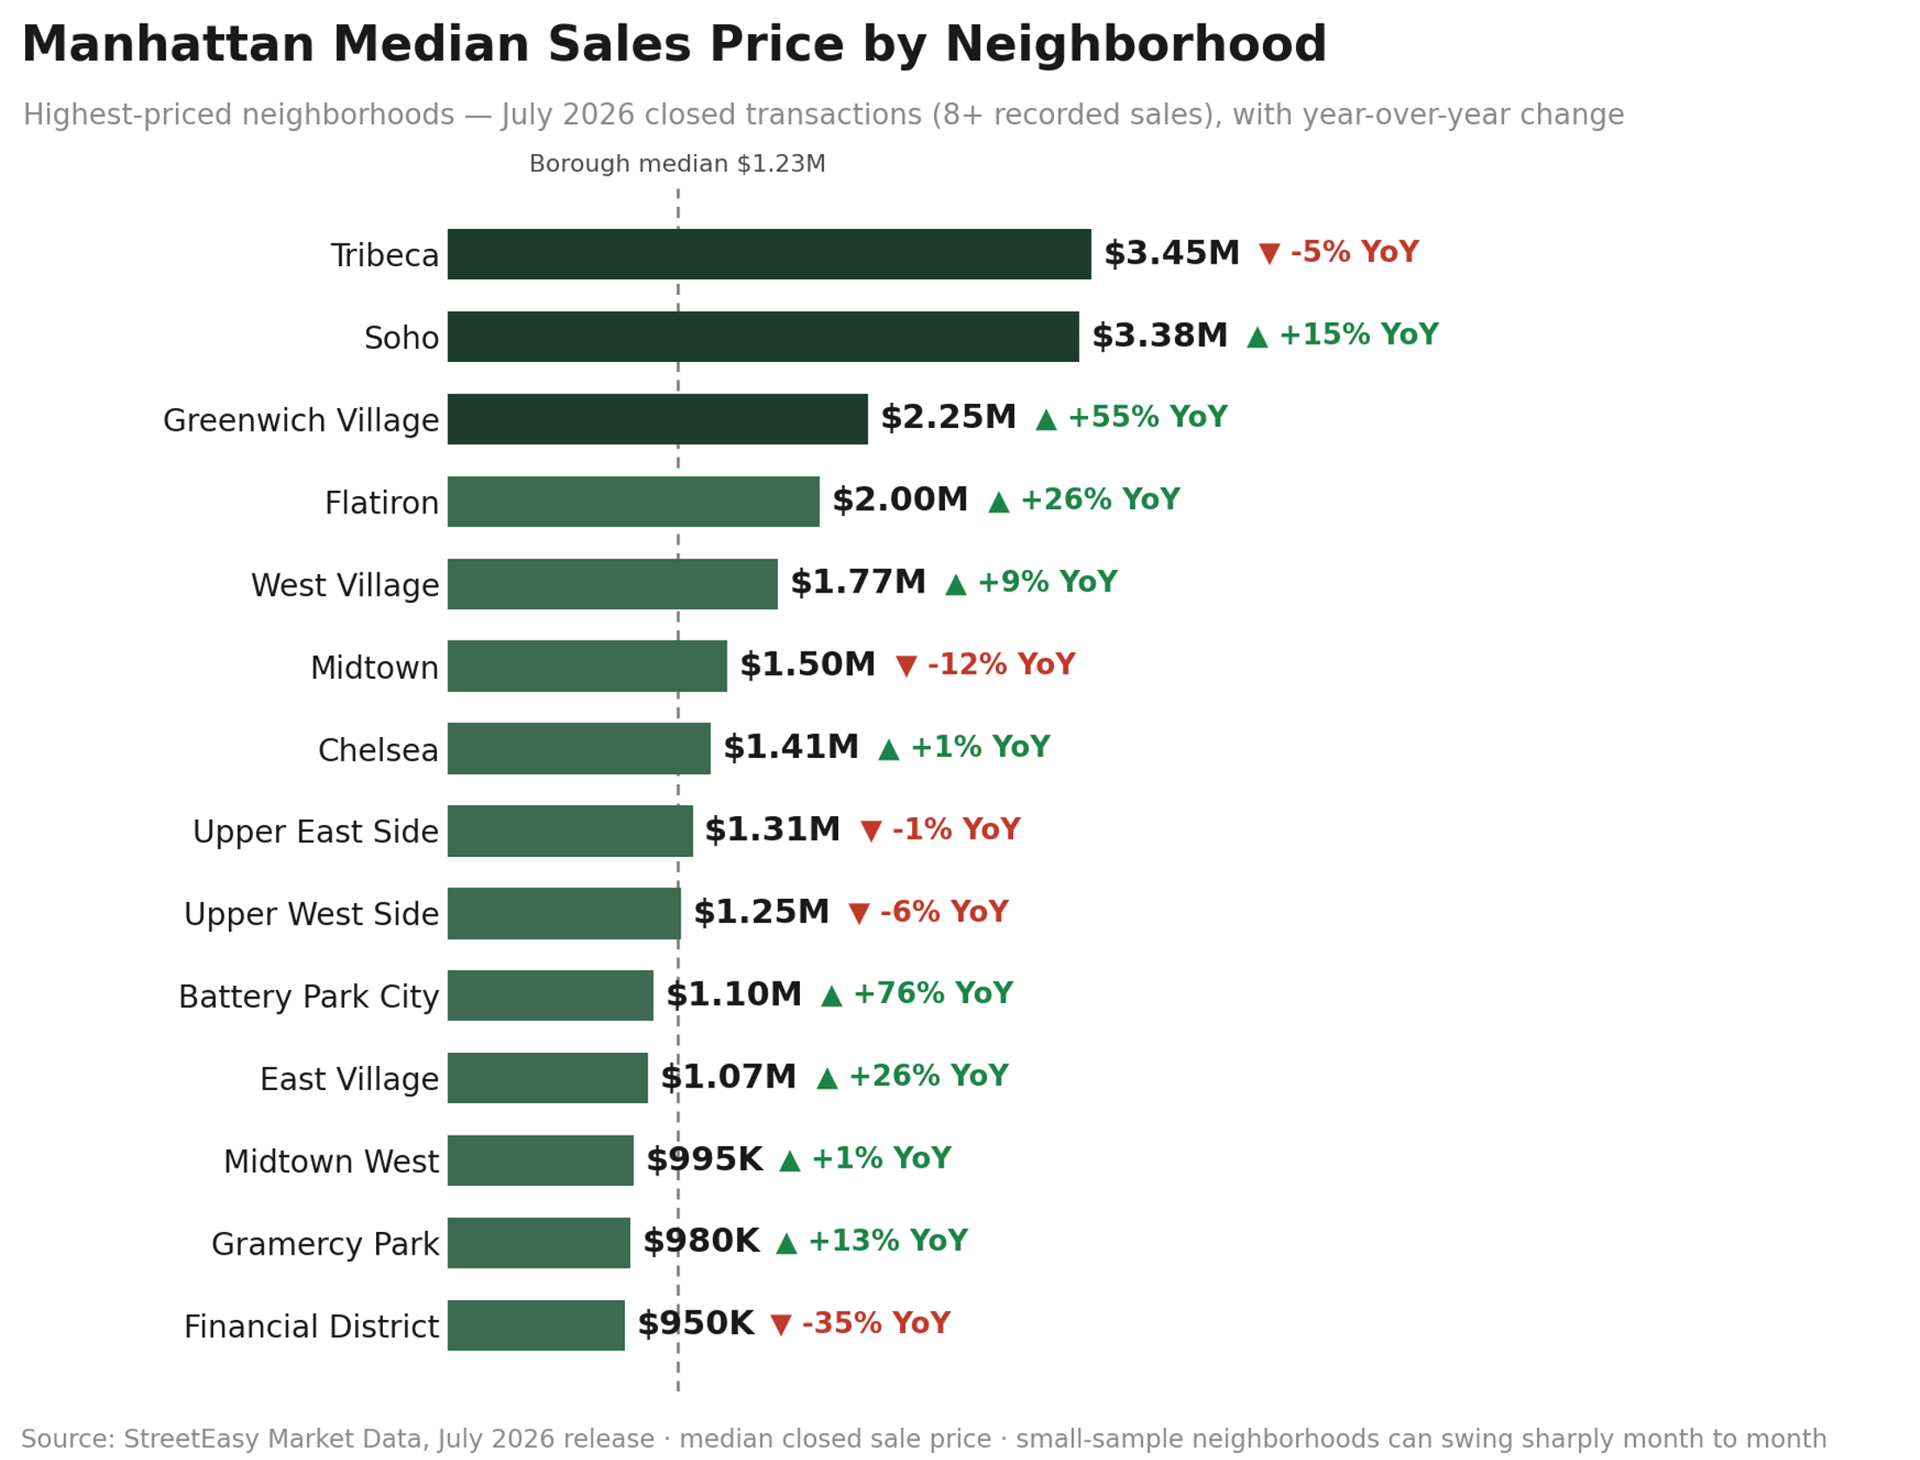
StreetEasy's July closings put the borough median at $1.23M. Among neighborhoods with eight or more recorded sales, Tribeca leads at $3.45M, ahead of Soho ($3.39M) and Greenwich Village ($2.25M on 71 closings, the deepest sample). The value end stays uptown: Washington Heights $670K, Morningside Heights $611K, Hamilton Heights $419K, the same neighborhoods that top the yield map.
Mortgage Remarks
JUMBO APRS AT ~7%: THE HIGHEST OF 2026
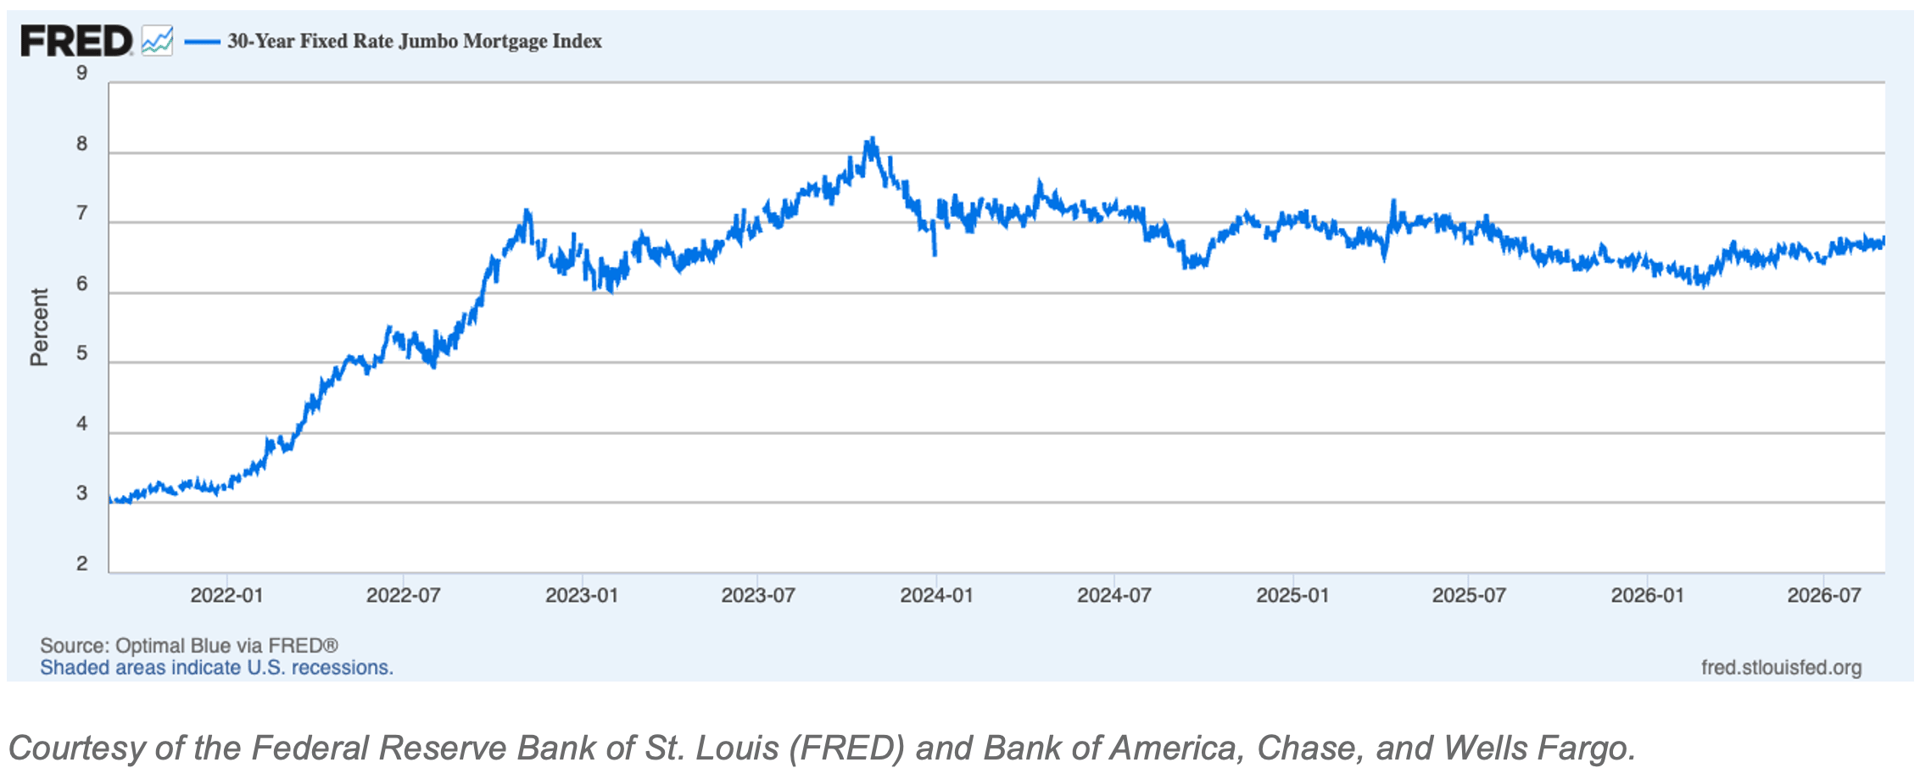
Thirty-year jumbo APRs at the major banks averaged 6.99% as of September 2, per our tracker: Bank of America 7.11%, Chase 6.72%, Wells Fargo 7.14%. That is up from 6.73% in early August and 6.07% in late February, the highest of 2026 and the first 7-handle at two of the three banks. The FRED chart above shows the broader jumbo index pushing back toward ~7%, well below the 2023 peak above 8% but a point above this year's low. The Fed held in July with three dissents favoring a hike; September 16 is the next decision, and the bond market, not the Fed, sets the rates that price jumbo loans.
Buyers: Underwrite at ~7%, not last winter's 6.1%. On a $1M loan the gap is about $610 a month, $180 of it since early August. Negotiating price beats waiting: every $50,000 off is worth about $330 a month at today's rates.
Sellers: Manhattan's equity-heavy buyer pool is the most rate-insulated in the country, one reason pricing held as August demand went seasonal. Below $1.5M, where financing does the work, price with more care.
Outlook: With APRs at ~7% and the September 16 FOMC ahead, expect a 7-handle into the fall. Rate-sensitive demand thins first at the entry level; the top of the market barely notices.
THE RATE BEHIND THE RATE: THE 10-YEAR TREASURY AT A THREE-YEAR HIGH
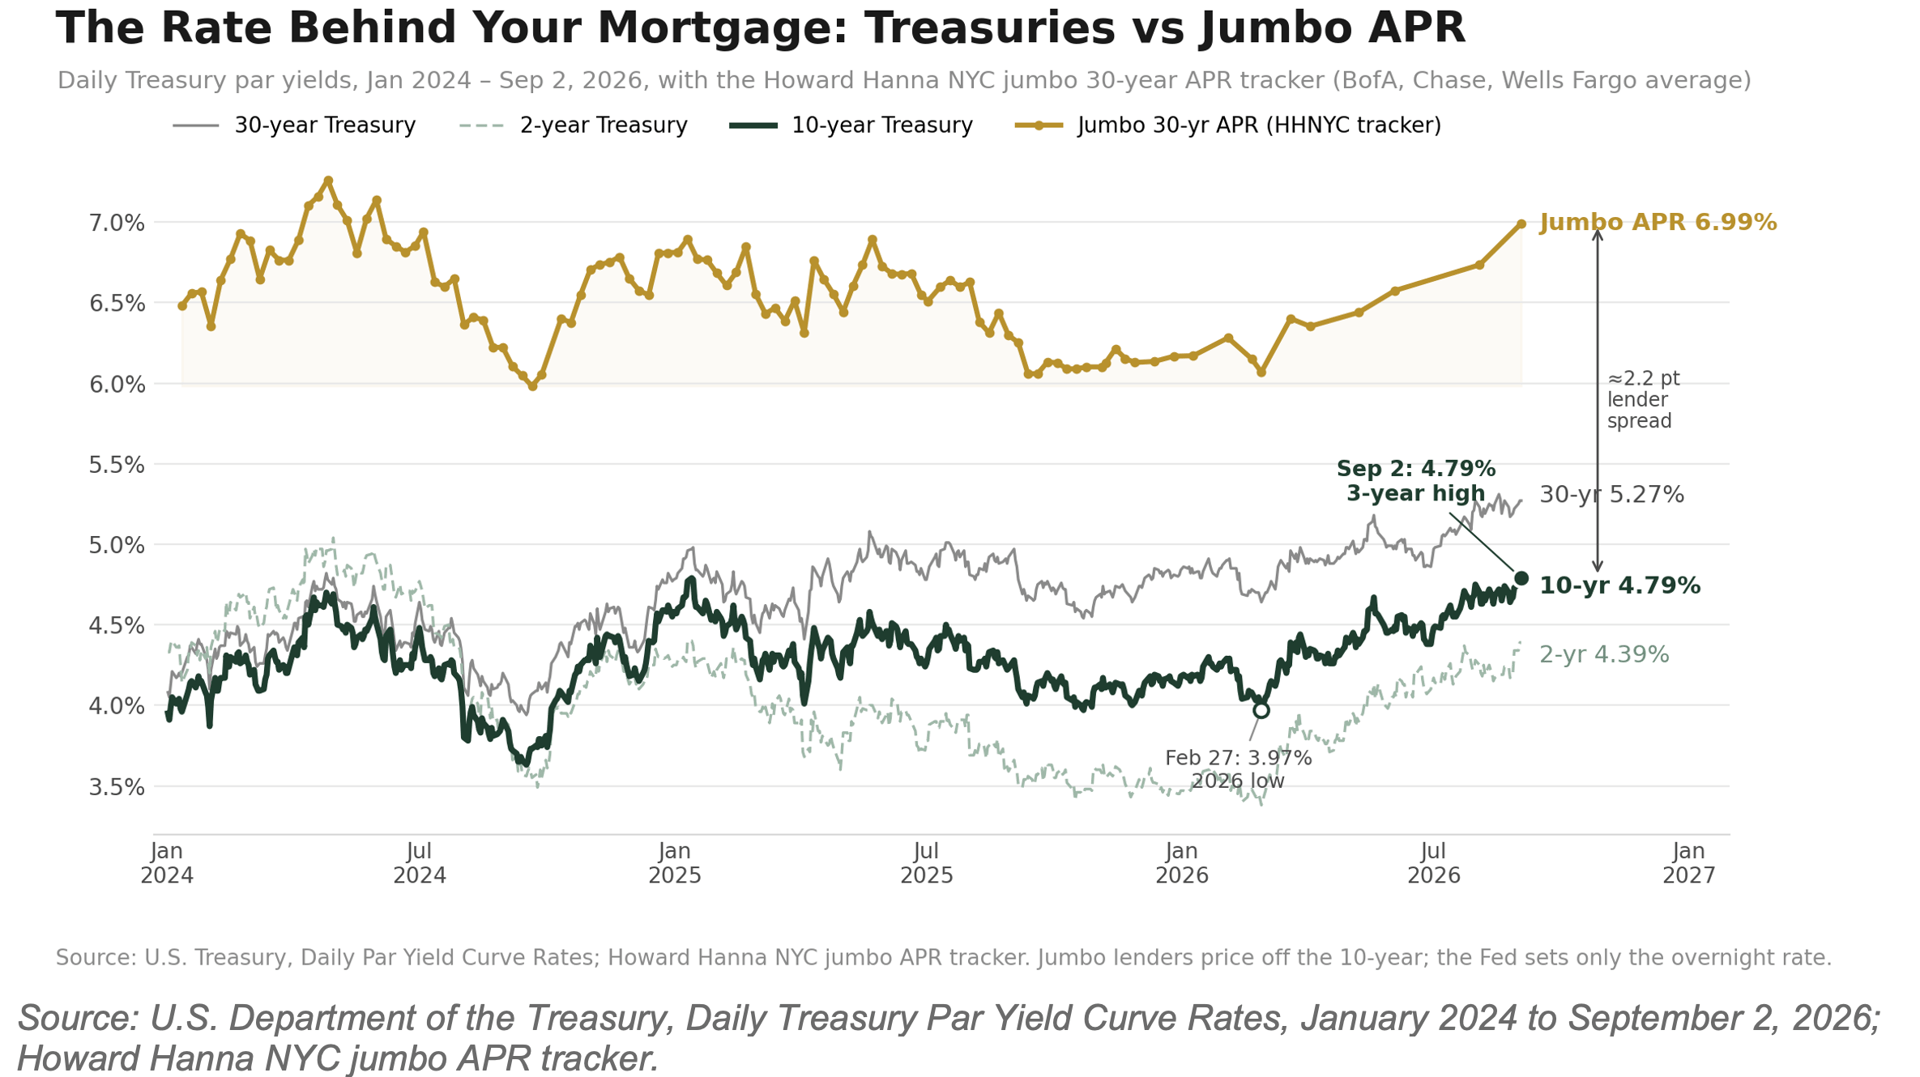
Mortgage rates take their cue from the bond market, not the Fed. The 10-year Treasury yield, the benchmark jumbo lenders price against, has climbed from 4.19% at the start of 2026 to 4.79% on September 2, matching its highest level in three years, and the 30-year sits at 5.27%, near the top of the same range.
The 2-year, which tracks expectations for Fed policy, has risen even faster, from 3.47% to 4.39%, as the market moved from pricing cuts to pricing the hikes three FOMC members are already arguing for. That is why jumbo APRs reached ~7% with the Fed on hold: lenders add roughly 2.2 points over the 10-year, and the 10-year did the moving.
For Manhattan buyers the practical read is simple. Relief will show up in the Treasury market before it shows up at the bank. Watch the 10-year, and treat any dip toward 4.5% as a financing window, not a trend.
Consumer Sentiment
THE NATIONAL MOOD IS NEAR RECORD LOWS. THE MARKET ISN'T LISTENING
The University of Michigan's Index of Consumer Sentiment, the country's longest-running gauge of how households feel about their finances and the economy, fell to 51.7 in August, down 6.3% on the month and 11.2% from a year ago.
Higher means more confident: the index is scaled to 100 in 1966 and has averaged around 85. The low 50s rank below the 1st percentile of the survey's history, and May's 44.8 was a new all-time low. The worry is inflation, which households expect to run 4.0% over the next year.
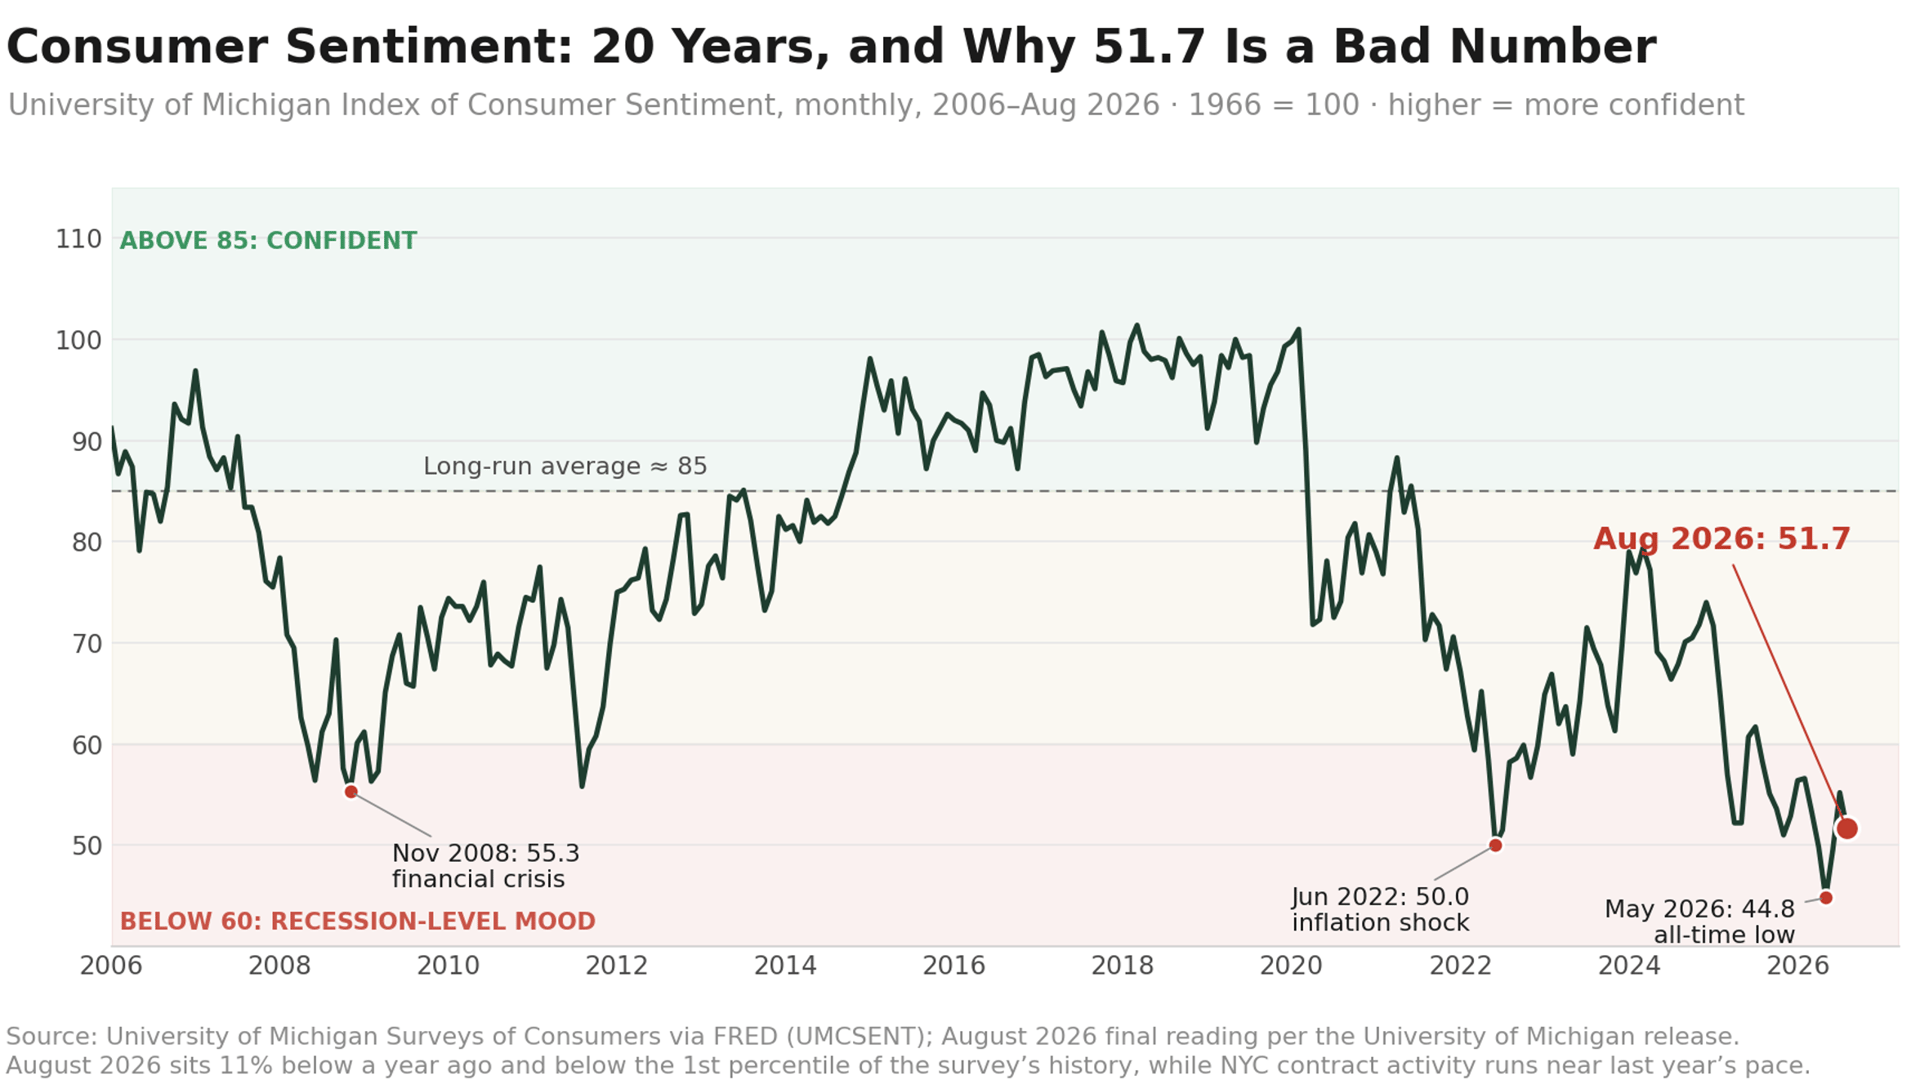
Manhattan is outrunning the mood. National sentiment sits at recession-era levels, yet pending sales run 9.3% above last year, the discount is the tightest of 2026 and prices hold near year highs. Scarcity is beating gloom: active buyers are buying on need and on the math, not on the news. What weak sentiment changes is tempo. Decisions take longer, and a rate or jobs headline can stall a deal in its final week.
Buyers: Weak-sentiment months mean fewer competing bidders. If your finances are settled, clean offers win on terms, not just price.
Sellers: Expect hesitation and answer it with data: comparable closings, days on market and the discount trend, not adjectives. Price to the market you are in, not the one in the headlines.
Outlook: Sentiment tends to snap back when inflation expectations ease. Until then, expect a deliberate buyer and a market that rewards preparation.
Investor Insights
Currency and International Demand
The dollar’s June breakout partially unwound in July: the dollar index ended the month just below 100, with EUR/USD near 1.15, leaving the greenback roughly flat on the summer. For European and UK buyers, New York is neither the bargain of early spring nor meaningfully dearer than a month ago. The conversation with international clients is now about stability rather than momentum, pricing power, not currency, is doing the work.
Domestic Investors and Yield
The rent-versus-buy math keeps moving in the investor's favor on the income side. Jumbo APRs reached ~7%, but asking rents are up 5.2% year over year against sale prices up 3.1%. Rents compounding faster than prices means gross yields grind higher; the uptown corridor now clears 6.7-7.3%.
New This Month: The Investor Yield Map
Updated for July: Washington Heights leads Manhattan at 7.3% gross ($3,200 median rent against a $525K median ask), with Morningside Heights at 7.2% and Battery Park City at 6.8%; Midtown East and Hamilton Heights follow at 6.7%. Soho (1.9%) and Tribeca (2.4%) remain pure appreciation plays. The overlap matters: the highest-yield neighborhoods also lead July's rent gains and anchor the value end of the closed-sales table.
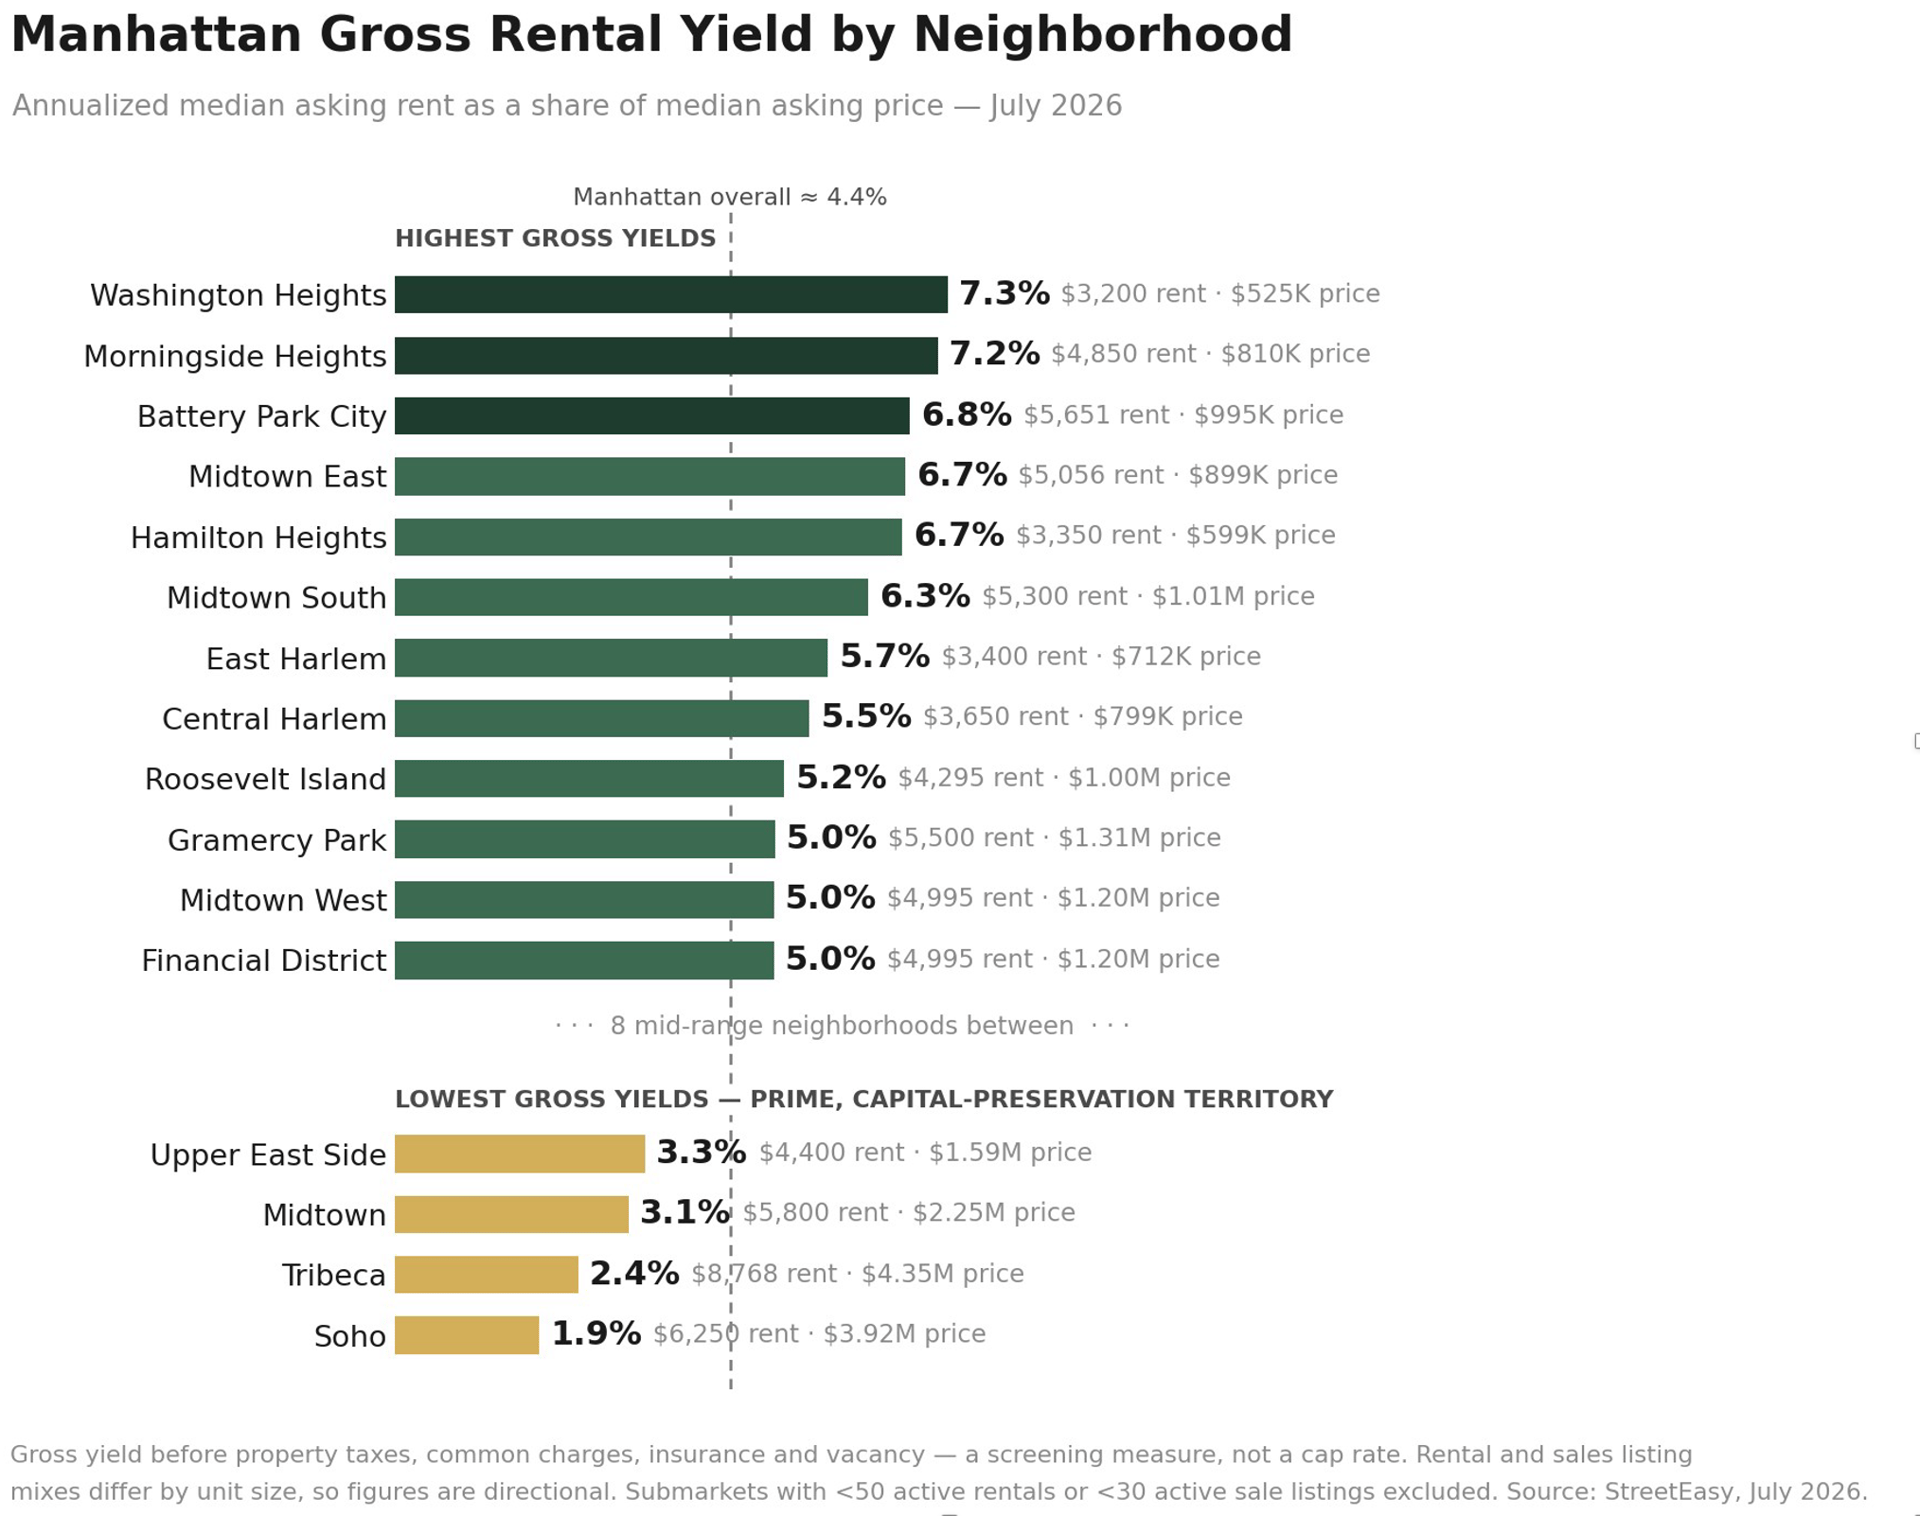
Method: gross yield = annualized StreetEasy median asking rent ÷ median asking price, both July 2026, same source and stage. A screening measure before property taxes, common charges, insurance and vacancy, not a cap rate. Submarkets with fewer than 50 active rentals or 30 active sale listings excluded.
Pied-à-Terre Surcharge: What Non-Primary Owners Need to Do by October 6
NYC's surcharge on non-primary residences has been in effect since July 1. It applies to condos and co-ops with a Department of Finance market value of $1 million or more that are not the owner's primary residence, at 4% of that DOF value.
Scale check: a typical $5 million apartment carries a DOF market value near $1 million, so the surcharge runs roughly $40,000 a year per $1 million of DOF value. Notices went out in late July; state tax data has since cleared more than 6,000 recipients, leaving about 10,800 apartments still asked to respond.
Three things owners should know. The exemption filing deadline is October 6, 2026. A lawsuit over the rollout is pending, but it contests how the city implemented the tax, not the tax itself, so owners who may qualify should file by October 6 regardless.
Exemptions exist: the property is the primary residence of an LLC member, a qualifying family member or young-adult child, or a full-time tenant. Nominal leases to friends fail the arm's-length test.
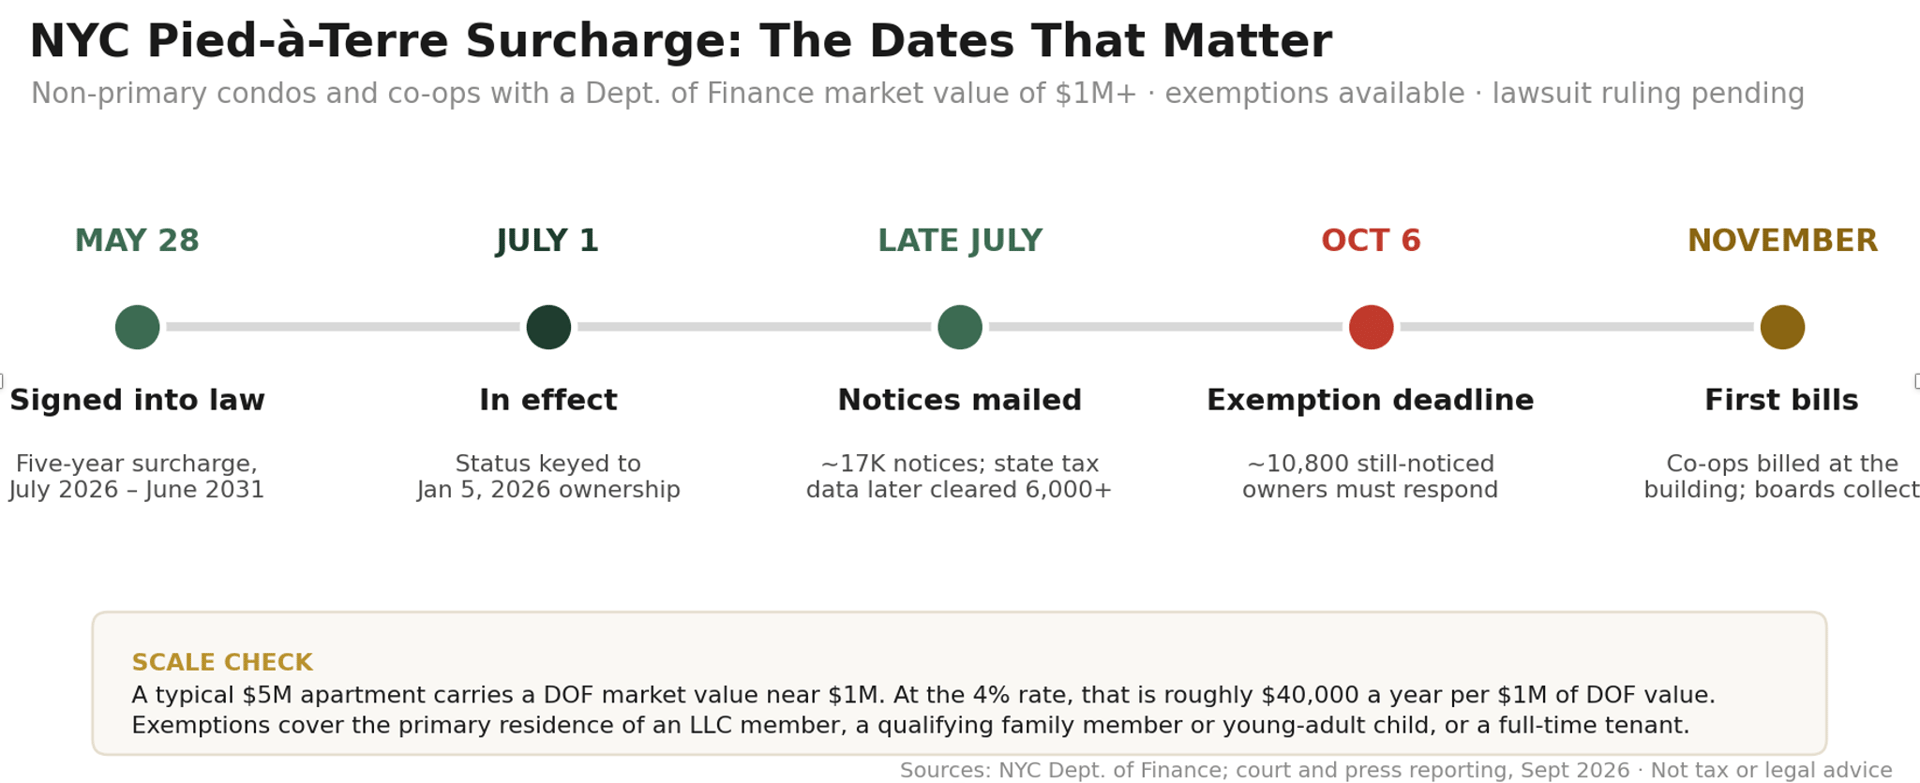
For Owners: If you received a notice, file for any exemption before October 6, with counsel and a tax professional. If you did not, confirm your status rather than assume it. Co-op owners: the building gets the bill and the board collects, so expect it in board correspondence this fall.
For Buyers and Investors: Underwrite the surcharge into any non-primary purchase from $1 million of DOF value. A unit with a full-time tenant is exempt; an empty pied-à-terre is not. The math tilts toward income-producing ownership, the same direction the yield map points.
This is market information, not tax or legal advice. Howard Hanna NYC can tell you what your apartment would rent for and sell for today; your advisors should drive the exemption decision.
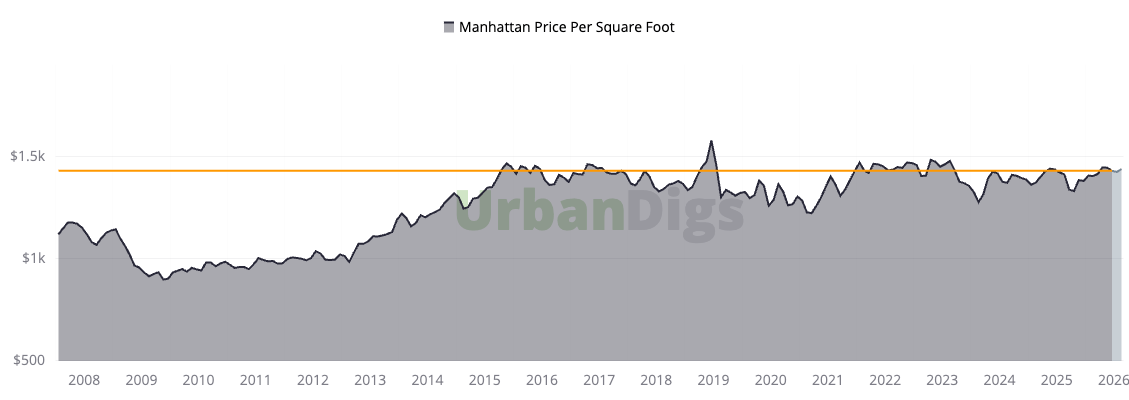
The Manhattan PPSF Story
Manhattan's median PPSF has held a narrow band for over a decade, from a post-crisis trough near $950/sf to a plateau above $1,300/sf. August's $1,440 sits at the top of that band, within 3% of July's high, supported by scarcity rather than speculation. For investors: durable pricing with limited downside, the appreciation complement to the uptown yield corridor.
Questions About This Month’s Market?
If you would like to chat about the most recent market activity,
feel free to contact us at [email protected] or connect with one of our Advisors.
About this report: The Manhattan Real Estate Market Update is compiled monthly by Rihards Gederts, Howard Hanna NYC Research.
References
1. Sales and pricing data, Supply, Demand, PPSF, Listing Discount, Median Sale Price, Days on Market, Leverage Index inputs: UrbanDigs, August 2026 actuals.
2. Bedroom-level median sale price: UrbanDigs Charts Room, 5-year monthly series, by closed date.
3. Rental data (asking rent, inventory, discount share, neighborhood table): StreetEasy Market Data, July 2026 release. Bedroom-level rent chart: May 2026 release.
4. Sales cross-check by neighborhood: StreetEasy Market Data, July 2026 release.
5. Mortgage rate data: Optimal Blue via Federal Reserve Bank of St. Louis (FRED); Howard Hanna NYC jumbo APR tracker (Bank of America, Chase, Wells Fargo), September 2, 2026.
https://www.federalreserve.gov/newsevents/pressreleases/monetary20260617a.htm6. Federal Reserve policy: Federal Reserve Board, FOMC statement, July 29, 2026. https://www.federalreserve.gov/newsevents/pressreleases/monetary20260729a.htm
7. Currency data: EUR/USD, GBP/USD, and U.S. Dollar Index market data, as of late July 2026.
8. Gross rental yield: annualized StreetEasy median asking rent ÷ median asking price, by neighborhood, July 2026 release. Screening measure; thin submarkets excluded (see chart footnote).
9. Leverage Index: Howard Hanna NYC Leverage Index 2026; inputs courtesy of UrbanDigs.
10. Consumer sentiment: University of Michigan Surveys of Consumers, August 2026 final; history via FRED (UMCSENT).
11. Average rent history: Jonathan Miller average rent series, July 2026, compiled by Howard Hanna NYC Research.
12. Pied-à-terre surcharge: NYC Department of Finance non-primary residence surcharge notices and guidance; court and press reporting, September 2026. Not tax or legal advice.
13. Treasury yields: U.S. Department of the Treasury, Daily Treasury Par Yield Curve Rates (home.treasury.gov), 2024 to September 2, 2026.
Howard Hanna NYC brings the nation’s largest independent and family-owned brokerage to New York City, uniting the strength of a national network with the insight and sophistication of a local firm. Formed through joining forces with Elegran Real Estate, Howard Hanna NYC delivers a seamless, full-service experience backed by more than 15,000 agents across 500 offices in 14 states. The firm’s forward-thinking, agent-first culture continues to shape the future of real estate across Manhattan and the Tri-State area.Learn more at www.howardhannanyc.com.