
Overall Brooklyn Market Update: April 2024
Demand Rises MoM, Falls YoY, and Continues to Outpace Supply
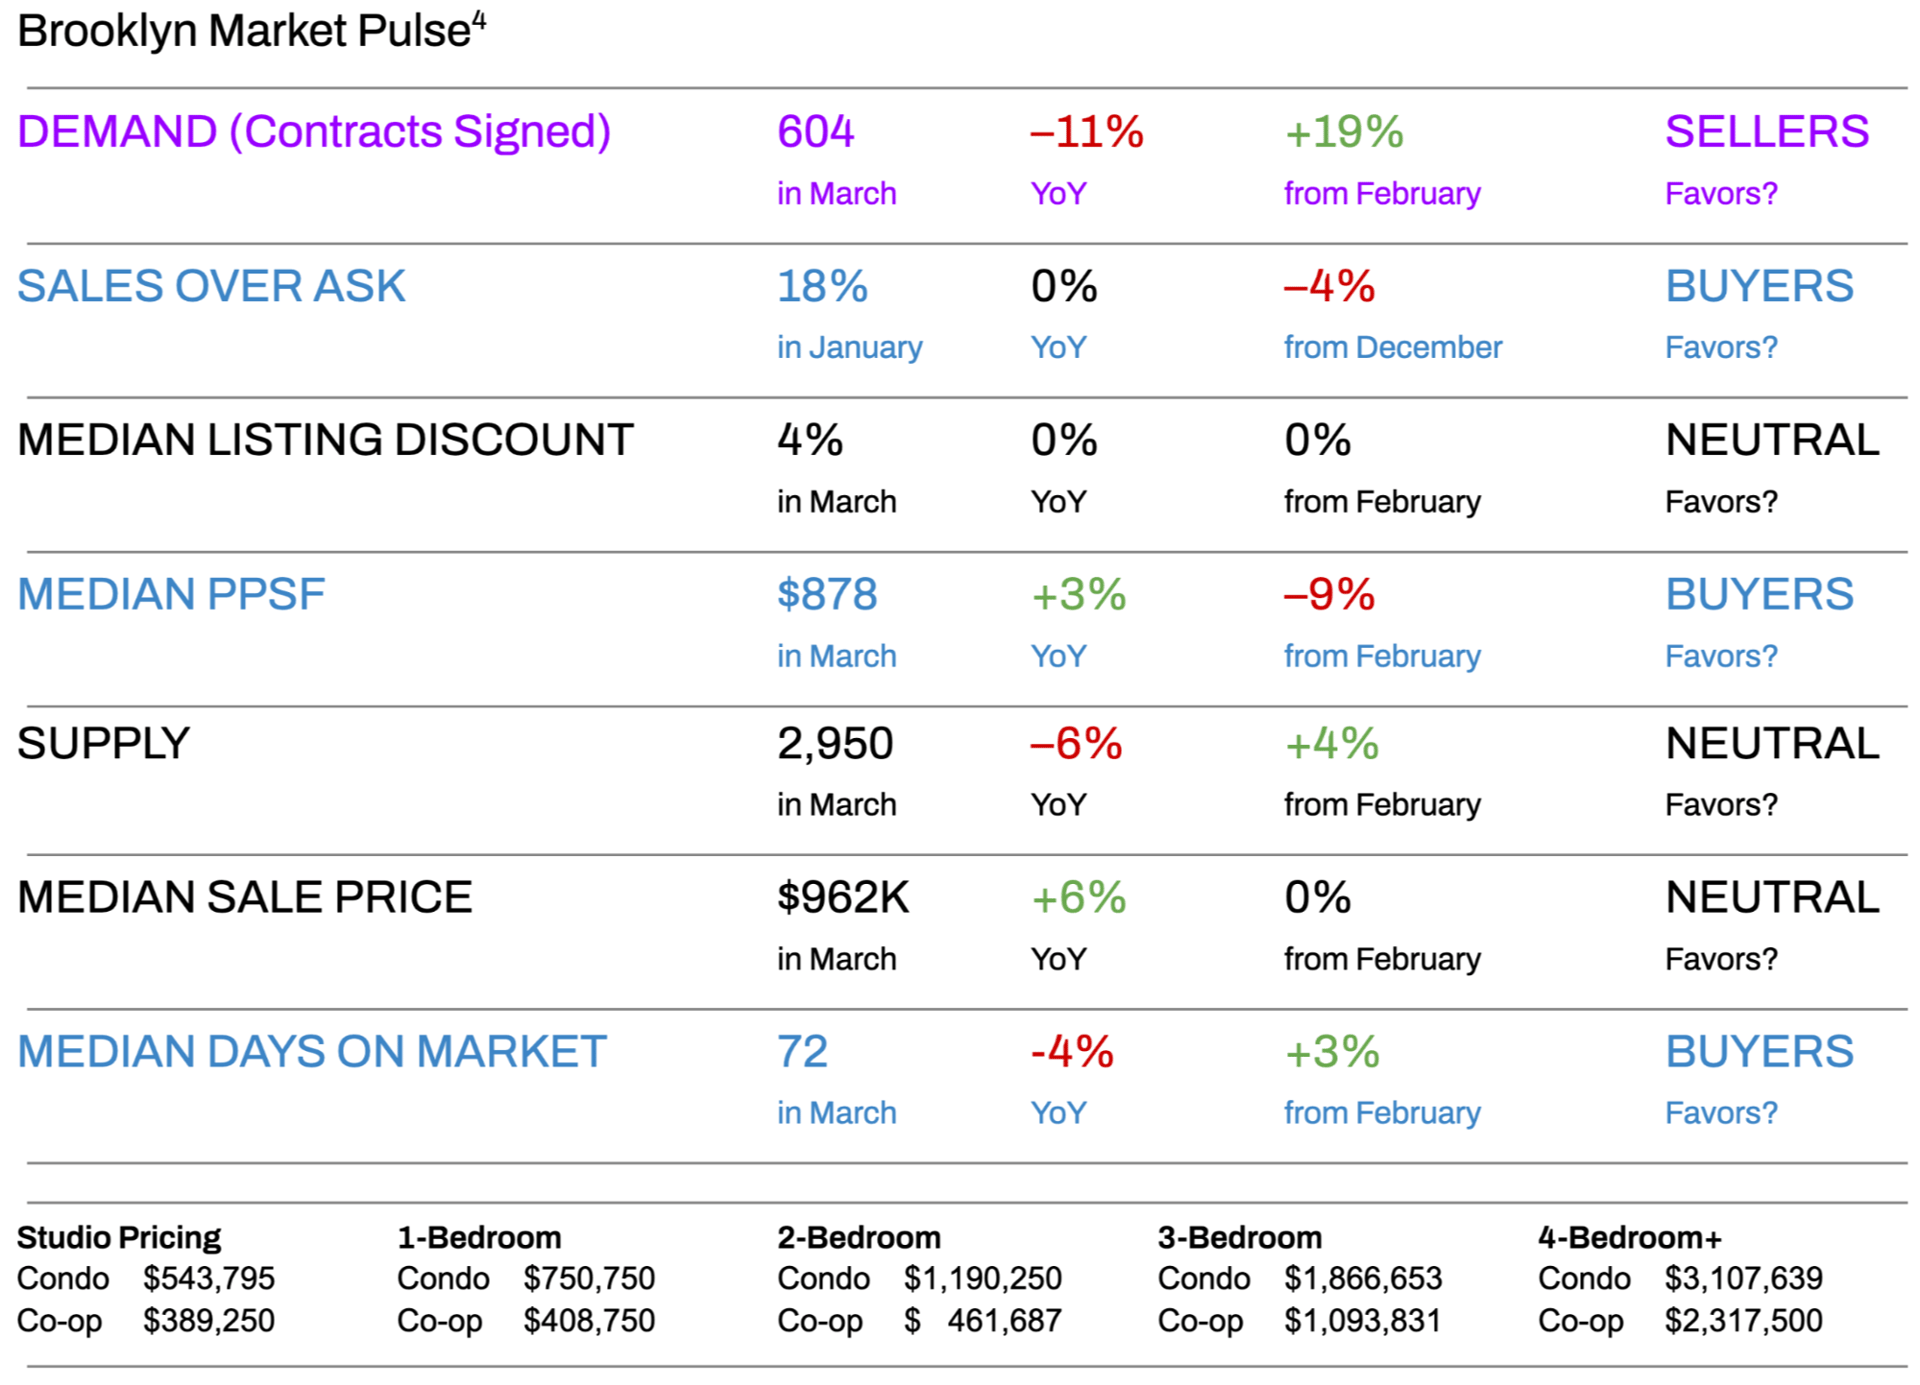
Despite dashed and delayed Fed rate cut expectations and rising interest rates, contract activity in Brooklyn increased by 19% in March compared to February. However, it declined by 11% compared to last year.
As seasonally expected, supply increased by 4% in March but remained 6% lower than last year. This recent imbalance between supply and demand has fostered a competitive market environment. Signs of stabilization are emerging, with a potential price floor forming in median price per square foot, while a ceiling may also be developing in median listing discounts.
The Elegran | Forbes Global Properties Brooklyn Leverage Index indicates a neutral and balanced market with leverage slightly favoring sellers as demand outpaces supply.
Sales
- “Neutral” markets don’t exist because buyers and sellers are constantly playing tug-of-war for leverage.
- At times (e.g., the past 12 months), there’s no clear winner as buyers & sellers reach equilibrium.1
- Based on the data, it’s a neutral market, and sellers gained a small advantage in March.
- Demand (measured by contracts signed) increased in the seller’s favor.
- The median listing discount was unchanged compared to February.
- Supply increased in March in the buyer’s favor but was lower YoY in the seller’s favor.
- Median PPSF (Price Per Square Foot) decreased by 9% in March in the buyer’s favor but was higher YoY in the seller’s favor.
- Demand (measured by contracts signed) increased in the seller’s favor.
- At times (e.g., the past 12 months), there’s no clear winner as buyers & sellers reach equilibrium.1
Rentals
- From July’s 2023 record of $3,950, median rent has cooled to $3,5002, yet is still high for the borough.
- While median prices remain lower than peaks in 2023, they’ve increased from this past winter, and with spring approaching, we anticipate continuous rent increases in both April and May.
Investments
- Total return is generated by net rental income and price appreciation.
- All-cash buyers can expect a cap rate approaching 3%.
- Since the average JUMBO mortgage rate APR is 6.76%3, there is no net rental income on leveraged purchases.
- All-cash buyers can expect a cap rate approaching 3%.
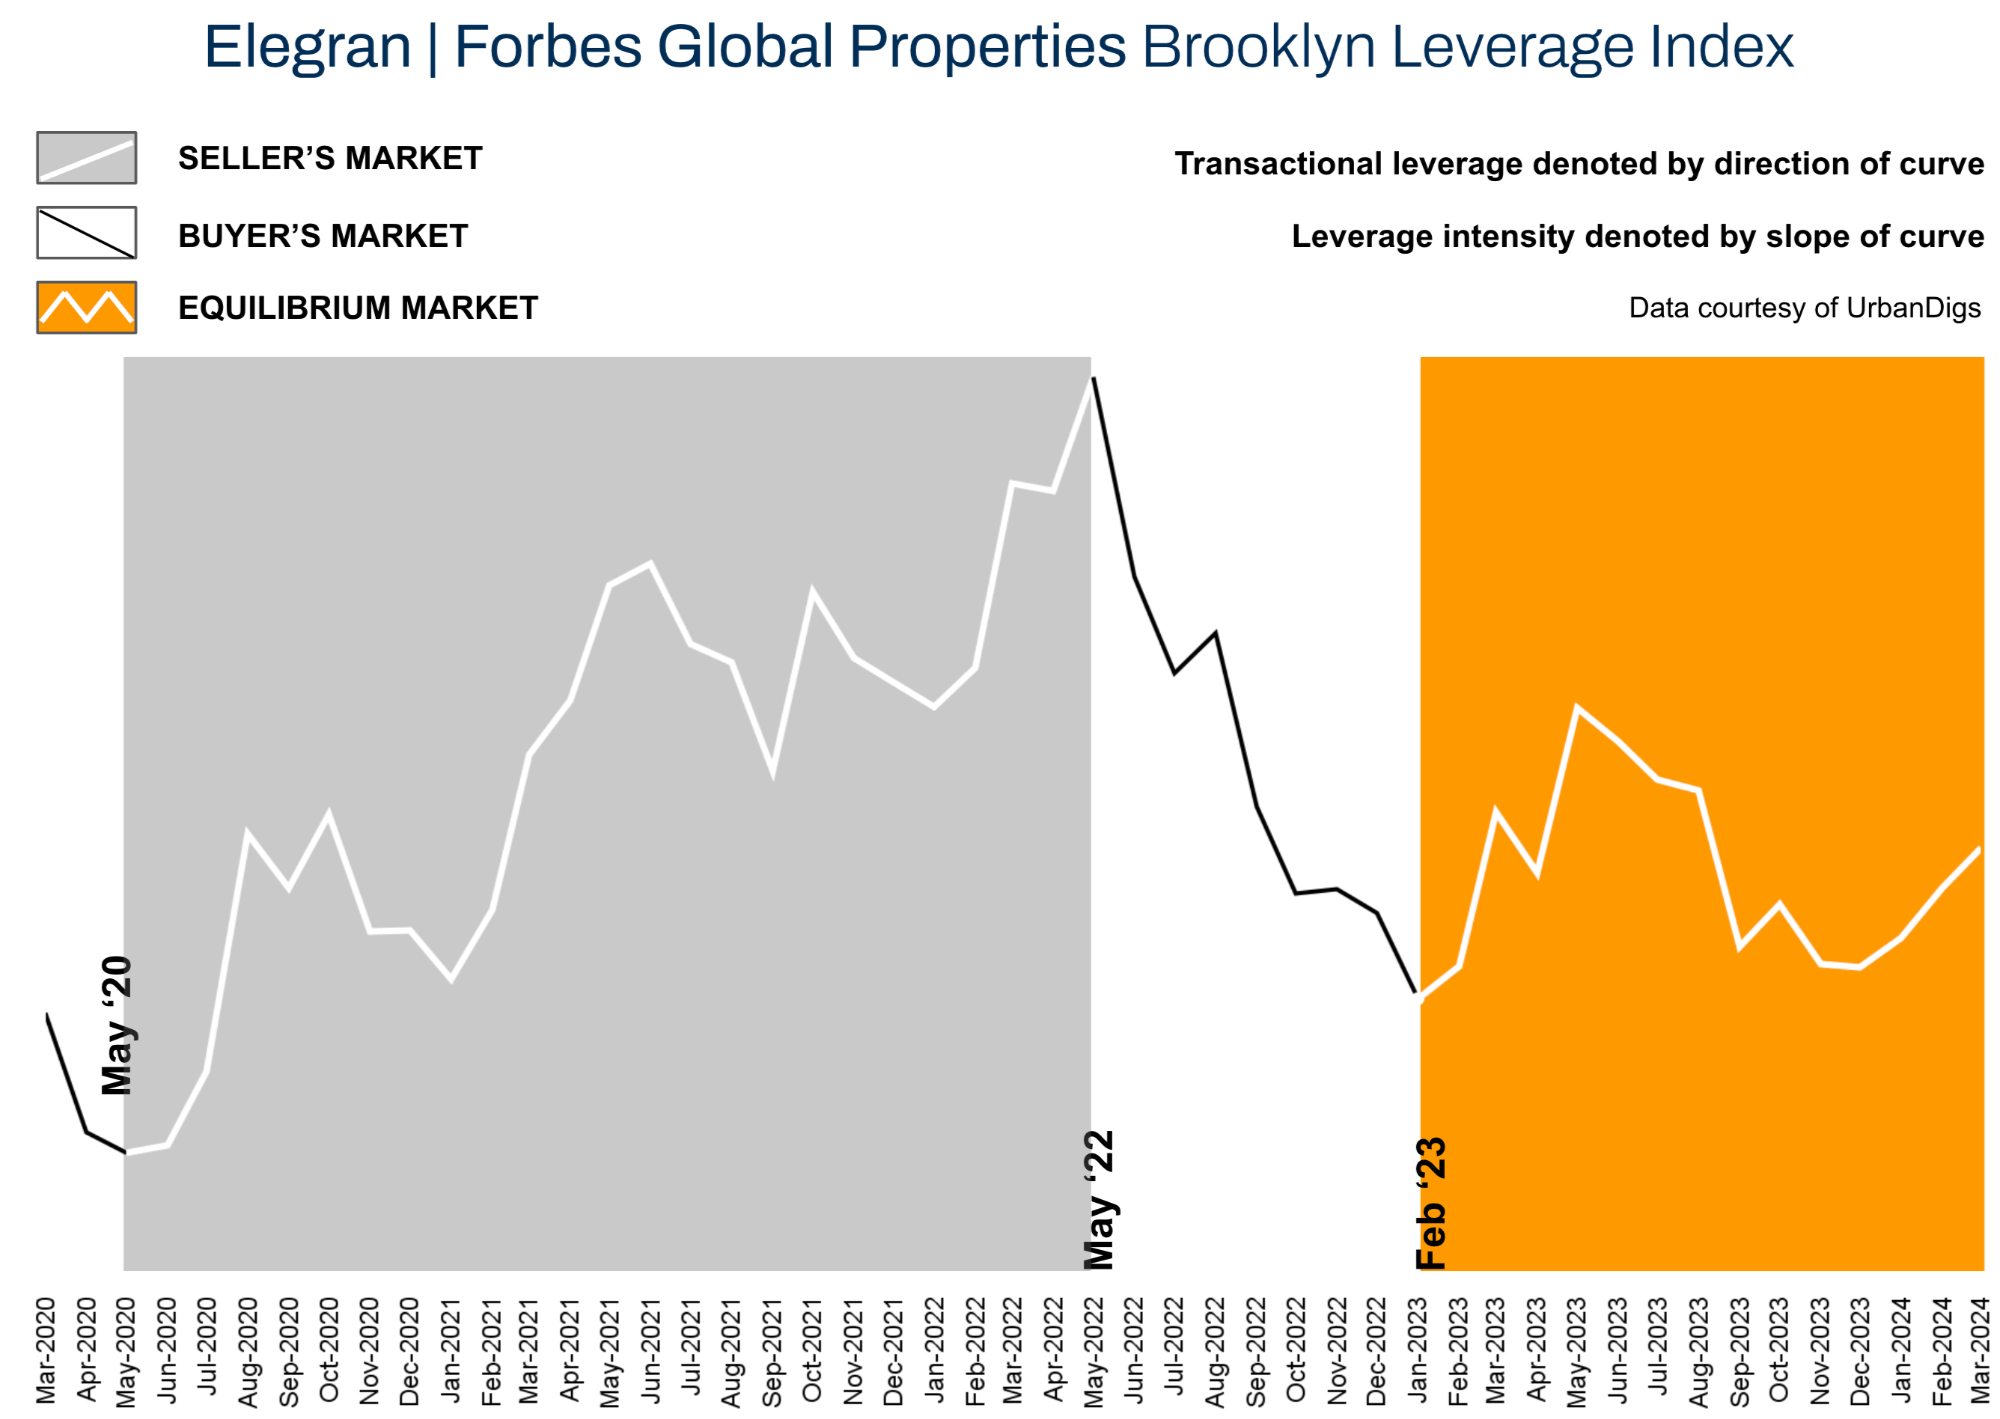
Elegran | Forbes Global Properties Brooklyn Leverage Index
The Elegran | Forbes Global Properties Brooklyn Leverage Index is powered by four indicators: supply, demand, median price per square foot (PPSF), and median listing discount.
It informs us whether the current is a buyer’s or a seller’s market, i.e., which party possesses transactional leverage. Looking at the graph below, this is indicated by the direction of the curve, where:
- An increasing trend from left to right indicates a seller’s market
- A decreasing trend from left to right indicates a buyer’s market
Our indicator also informs us regarding the relative strength of that leverage, indicated by the slope of the curve, where:
- A gentle slope indicates a weak advantage by one party over the other
- A sharp slope indicates a strong advantage.
But the numbers are not important. What is important is the direction and slope of the curve. For the last few months, there has been a stalemate between buyers and sellers in a relatively balanced market. Sellers gained a slight edge as demand rose faster than supply. This trend will likely continue in the coming months, with leverage increasingly favoring sellers as demand outpaces supply.
Brooklyn Supply
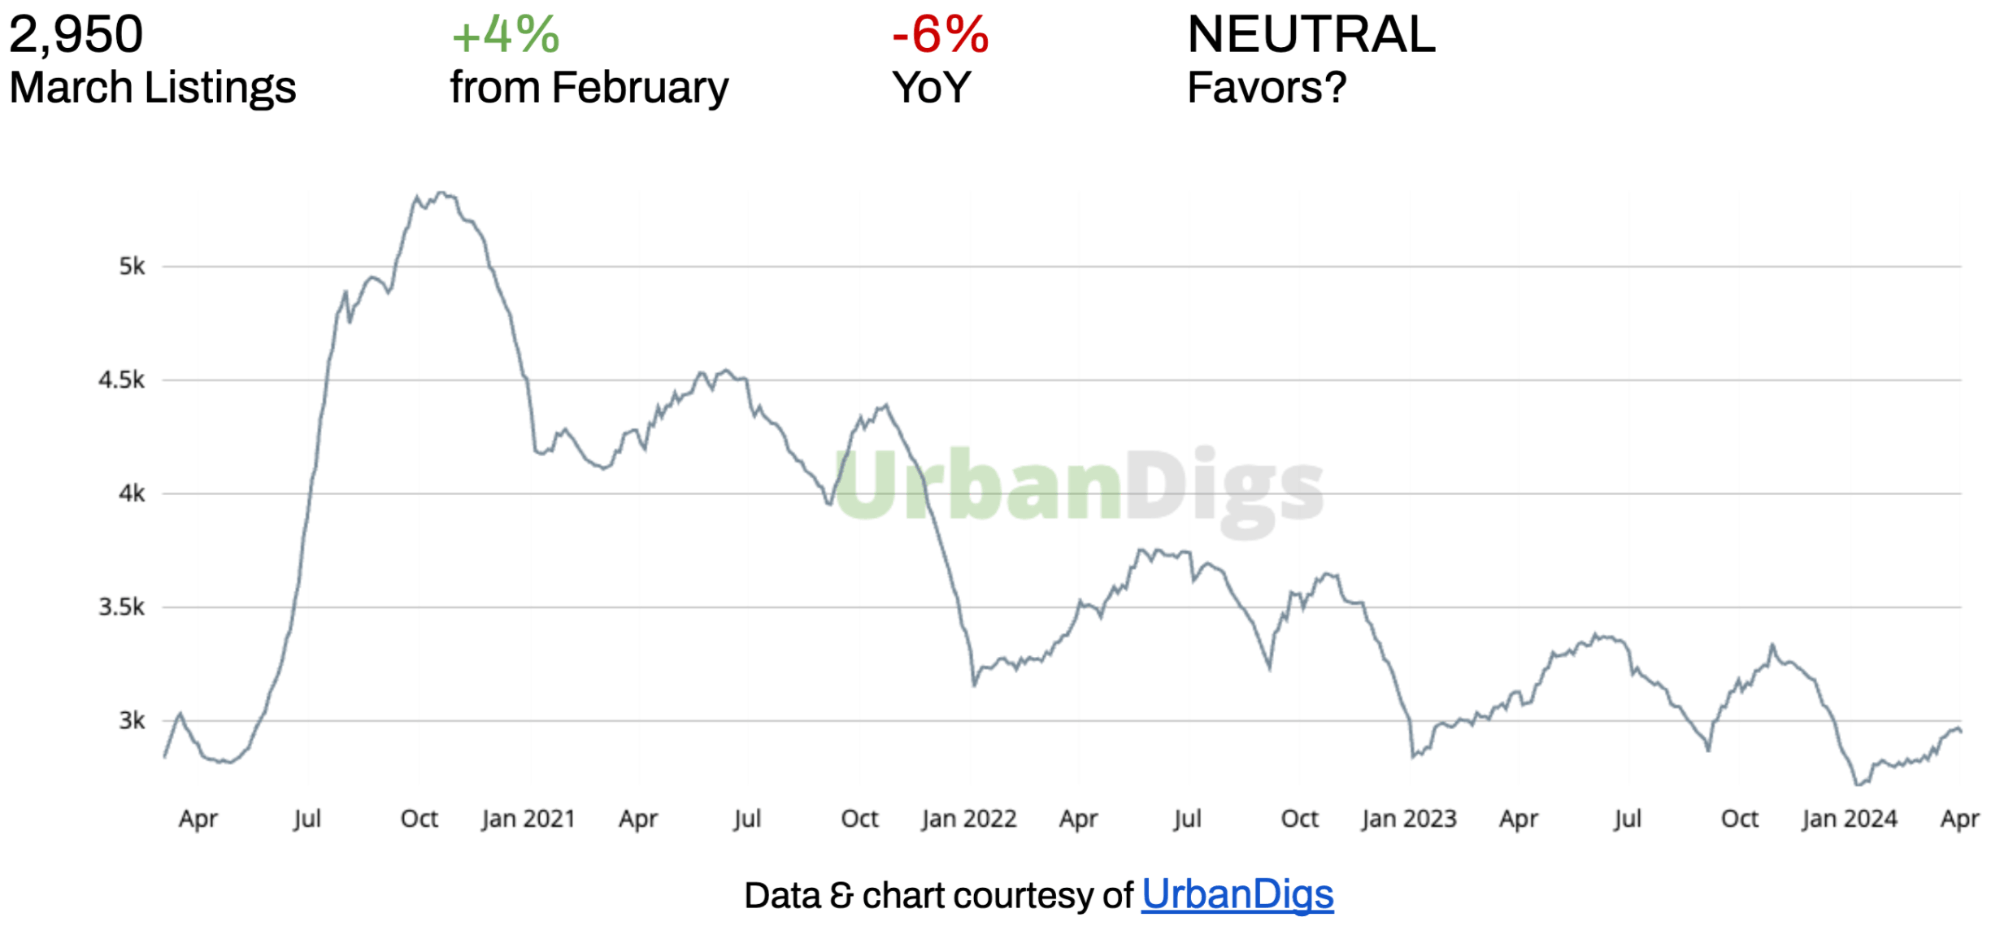
The chart above depicts a steady pattern in Brooklyn's supply over the last three years. Supply increased 4% in March compared to February, tracking seasonal trends, but remains 6% lower than last year.
What Does This Mean for:
- BUYERS: Available inventory has increased compared to previous months, providing more choice, but overall inventory levels are still lower than last year.
- SELLERS: More inventory means more competition among sellers for buyers, but sellers who price their homes appropriately maintain a slight advantage as demand outpaces supply.
Anticipate a steady increase in supply through May, providing buyers with more options.
Brooklyn Demand
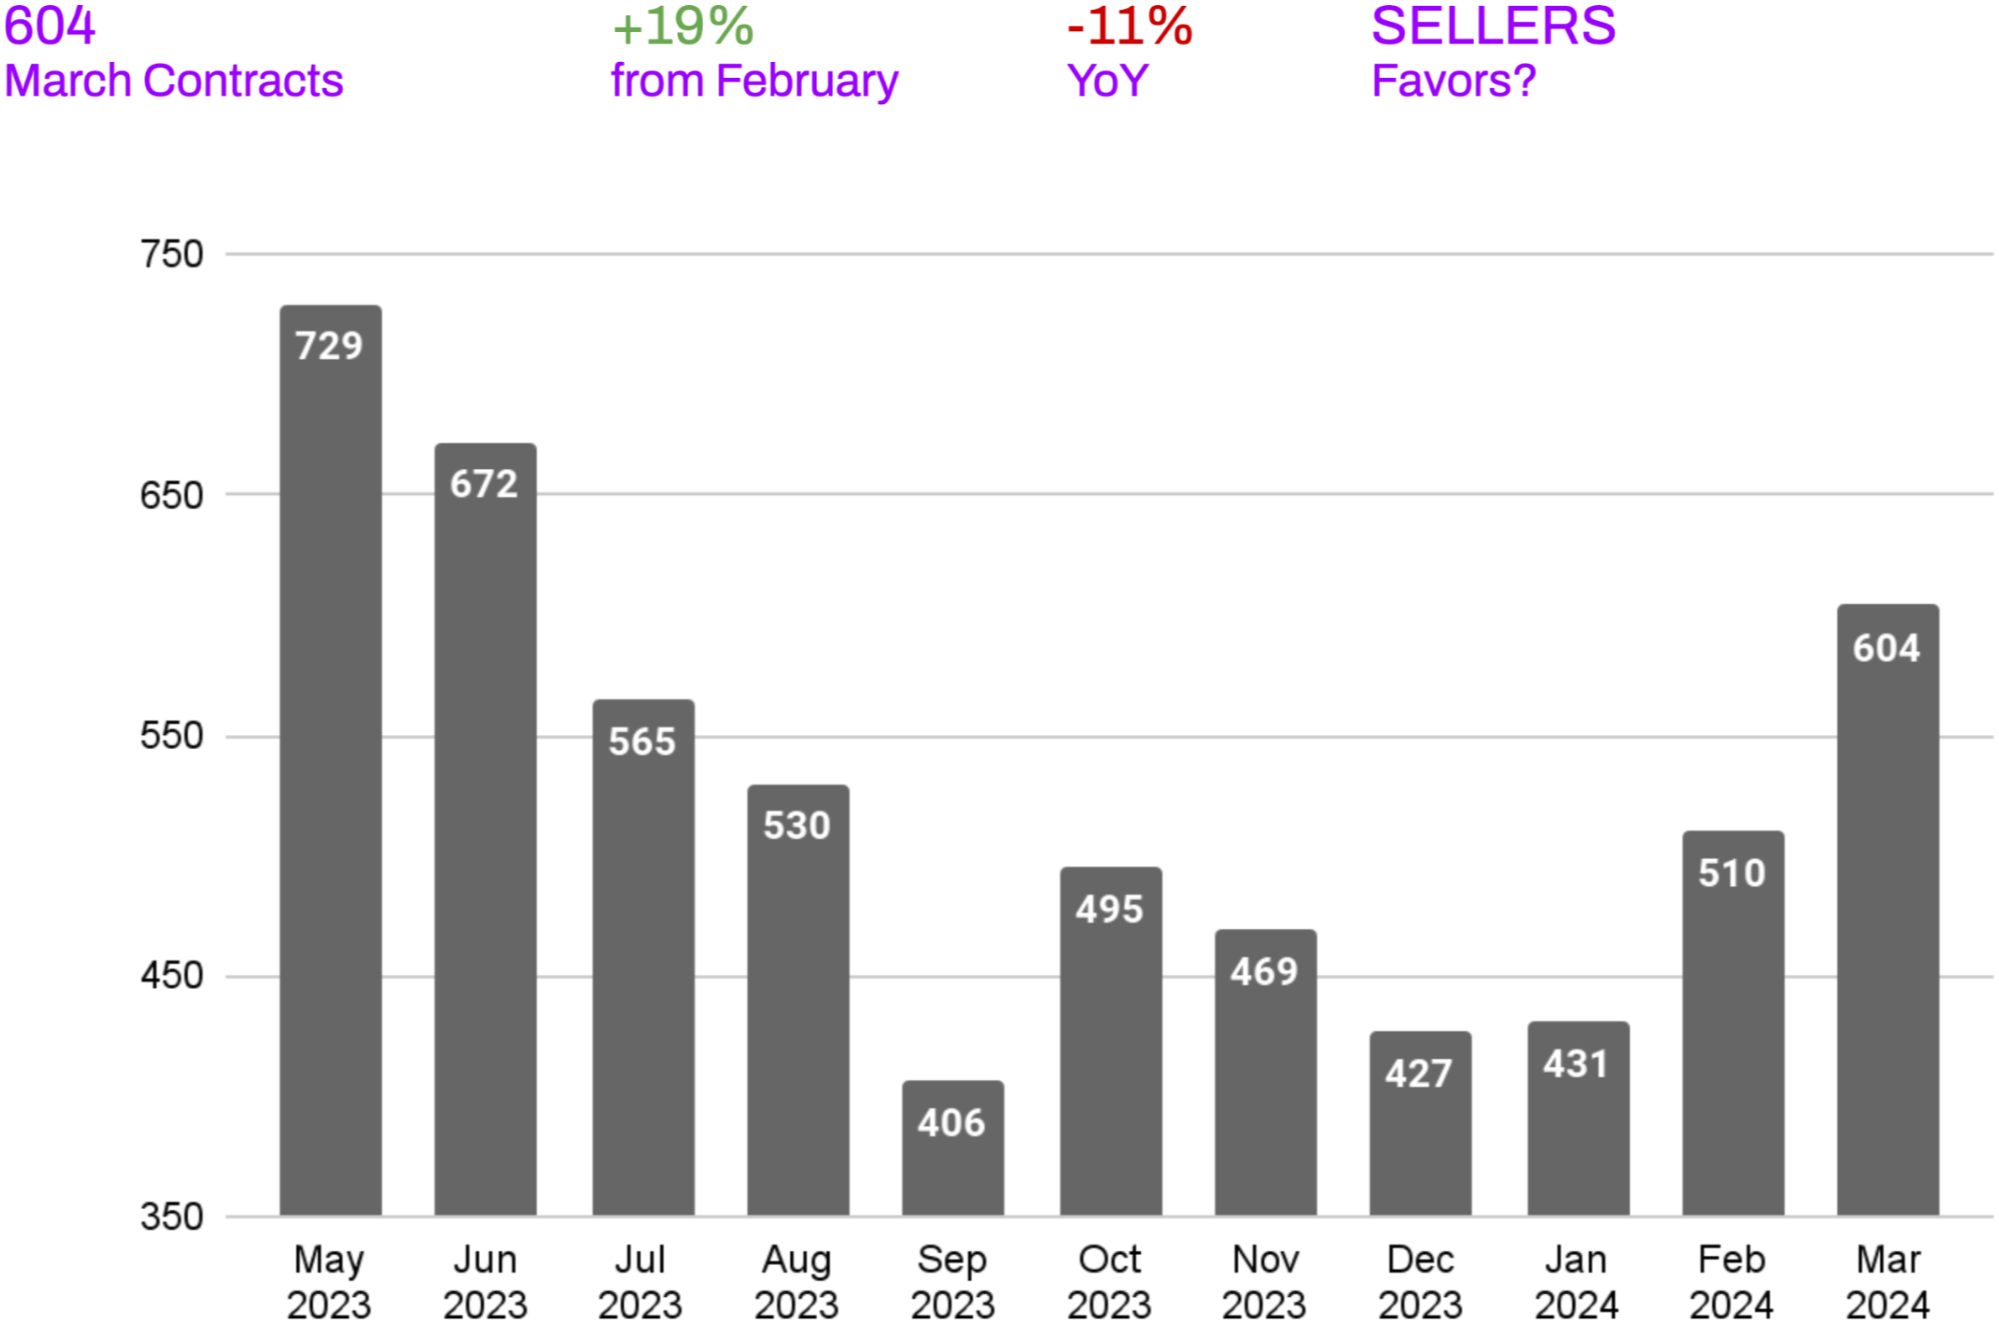
Contracts signed increased by 19% from February to March, indicating an acceleration in demand for the spring market. However, equally as notable, in contrast to January and February, when demand surpassed the previous year, this March witnessed an 11% decline in signed contracts compared to the same period last year.
What Does This Mean for:
- BUYERS: More competition.
- SELLERS: More activity.
Overall, contract volumes should continue to increase over the next few months as the traditionally busy spring listing season is underway. As demand continues to rise faster than supply, the market feels more competitive, and leverage is tilting in favor of sellers.
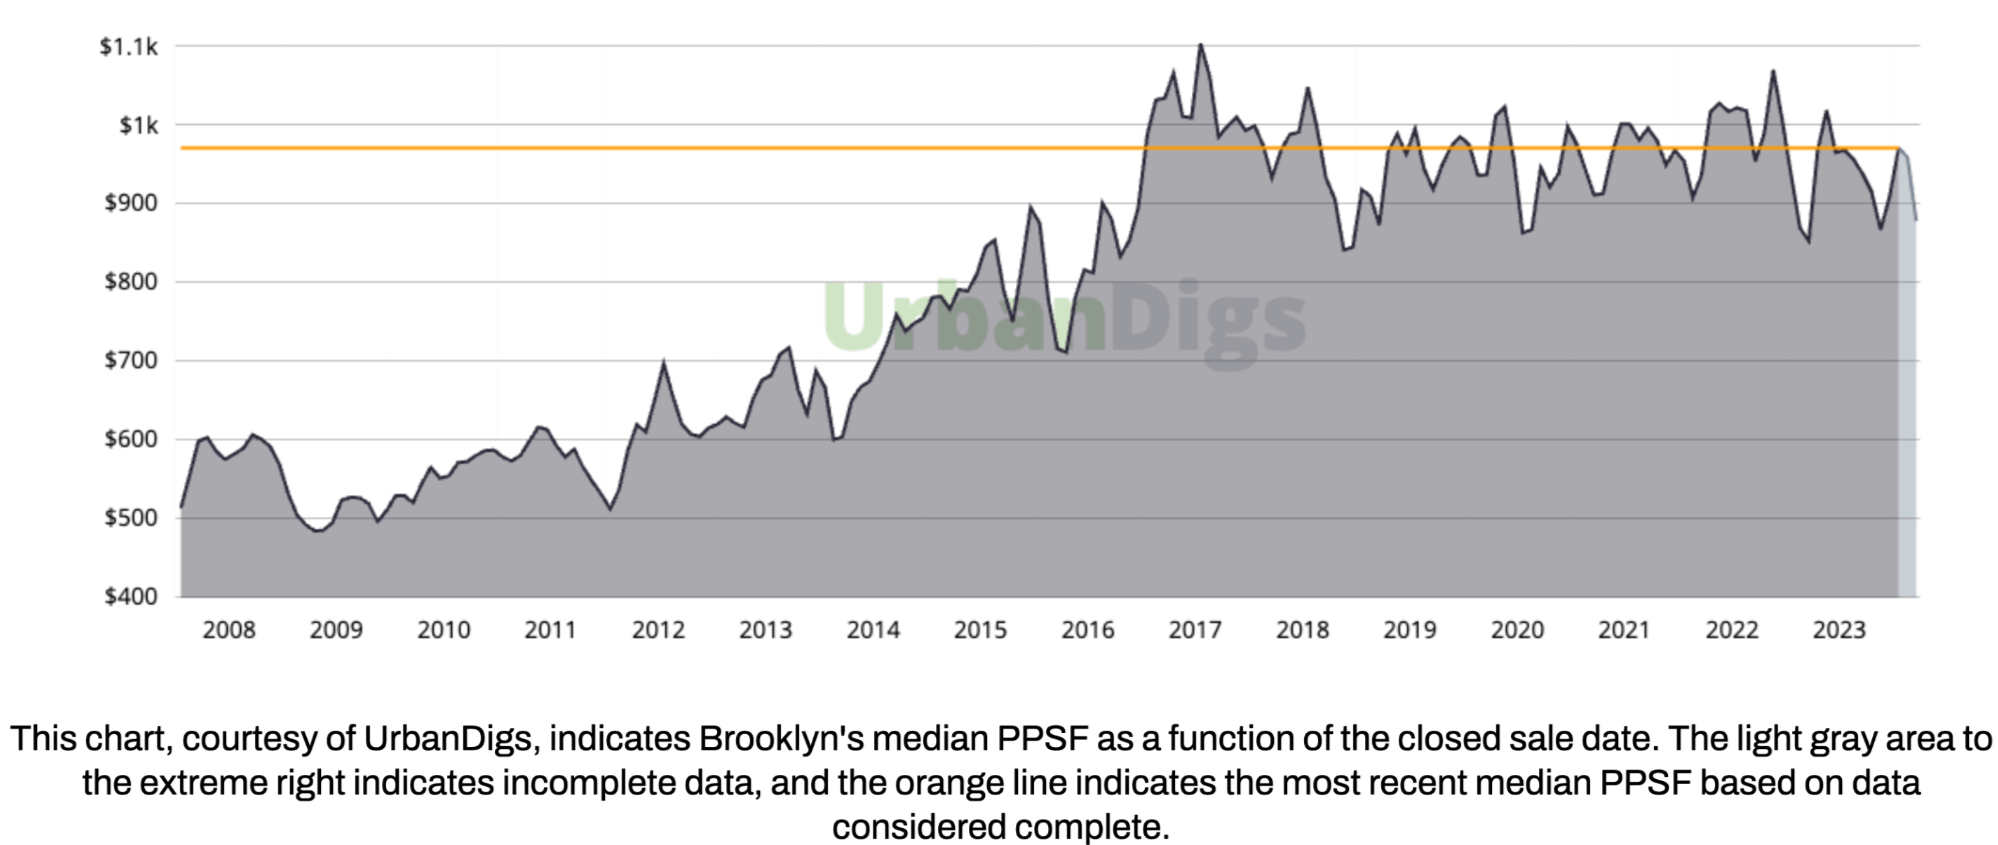
Brooklyn Median PPSF
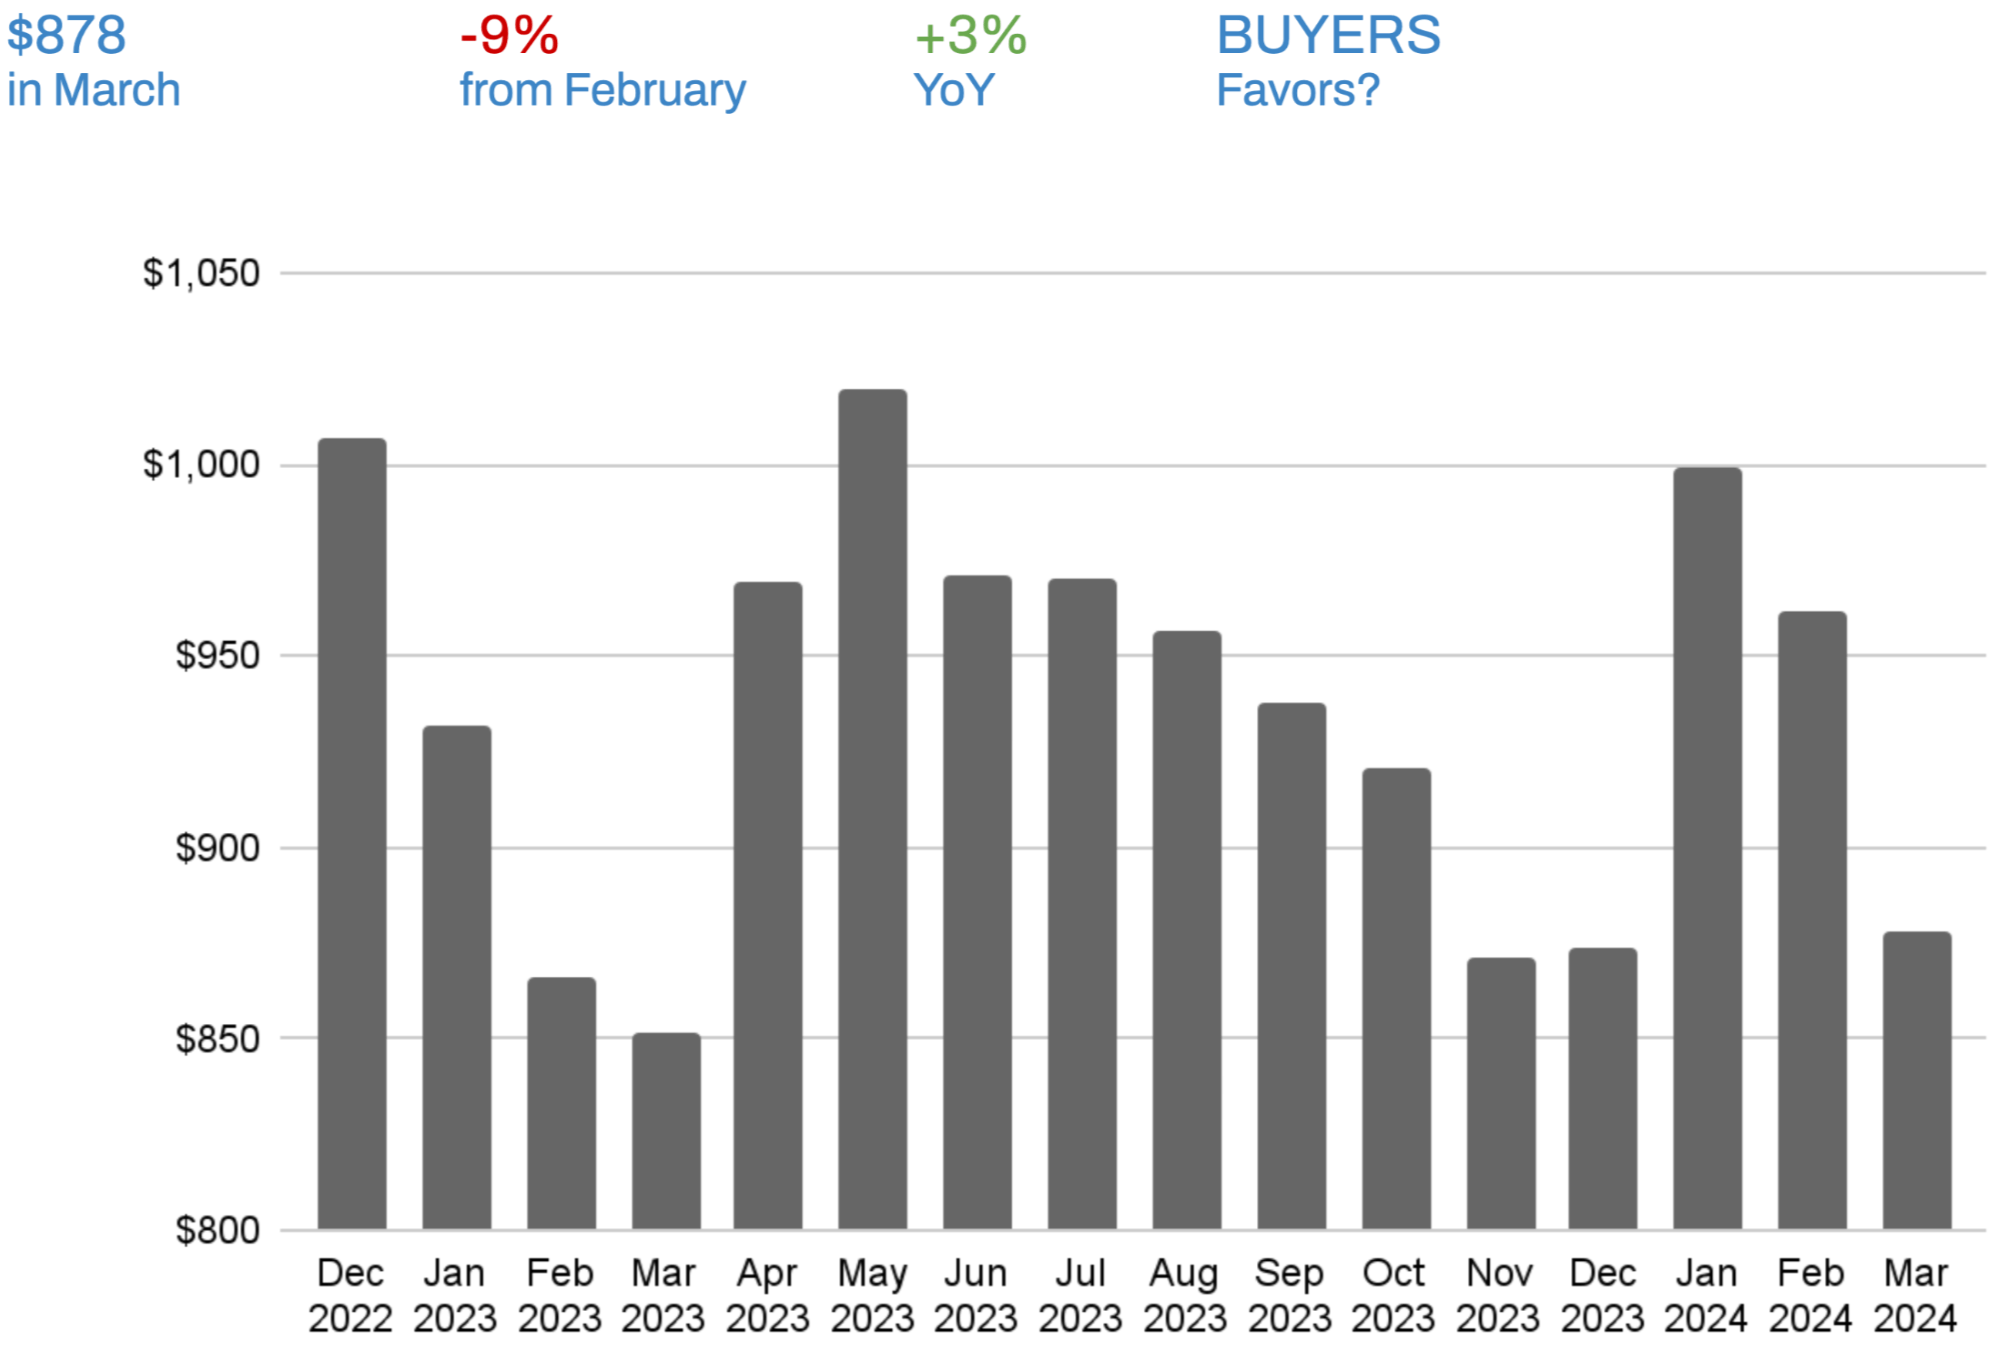
Although the median price per square foot decreased 9% compared to the previous month, it remains 3% higher than last year. The recent price decrease might give buyers temporary leverage when negotiating with sellers.
What Does This Mean for:
- BUYERS: Prices decreased in the short term, giving buyers potentially a momentary window of opportunity, but prices remain higher than last year.
- SELLERS: Prices moved against their favor in the short term but in their favor compared to last year.
Anticipate price increases in April and May as leverage transitions from buyers towards sellers. Sellers have more pricing power largely due to the strong demand and limited supply. Buyers should be prepared for a competitive market and bidding wars on accurately priced properties.
Brooklyn Median Listing Discount
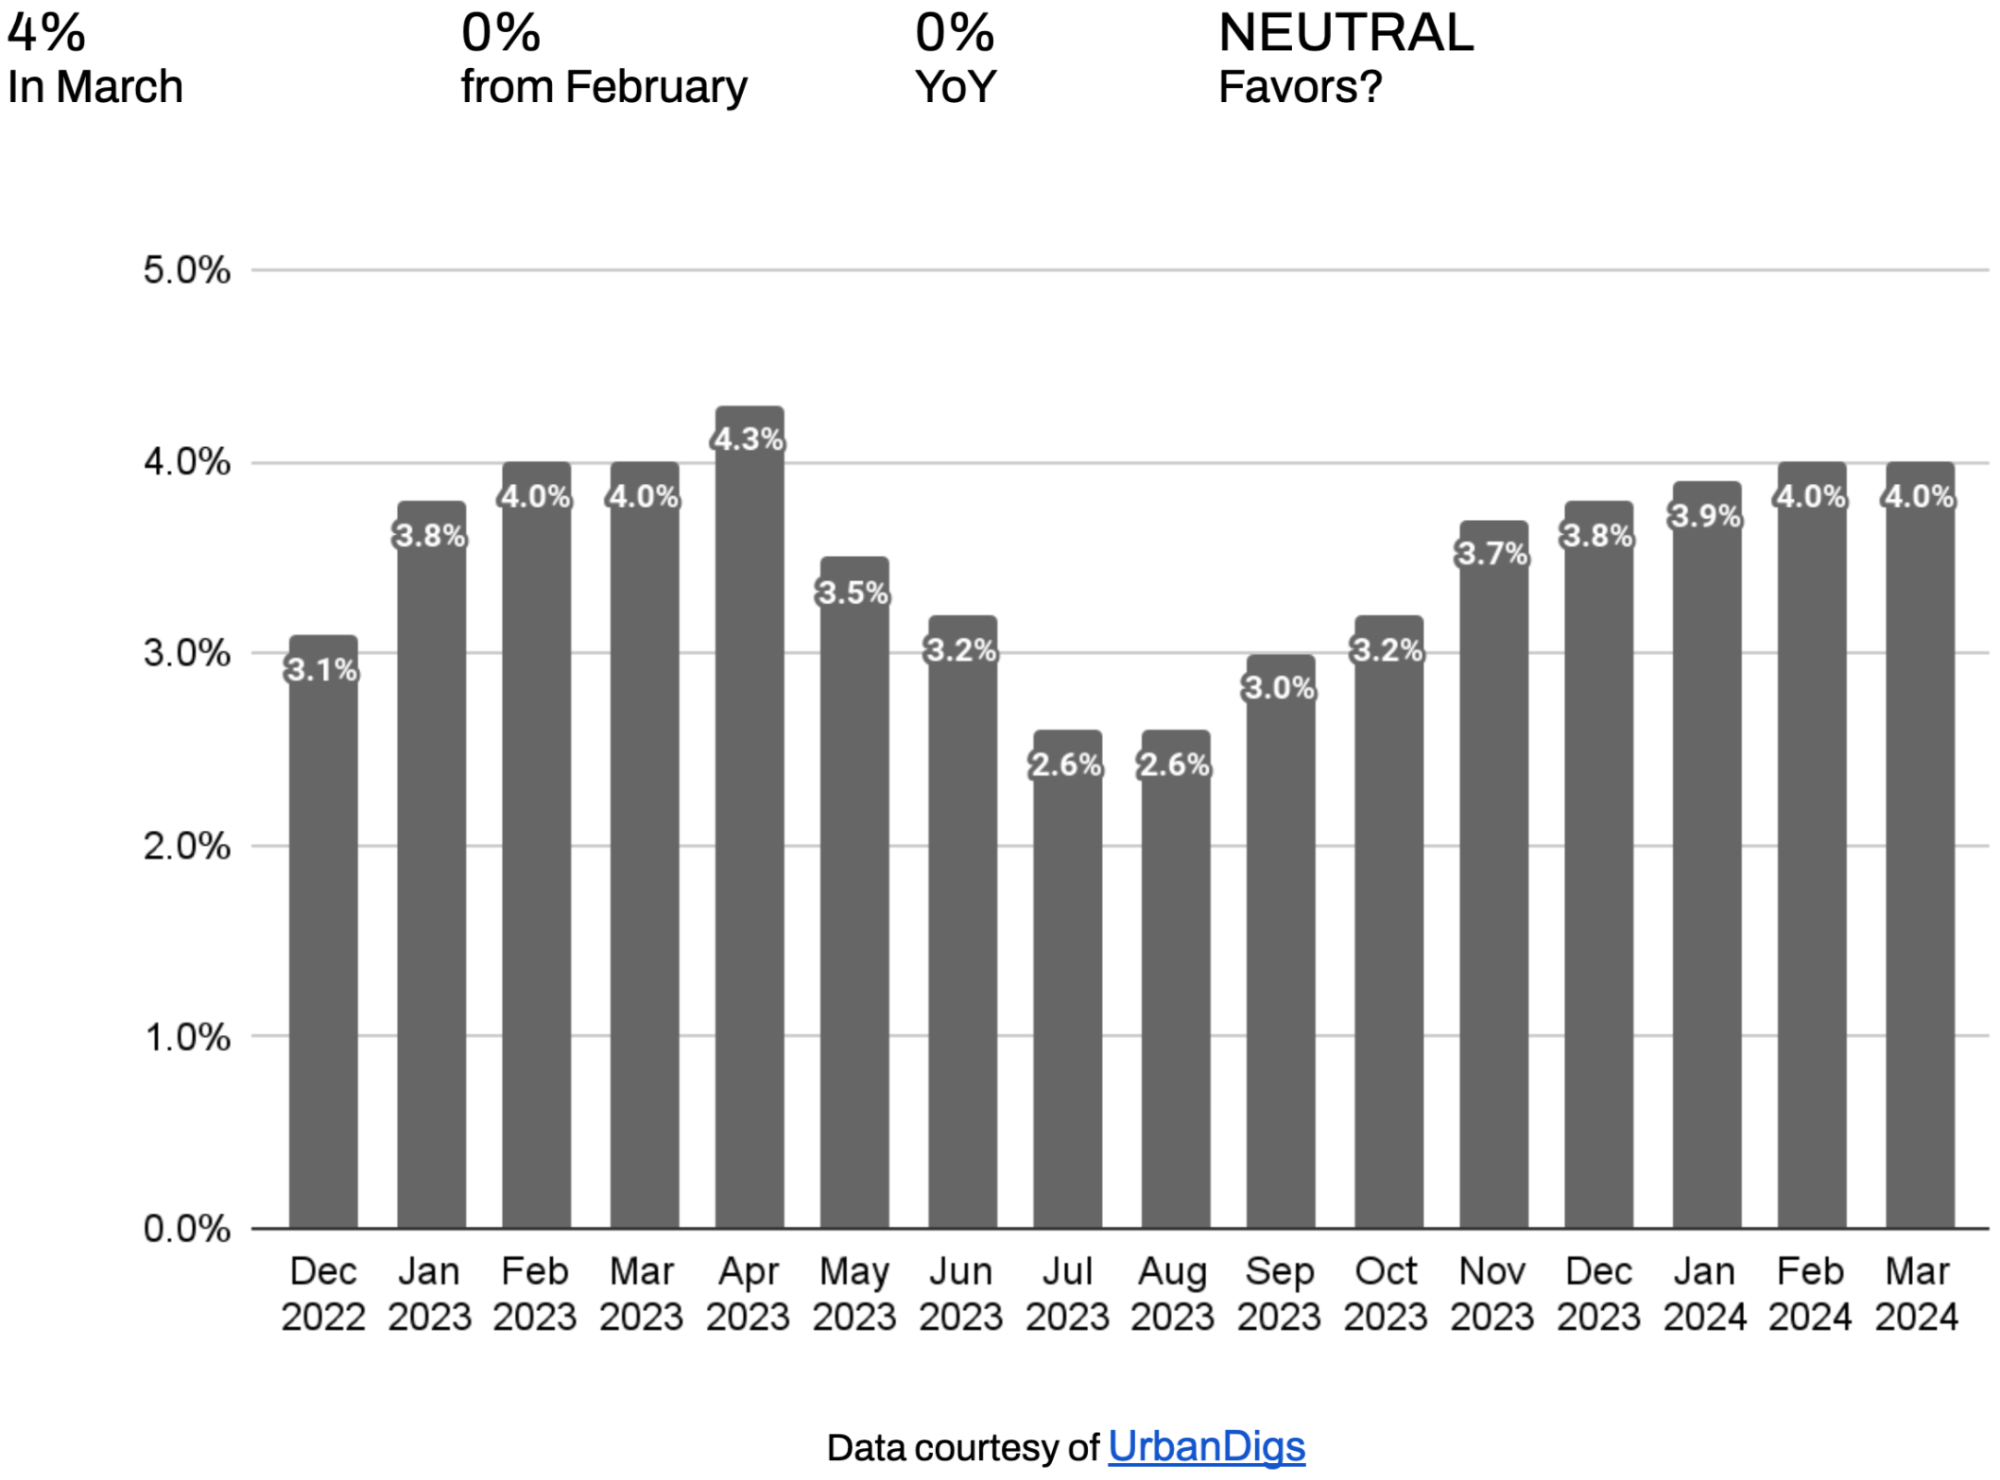
The median listing discount in March has remained the same compared to February, indicating a potential peak in listing discounts.
What Does This Mean for:
- BUYERS: Despite the listing discount remaining unchanged from February, buyers face a slightly more challenging environment due to heightened competition. We may have reached the peak in listing discounts for this cycle.
- SELLERS: In general, sellers hold a slight advantage over buyers this month, and the listing discount may be peaking.
Monitor this metric in the coming months, and look for a ceiling to be established, followed by a decrease in the median listing discount. Declining discounts typically foreshadow rising prices.
Rental Remarks
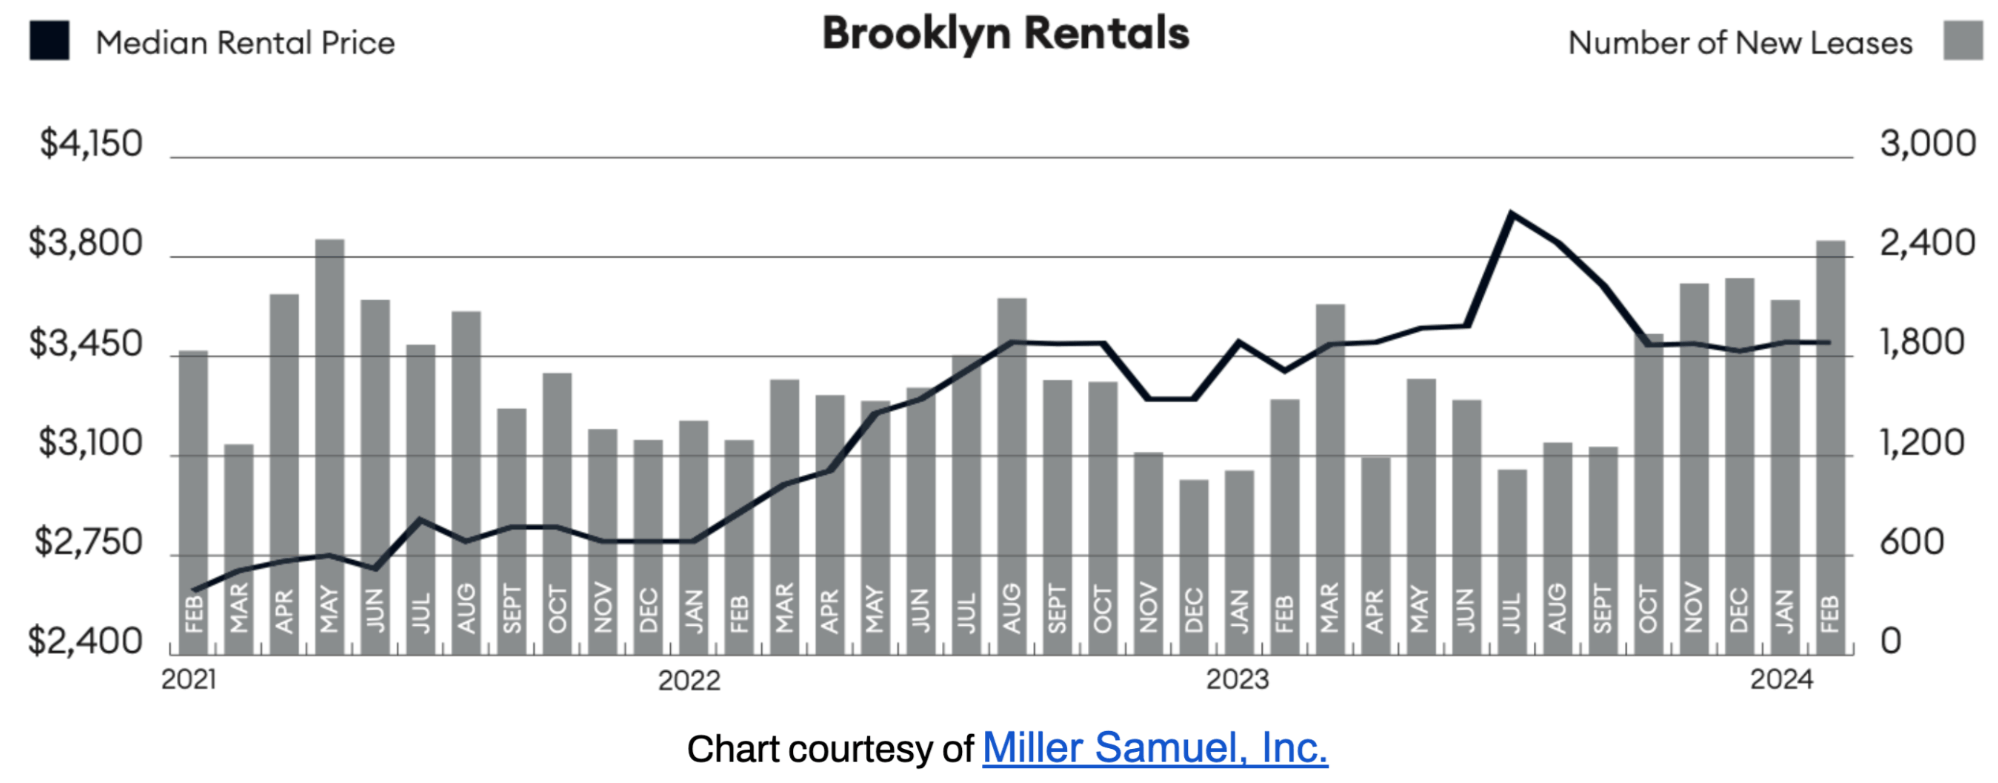
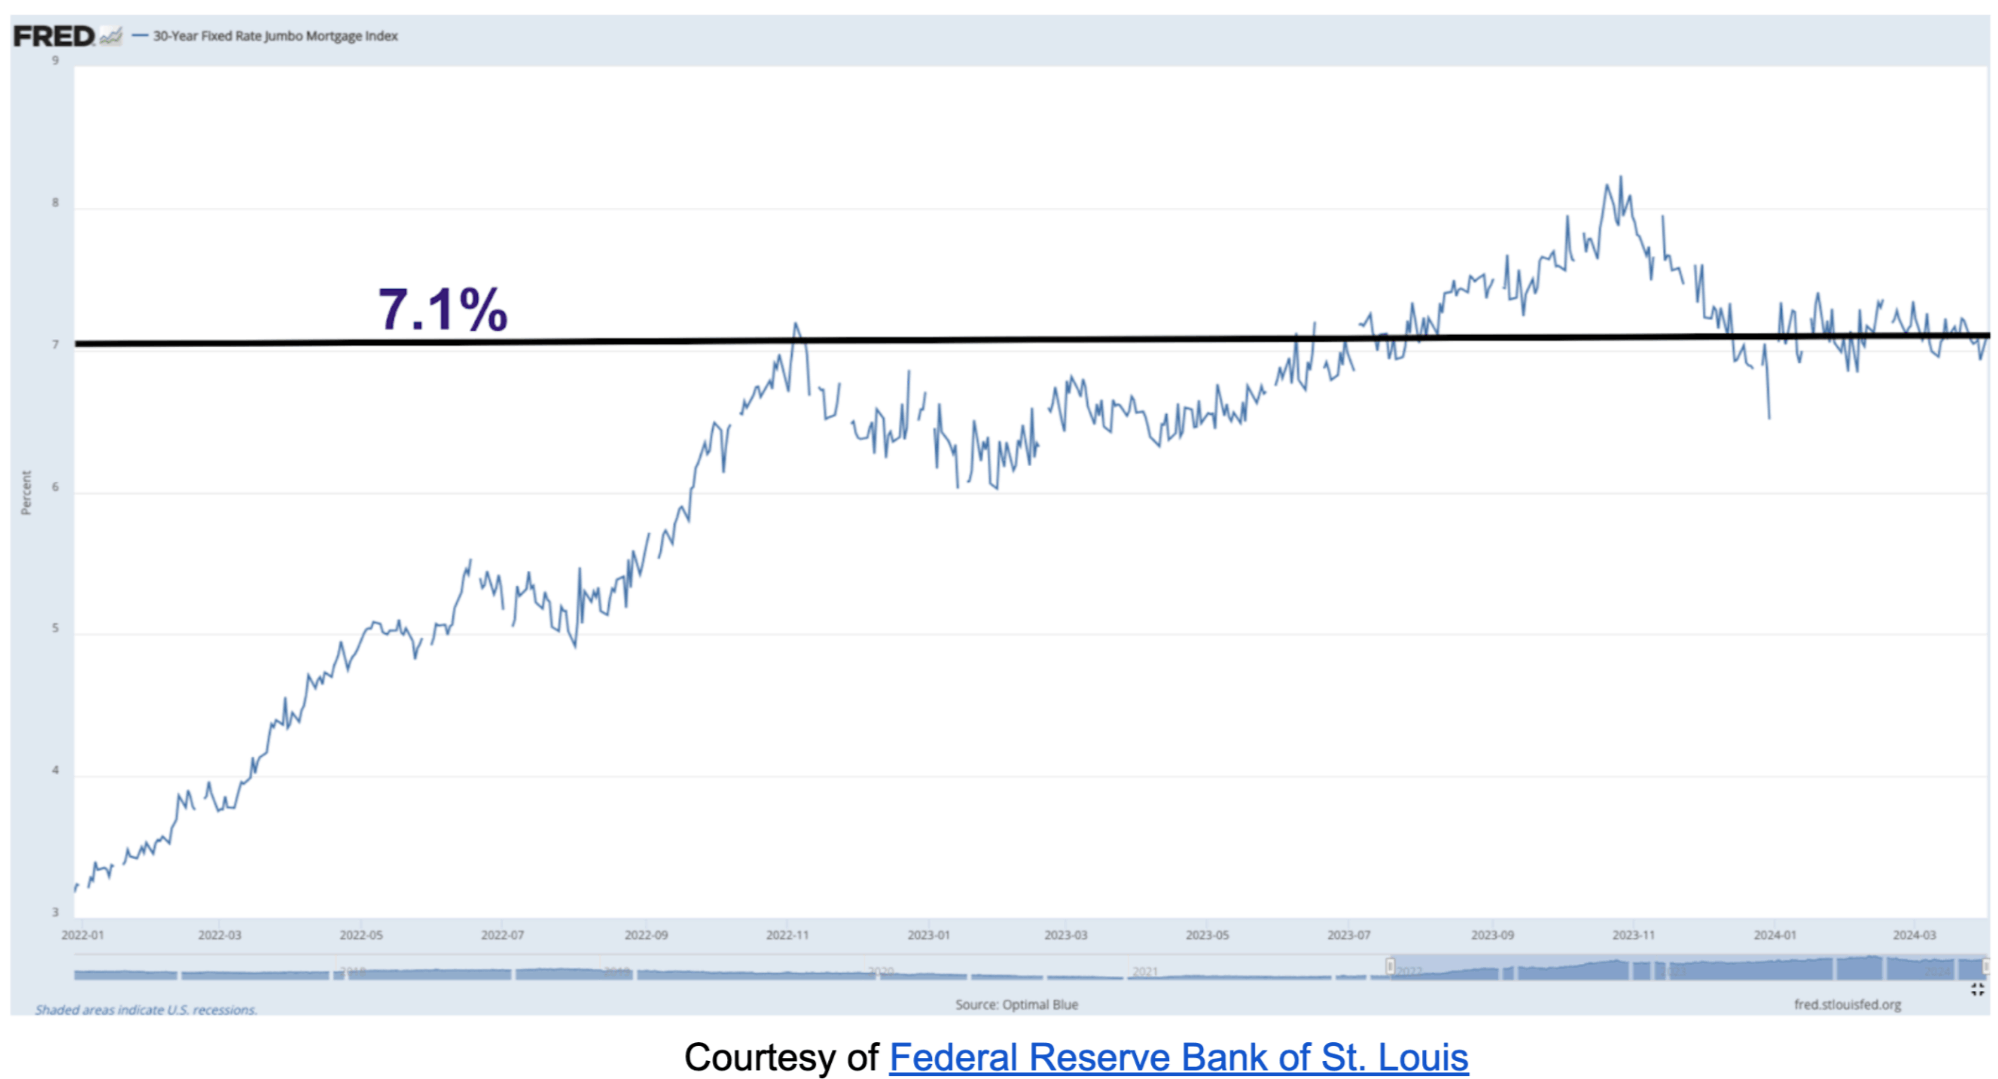
In February, the median rent remained unchanged from January, staying at $3,5005. It will likely steadily rise as we head into April and May, as the peak rental season typically occurs during the summer. The 30-Year Fixed Rate JUMBO Mortgage Index6 is trending at 7.1%, and the average JUMBO APR is 6.76%7. So, it’s a “catch-22” for renters, as the rent versus buy scale may feel equally punitive on both sides.
Investor Insights
The total return is driven by net rental income and capital appreciation. Brooklyn's cap rate is approximately 3.0 - 3.4% for all-cash investors. Unfortunately, there is no net income potential for those investors using a large percentage of leverage, with the average JUMBO mortgage APR at 6.76%. As the chart below illustrates, there was neither a discernable drop in median PPSF nor a rebound due toCOVID-19D. So, future price inflation will generate any potential for future capital appreciation. Timing and a strong USD may afford foreign investors, depending on their native currency, the opportunity to realize significant capital gains upon selling their assets.
References
- According to the Elegran | Forbes Global Properties Brooklyn Leverage Index
- Data courtesy of Miller Samuel, Inc.
- JUMBO mortgage rate APR data courtesy of Bank of America, Chase, and Wells Fargo
- Data courtesy of UrbanDigs
- Data courtesy of Miller Samuel, Inc.
- Data courtesy of Federal Reserve Bank of St. Louis
- JUMBO mortgage rate APR data courtesy of Bank of America, Chase, and Wells Fargo