
Brooklyn Market Update: Equilibrium is Not Neutrality
Sales Insights
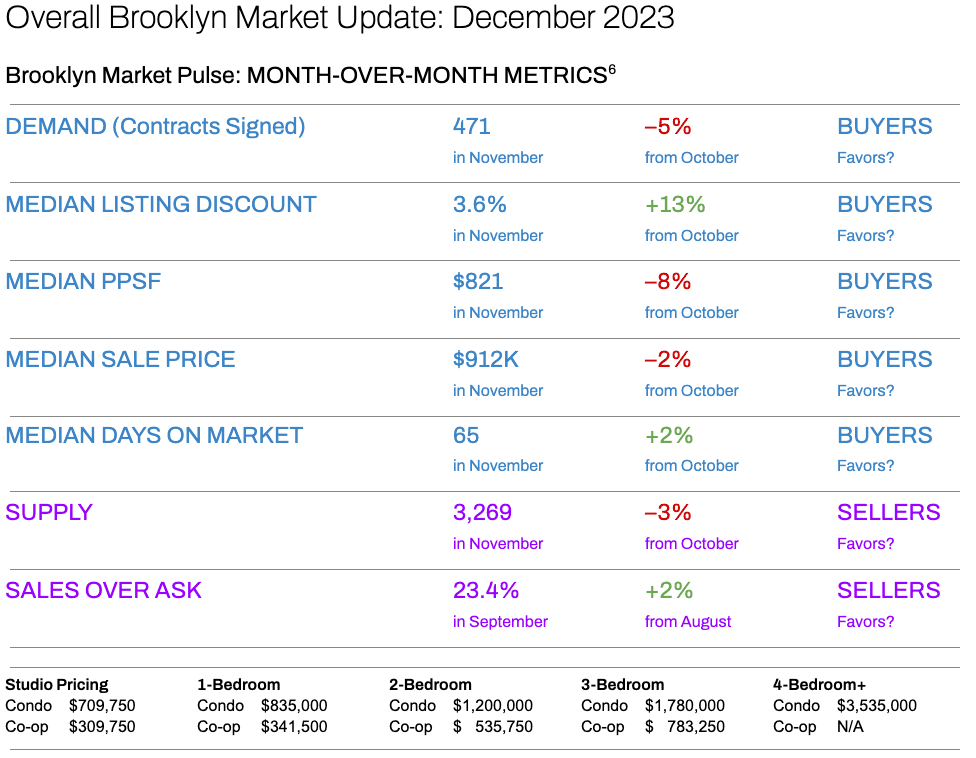
“Neutral” markets don’t exist because buyers and sellers constantly play tug-of-war for leverage. There's no clear winner over the past 9 months as buyers & sellers reach equilibrium.1
- Last month, sellers had an advantage.
- This month, buyers possessed the edge:
- Demand (measured by contracts signed) was down, in their favor.
- The Median Listing Discount was up, in their favor.
- Median PPSF (Price Per Square Foot) was down, in their favor.
- Median Sale Price was down, in their favor.
- Median Days on Market was up, in their favor
- Demand (measured by contracts signed) was down, in their favor.
Rental Insights
From July’s record of $3,950, median rent has cooled to $3,4902, yet is still high for the borough.
- The rent versus buy scale may feel equally punitive on both sides, with rents near all-time highs.
- Mortgage rates are near their decades-long high as well.3
Investment Insights
Total return is generated by net rental income & price appreciation.
- All-cash buyers can expect a cap rate near 3%.
- Since the average JUMBO mortgage rate APR is 6.862%4, there is no net rental income on
- Leveraged purchases.
- Due to COVID-19, there was neither a discernible drop in median PPSF nor a rebound.5 Any potential for future capital appreciation will be generated by future price inflation.
- Depending on when they purchased and their national currency, foreign investors may experience a robust return upon sale.
Data courtesy of UrbanDigs
Elegran | Forbes Global Properties Brooklyn Leverage Index
The Elegran | Forbes Global Properties Brooklyn Leverage Index is powered by four key metrics and how they've been trending over the last month: SUPPLY, DEMAND, MEDIAN LISTING DISCOUNT, and MEDIAN PRICE/SF.
The index informs us who holds the upper hand in real estate transactions—buyers or sellers. Looking at the graph below, this is indicated by the direction of the curve, where:
- An increasing trend from left to right indicates a seller’s market
- A decreasing trend from left to right indicates a buyer’s market
Our indicator also informs us regarding the relative strength of that leverage, indicated by the slope of the curve, where:
- A gentle slope indicates a weak advantage by one party over the other
- A sharp slope indicates a strong advantage.
The graph shows that leverage in November is back to where it started in February. But the curve between has been anything but flat, as there has been an intense leverage tug-of-war between buyers and sellers. Last month, sellers pulled the metaphorical rope in their direction. This month, buyers gained back that ground.
Let's now dive into the specifics of the market forces and examine the intricate dynamics shaping the market.

Brooklyn Supply

Brooklyn supply has followed a similar cadence for the past three years, as the chart above clarifies. The metric declined this November, as it has in past Novembers.
What Does This Mean for?
- BUYERS? Supply, which peaked in October, is retreating.
- SELLERS? Competition, which peaked in October, is retreating.
Brooklyn Demand

After demand (measured by contracts signed) bounced back nearly 25% in October, it gave back some of those gains in November.
What Does This Mean for?
- BUYERS? Less competition.
- SELLERS? Less activity.
Brooklyn Median Price/SF

The median PPSF is at the lowest point in the past 12 months and down 20% from May’s high.
What Does This Mean for?
- BUYERS? Prices are quickly moving in their favor.
- SELLERS? Prices are quickly moving against their interests.
Brooklyn Median Listing Discount

Median listing discounts have been oscillating around 3% all year. Since August, the metric has steadily increased.
What Does This Mean for?
- BUYERS? Discounts are moving in their favor.
- SELLERS? Discounts are moving against their interests.
Rental Remarks
On October6, the median rent in Brooklyn cooled slightly from the summer high but remains near record highs. The 30-Year Fixed Rate JUMBO Mortgage Index7 is trending at 7.6%, and the average JUMBO APR is 6.862%8. So, it’s a “catch-22” for renters, as the rent versus buy scale may feel equally punitive on both.

Investor Insights
The total return is driven by net rental income and capital appreciation. For all-cash investors, Brooklyn's cap rate is approximately 3.0%. Unfortunately, for those investors using a large percentage of leverage, there is no net income potential, with the average JUMBO mortgage APR at 6.862%. On the sell side, the COVID-19 rebound is now fully realized, so any potential for future capital appreciation will be generated by future price inflation. Timing and a strong USD may afford foreign investors, depending on their native currency, the opportunity to realize significant capital gains upon selling their assets.

Chart courtesy of UrbanDigs and indicates Brooklyn median PPSF as a function of the closed sale date. The light gray area to the extreme right indicates incomplete data, and the orange line indicates the most recent median PPSF based on data considered complete.
- According to the Elegran | Forbes Global Properties Manhattan Leverage Index
- Data courtesy of Miller Samuel, Inc.
- Mortgage data courtesy of fred.stlouisfed.org
- JUMBO mortgage rate APR data courtesy of Bank of America, Chase, and Wells Fargo
- Data courtesy of UrbanDigs
- November 2023 data is not yet available.
- Data courtesy of Federal Reserve Bank of St. Louis
- JUMBO mortgage rate APR data courtesy of Bank of America, Chase, and Wells Fargo