
Overall Brooklyn Market Update: February 2024
Data courtesy of UrbanDigs
February Brooklyn Market Update: A Small Advantage for Buyers
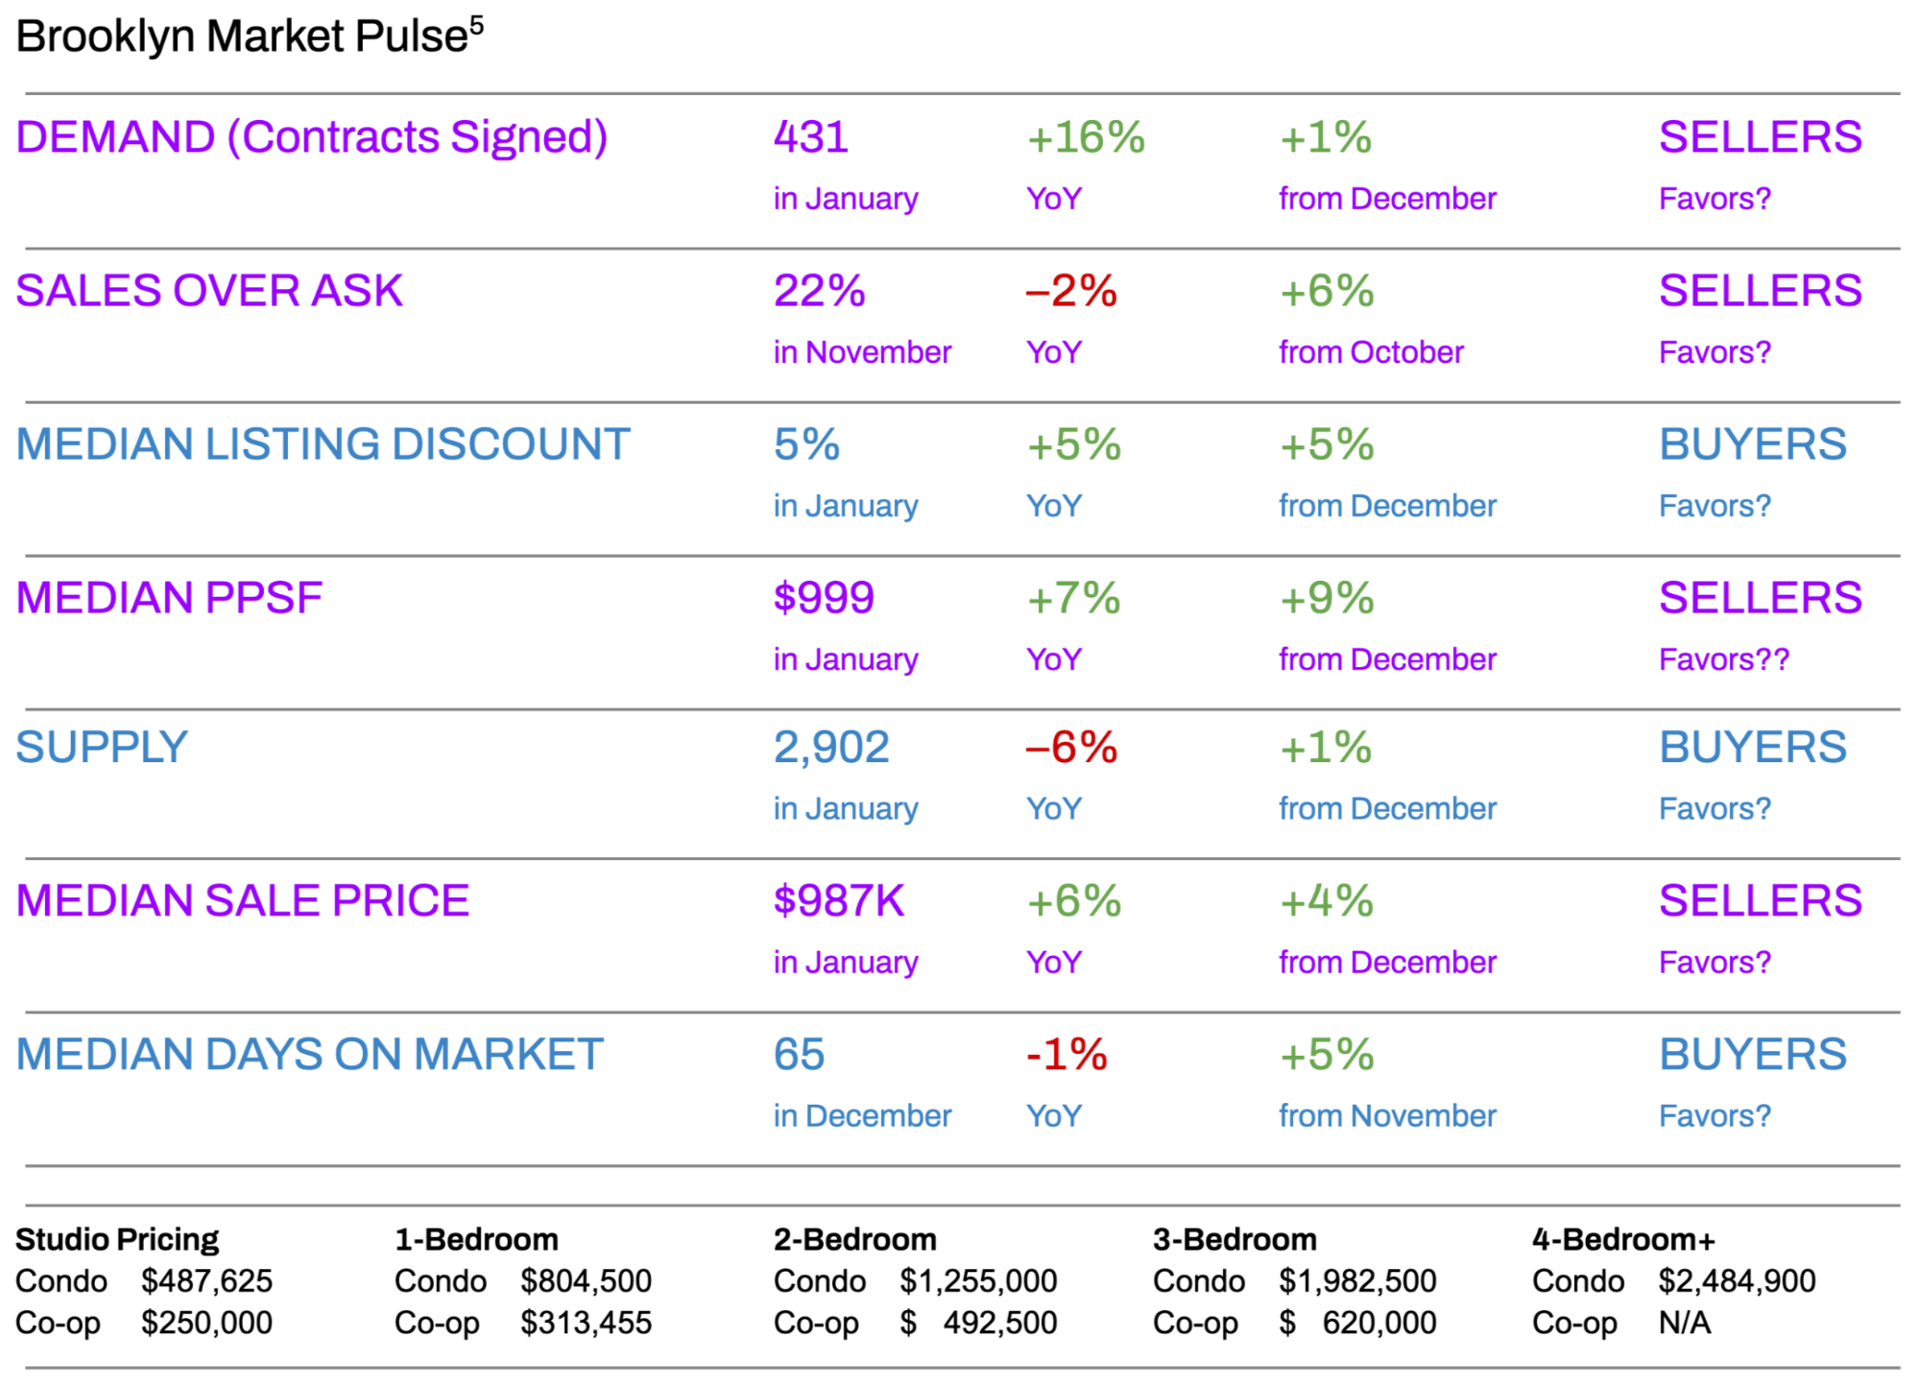
The Brooklyn real estate market kicked off 2024 with a 16% increase in contract activity compared to January 2023 and 1% more contracts than were signed the previous month. While supply typically sees a seasonal uptick in January, it has only increased by 1% compared to the previous month and is 6% lower than last year.
One significant driver behind this upswing is declining mortgage interest rates, which have enticed more buyers to re-enter the market. With this promising start, 2024 is shaping up to be a year of increased contract activity in Brooklyn.
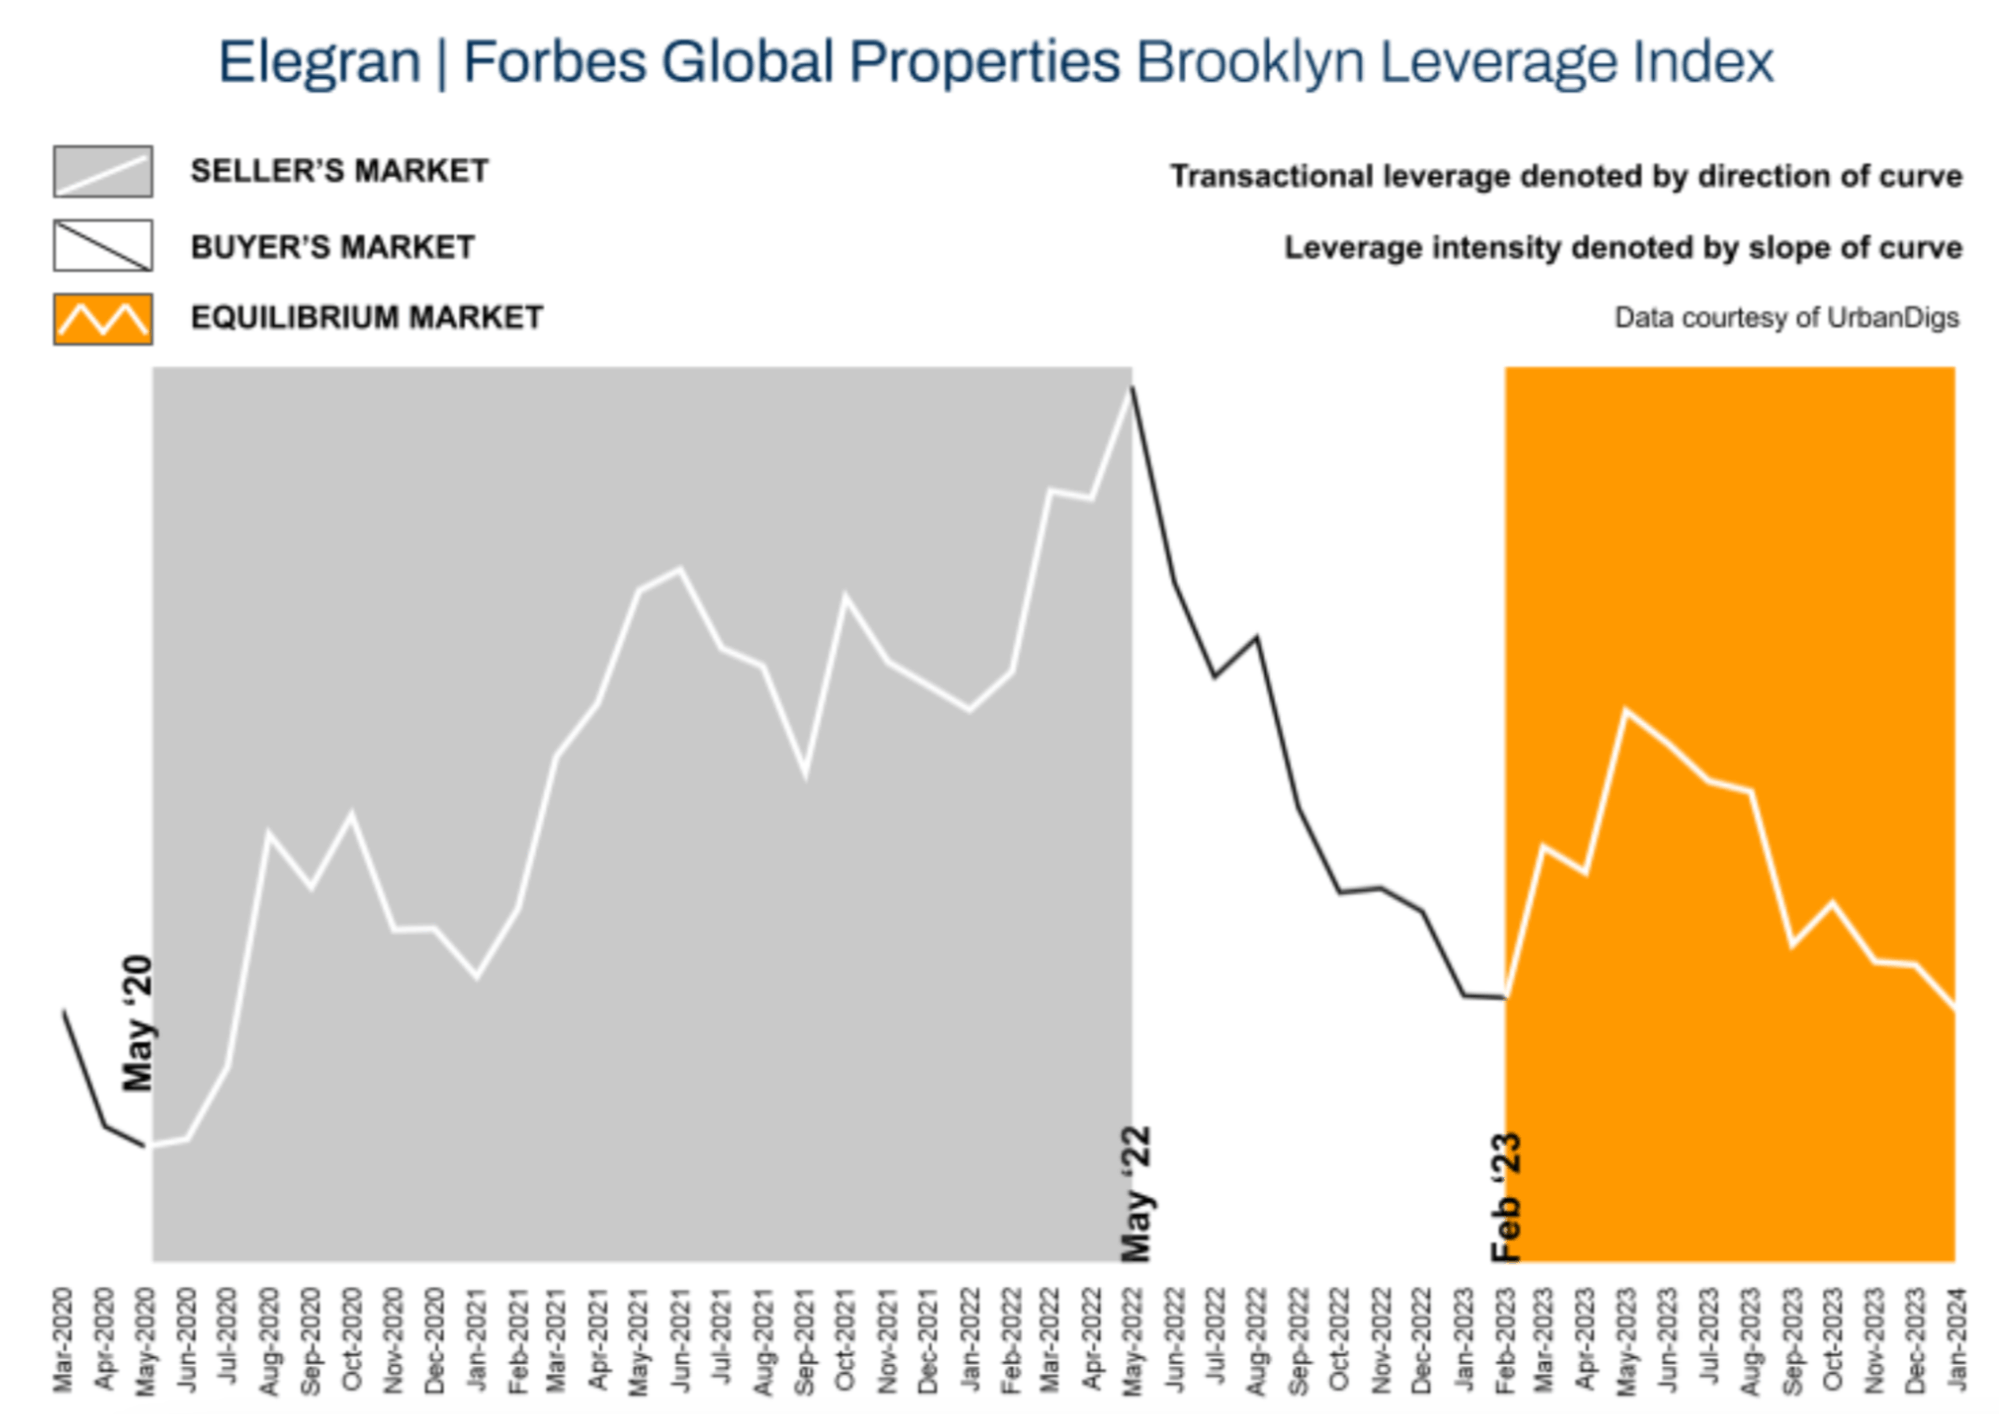
The Elegran | Forbes Global Properties Brooklyn Leverage Index indicates that the leverage dynamics are leaning somewhat toward buyers, although the metrics suggest a relatively balanced market between buyers and sellers.
Sales
“Neutral” markets don’t exist because buyers and sellers are constantly playing tug-of-war for leverage. At times (e.g., the past 10 months), there’s no clear winner as buyers & sellers reach equilibrium.1
- Based on the data, buyers have a small advantage this month.
- Demand (measured by contracts signed) increased slightly in the seller’s favor.
- Supply increased slightly in the buyer’s favor.
- Median PPSF (Price Per Square Foot) increased in the seller’s favor.
- Median listing discount increased in the buyer’s favor.
Rentals
- From July’s record of $3,950, median rent has cooled to $3,4692, yet is still high for the borough.
- Rents have retreated from recent all-time highs, and the rental market is experiencing a seasonal softening, with rental asking prices decreasing slightly and some apartments offering concessions.
- The rent versus buy scale may feel equally punitive on both sides, with rents near all-time highs and mortgage rates near their decades-long high as well.3
Investments
- Total return is generated by net rental income & price appreciation.
- All-cash buyers can expect a cap rate approaching 3%.
- Since the average JUMBO mortgage rate APR is 6.36%4, there is no net rental income on leveraged purchases.
Elegran | Forbes Global Properties Brooklyn Leverage Index
The Elegran | Forbes Global Properties Brooklyn Leverage Index is powered by four indicators: supply, demand, median price per square foot (PPSF), and median listing discount.
It informs us whether the current is a buyer’s or a seller’s market, i.e., which party possesses transactional leverage. Looking at the graph below, this is indicated by the direction of the curve, where:
- An increasing trend from left to right indicates a seller’s market
- A decreasing trend from left to right indicates a buyer’s market
Our indicator also informs us regarding the relative strength of that leverage, indicated by the slope of the curve, where:
- A gentle slope indicates a weak advantage by one party over the other
- A sharp slope indicates a strong advantage.
The graph shows that the leverage in January is essentially the same as in February 2023. But the curve has been anything but flat, as there has been an intense leverage tug-of-war between buyers and sellers. While leverage trends toward buyers, the metrics are split as to whether they favor buyers or sellers.
Brooklyn Supply
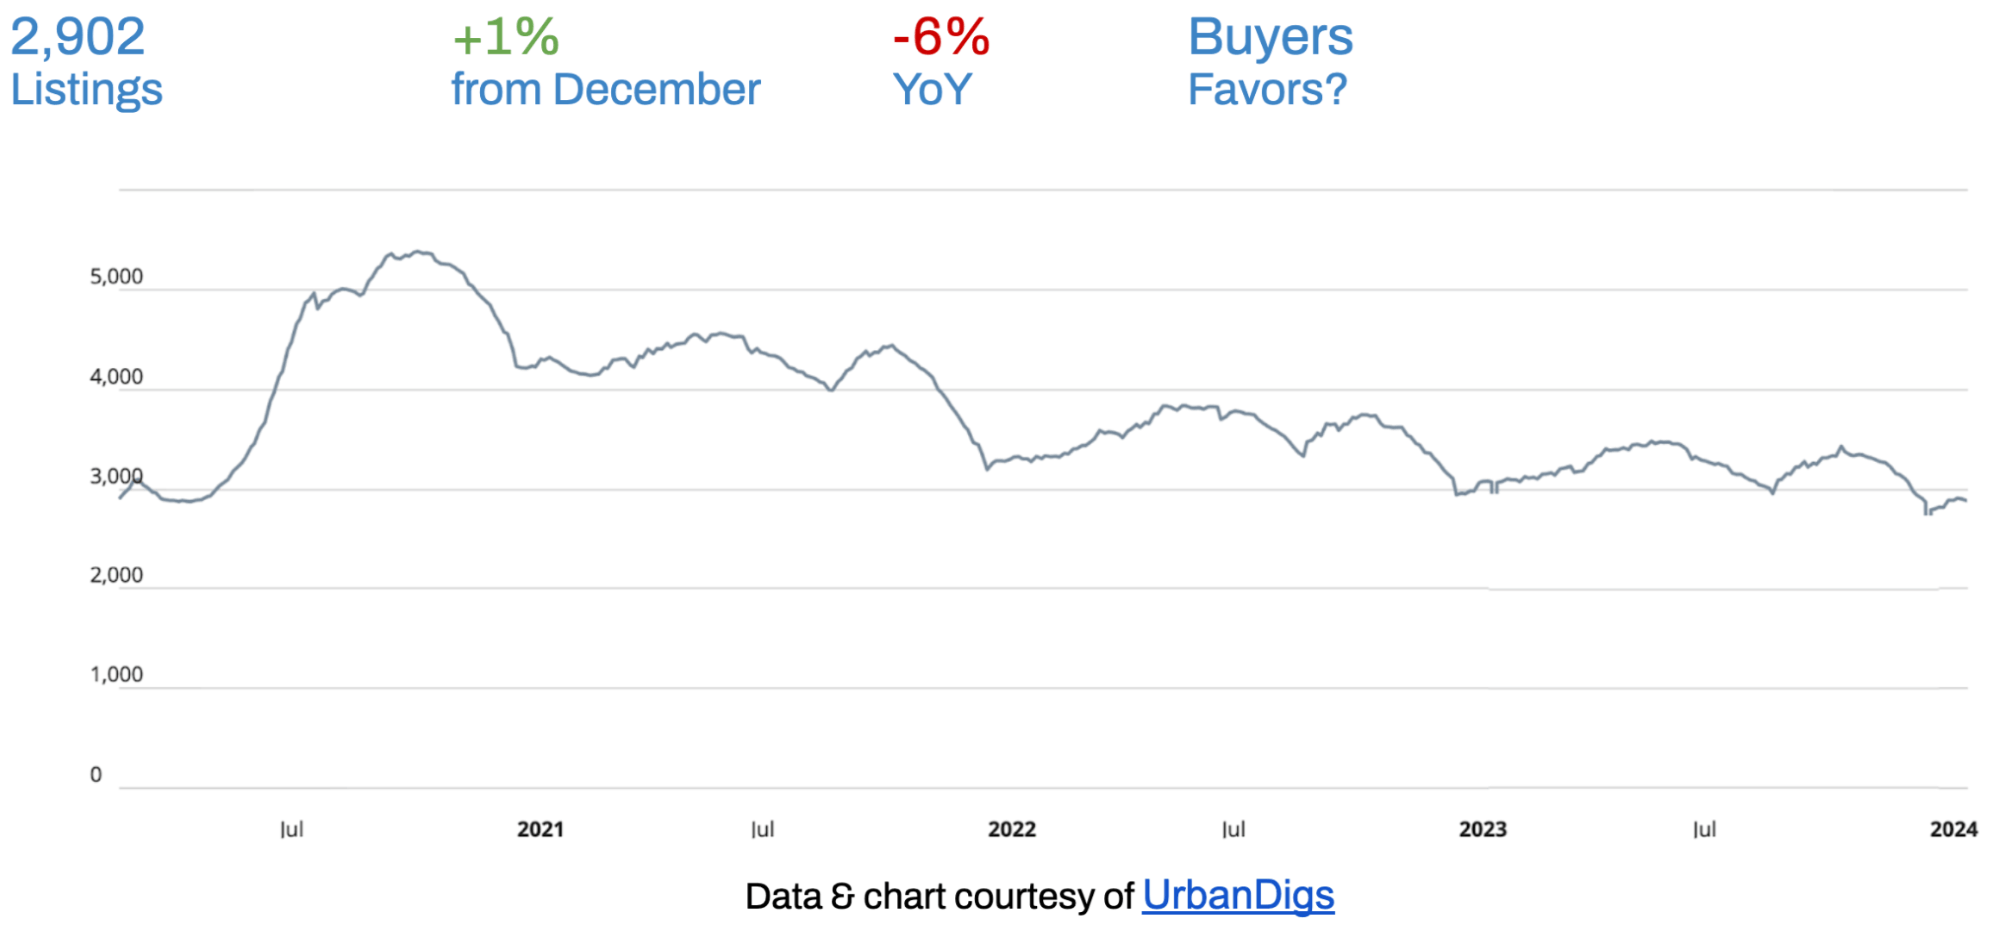
The chart above illustrates that Brooklyn Supply has maintained a consistent cadence over the past three years. While the metric increased by 1% in January, it is noteworthy that, in a year-over-year comparison with January 2023, overall supply declined by 6%.
What Does This Mean for:
- BUYERS: When supply increases, there's more inventory to choose from. Supply is slowly increasing as the spring season approaches, but supply is lower than last year's period.
- SELLERS: The more inventory on the market, the more competition a seller faces. As supply increases heading into the spring, sellers will face increasing competition.
Anticipate a rise in supply during February, providing buyers with more options while increasing seller competition.
Brooklyn Demand
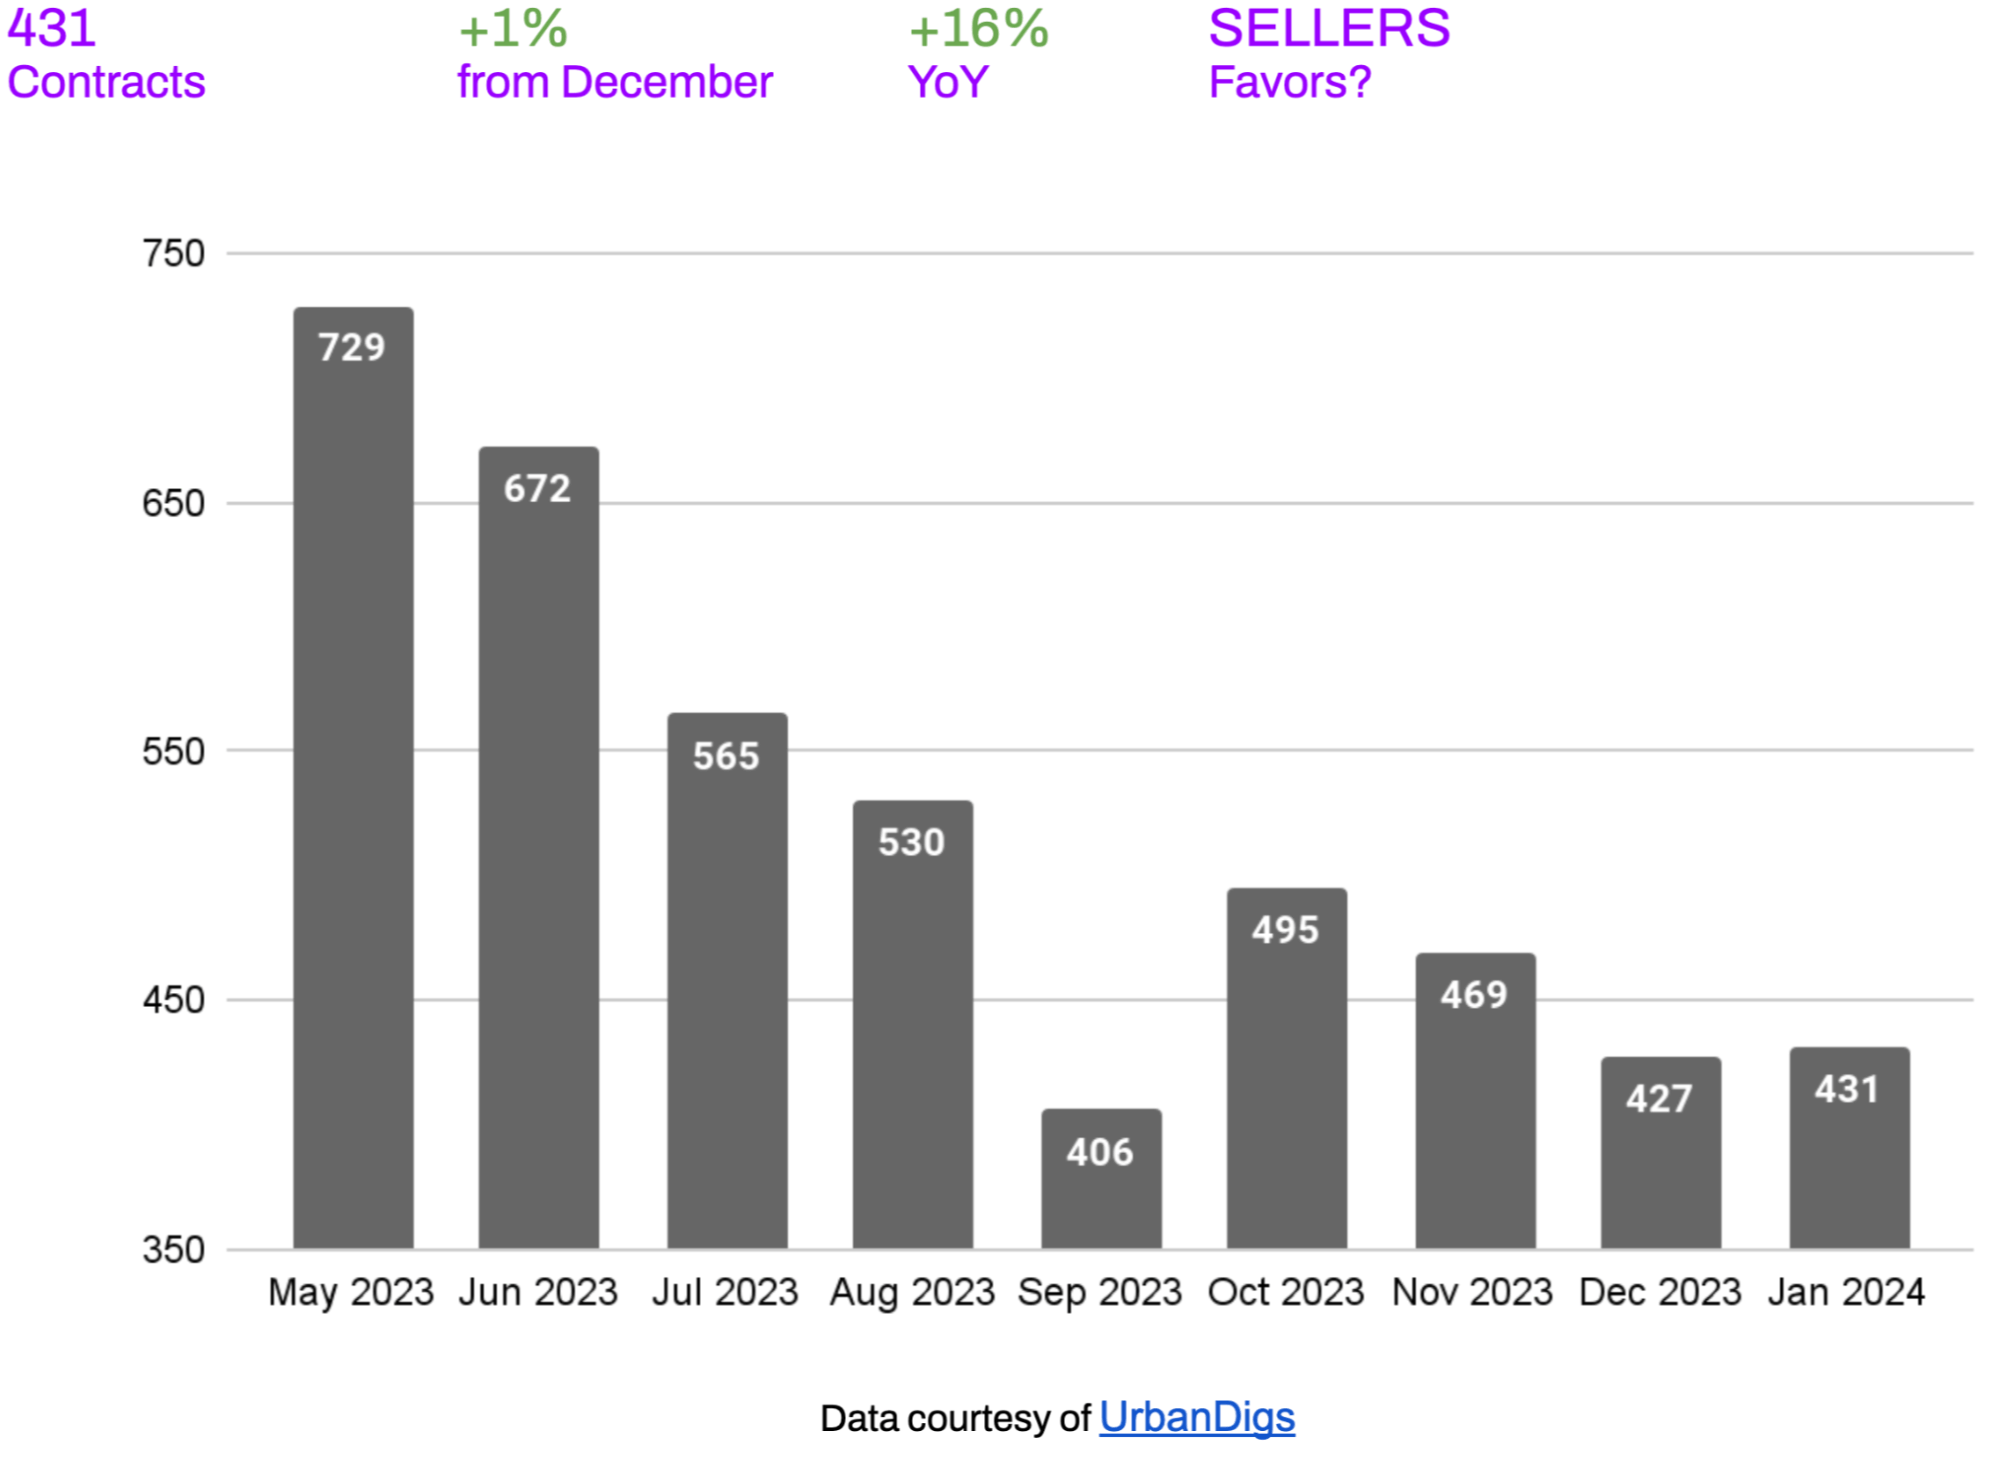
After a decrease in December 2023, demand, measured by contracts signed, bounced back and increased in January 2024. Contract activity was 16% higher in January 2024 than in January 2023, largely because declining mortgage interest rates pulled some buyers off the sidelines.
What Does This Mean for:
- BUYERS: More competition.
- SELLERS: More activity.
Anticipate a continued upswing in contract activity over the coming months, as spring is traditionally the peak season for Brooklyn's real estate market.
Brooklyn Median PPSF
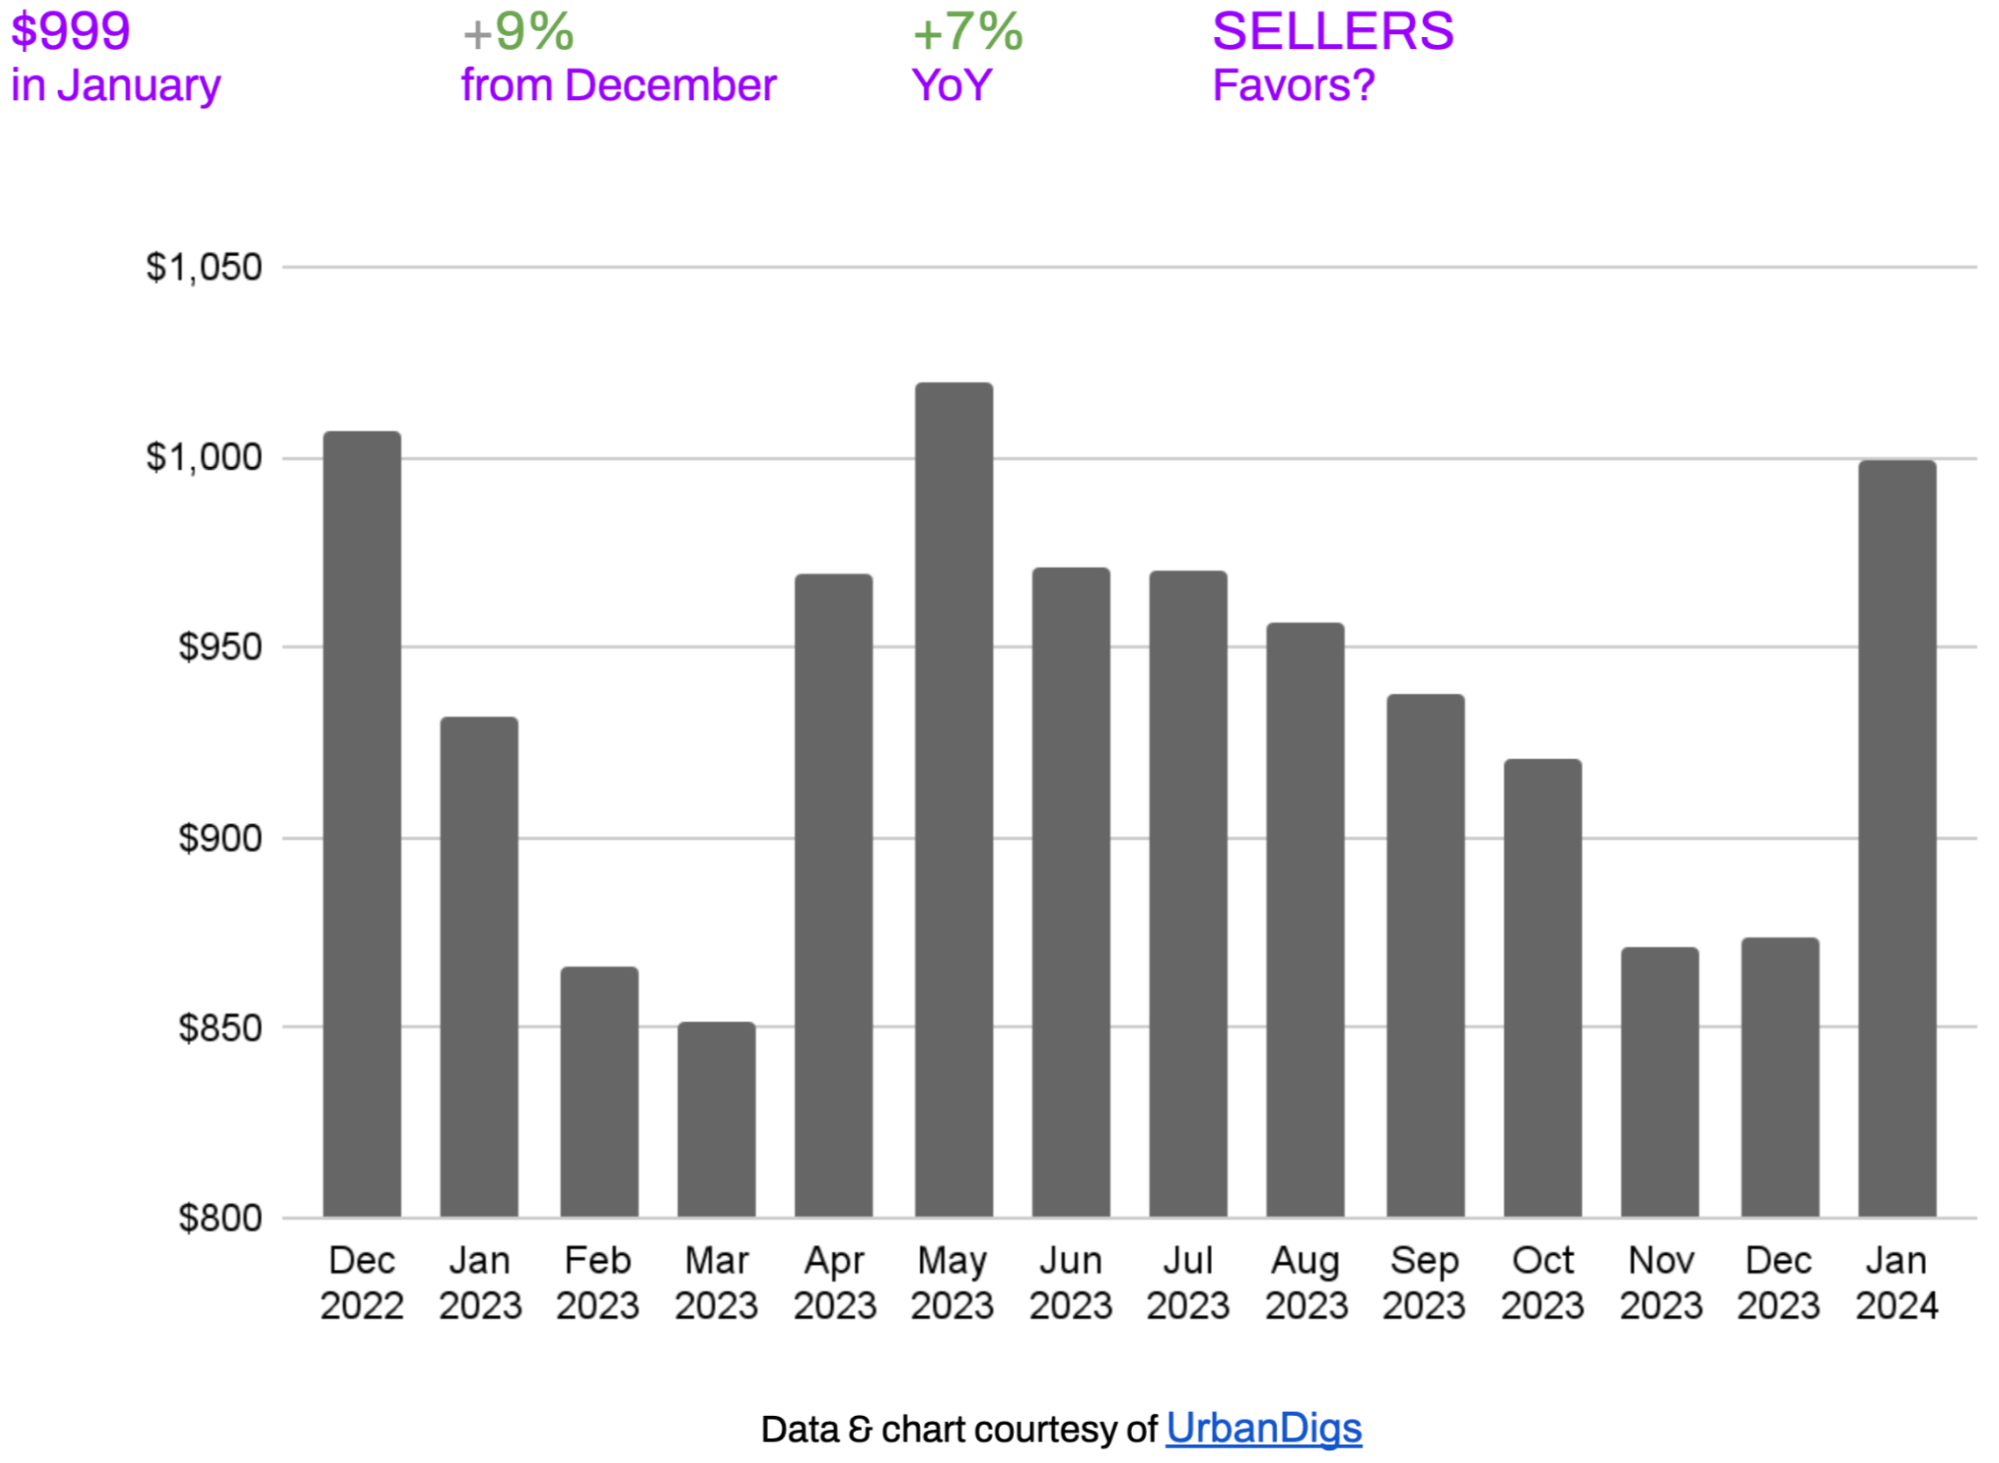
The median price per square foot in January has increased by 9% compared to the prior month and is 7% higher than last year.
What Does This Mean for:
- BUYERS: Prices increased, making it more expensive to purchase property.
- SELLERS: Prices moved in their favor.
Brooklyn Median Listing Discount
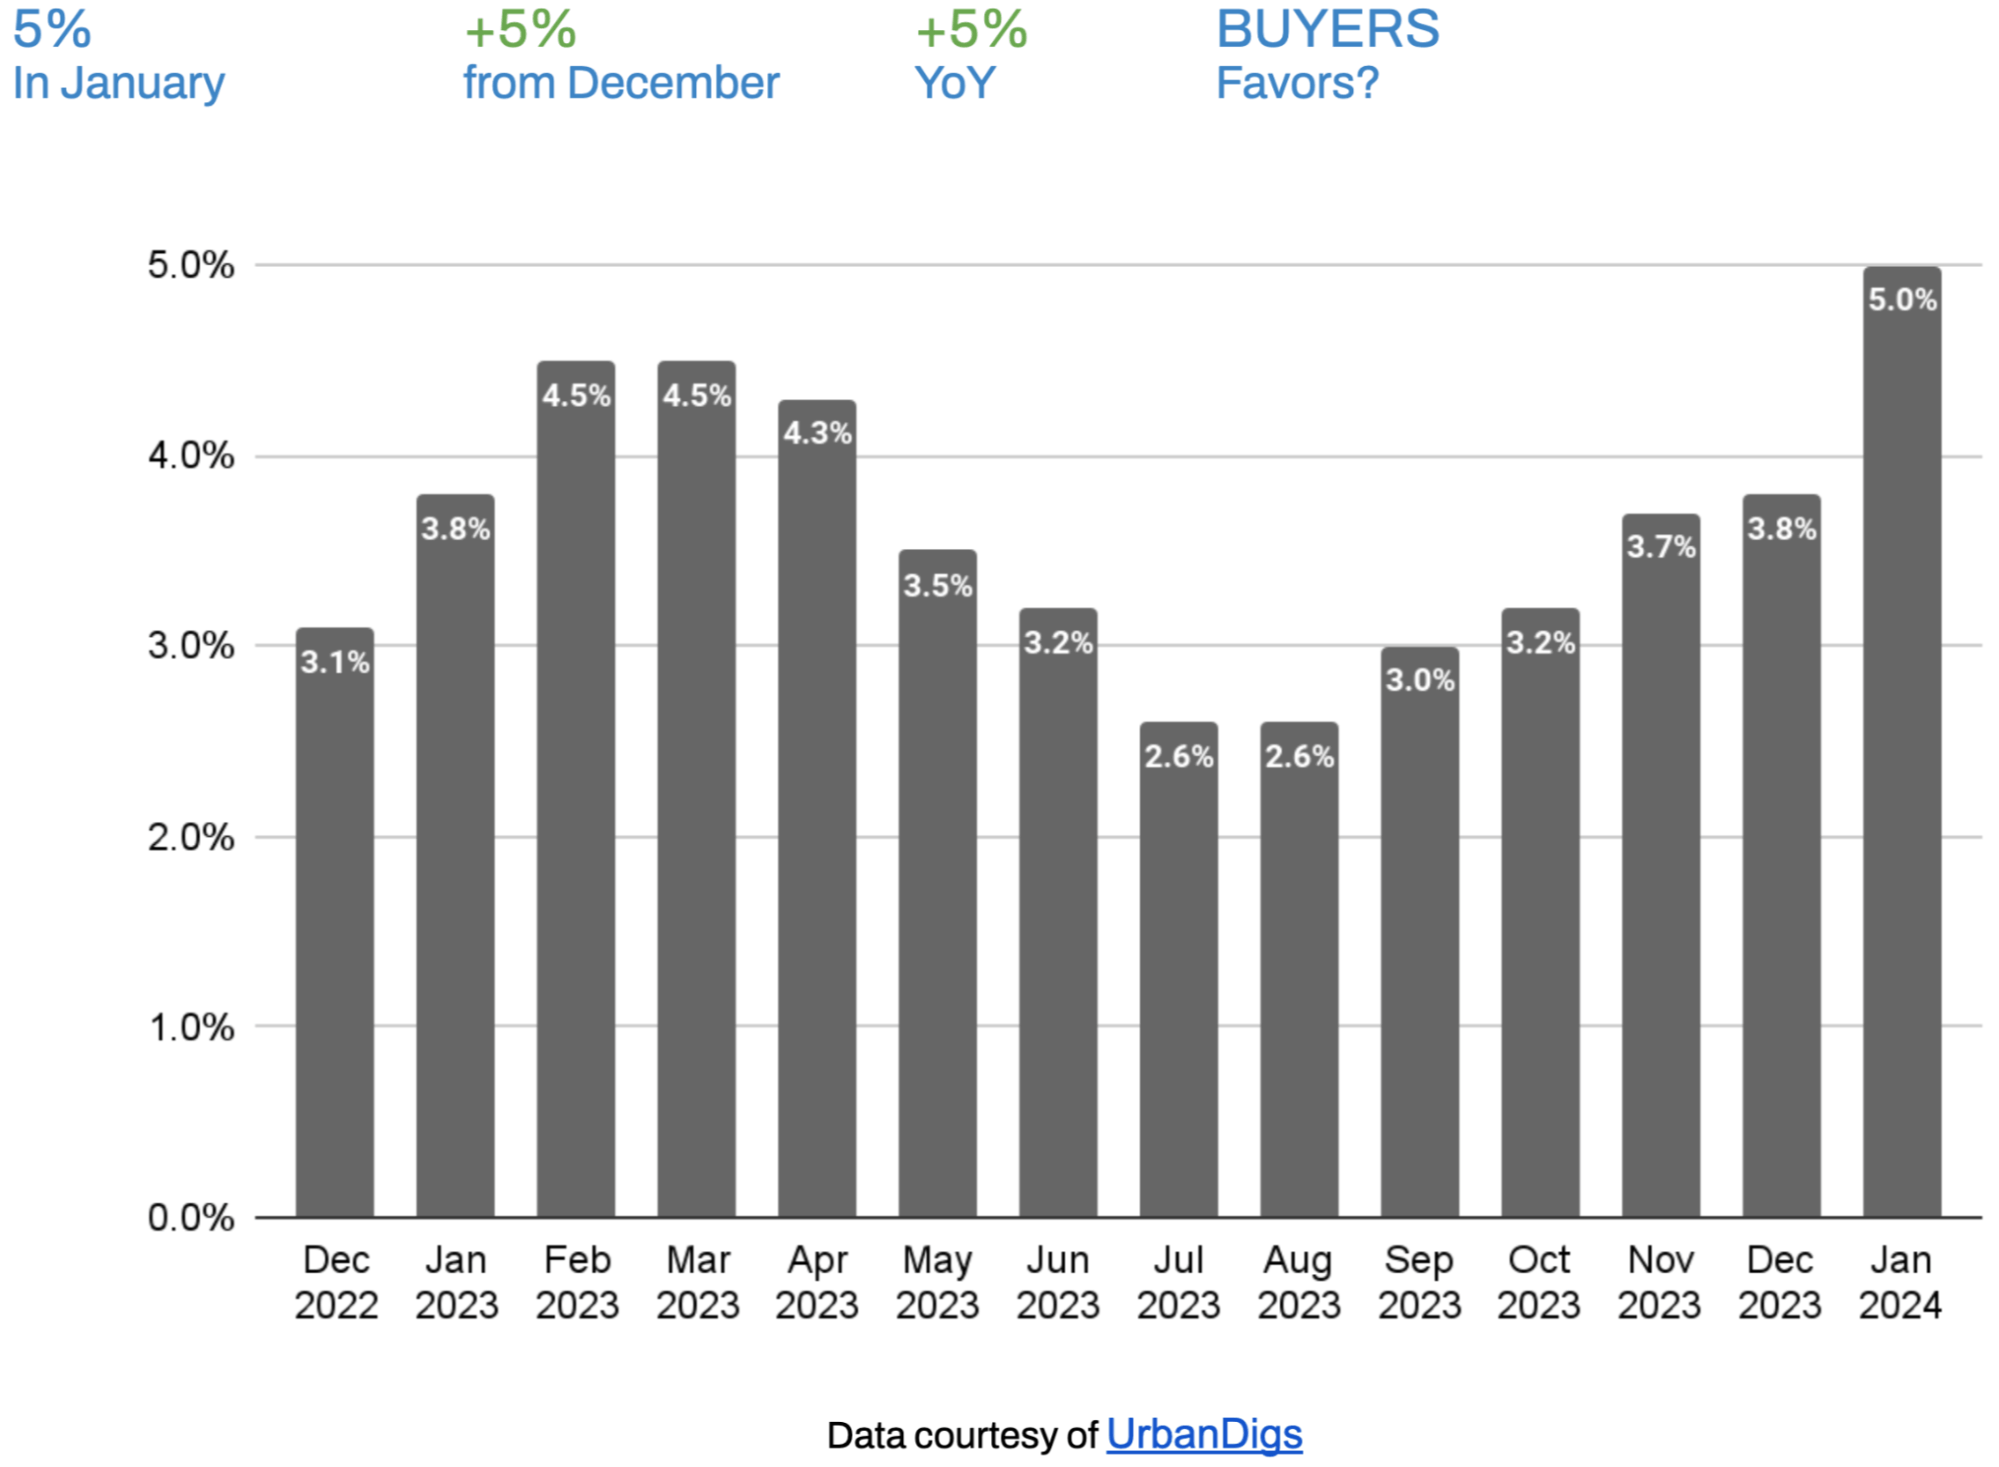
Since December, the median discount has increased to 5% in January and is higher than last year. This could be advantageous for individuals looking to purchase real estate in Brooklyn as they can have increased negotiating power and potentially obtain better deals.
What Does This Mean for:
- BUYERS: An increase in the listing discount allows buyers to secure a property at a price lower than the initial listing price.
- SELLERS: An increase in the listing discount implies that sellers may be - and need to be - more willing to negotiate on prices.
Rental Remarks
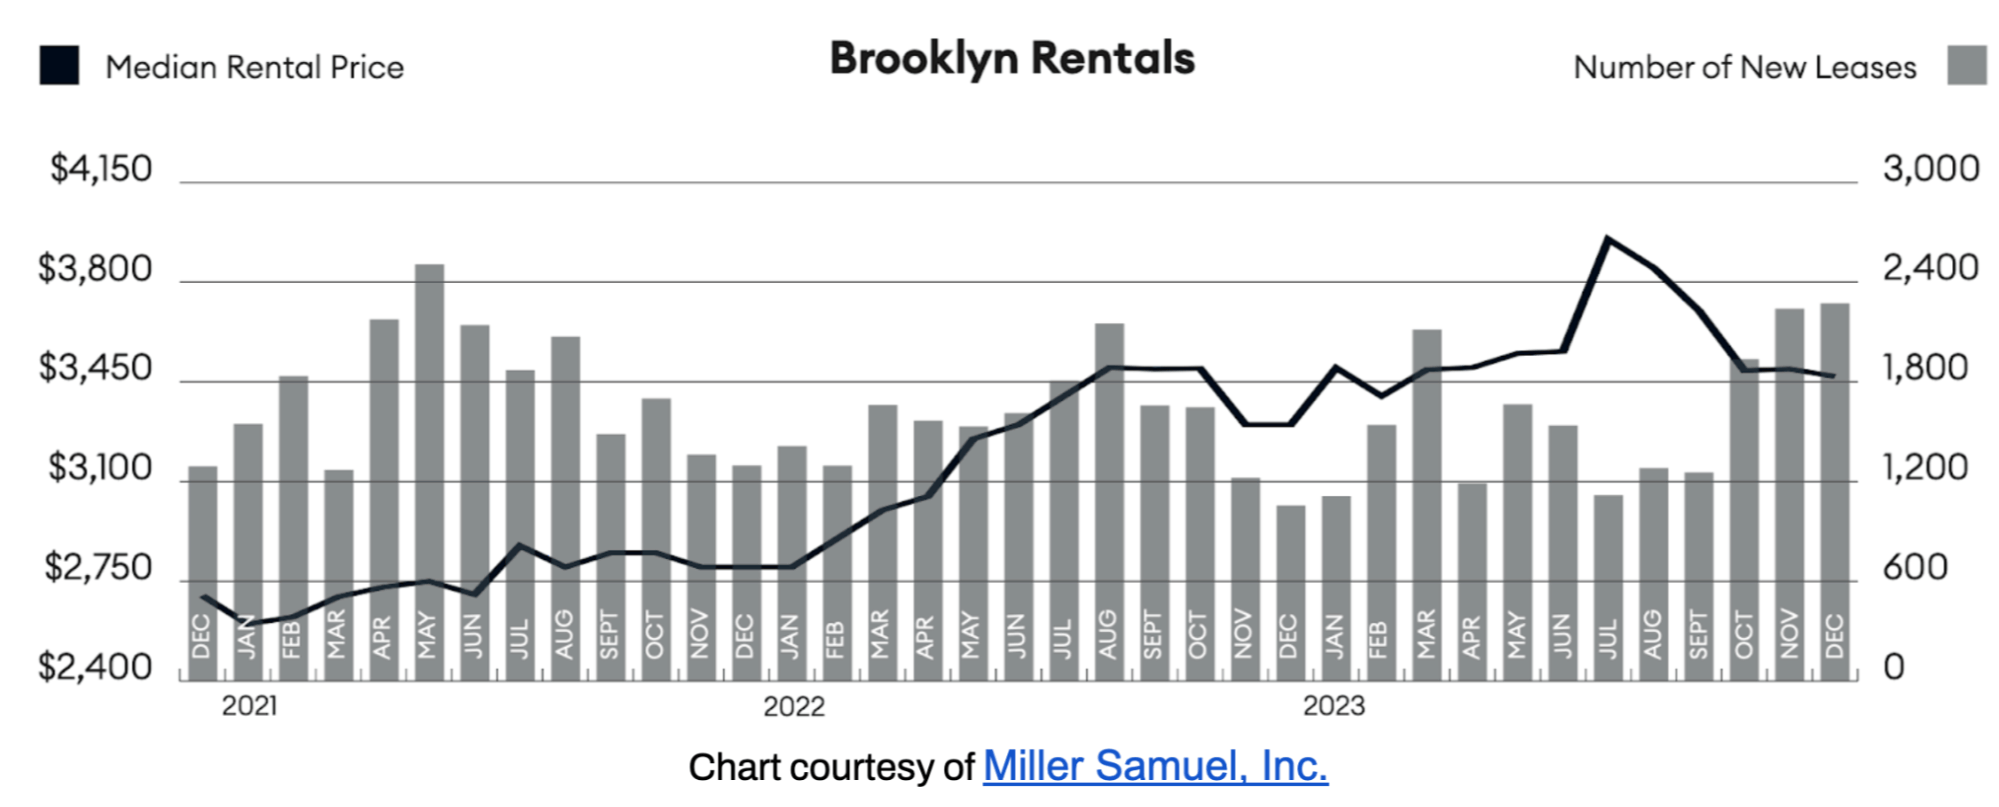
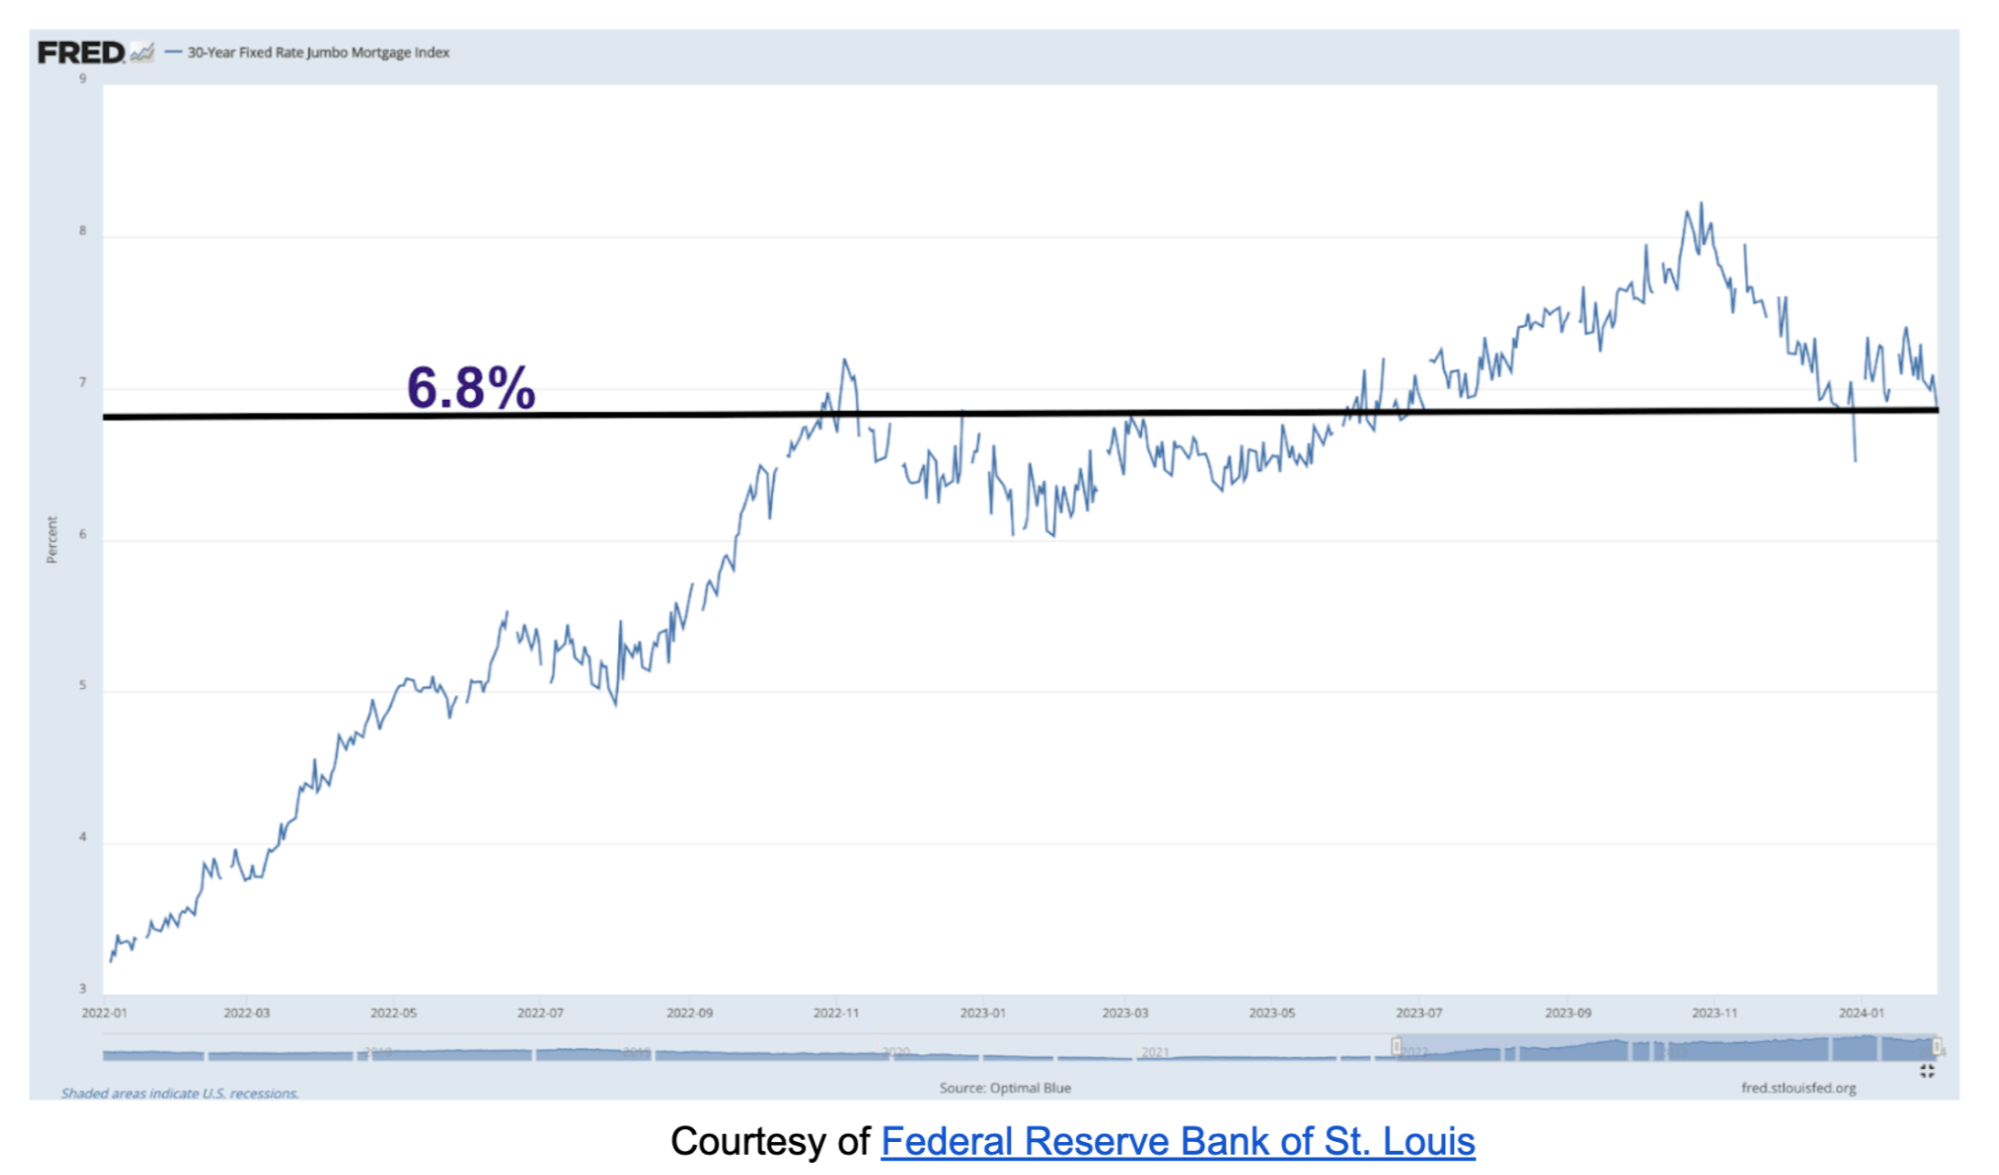
In December5, the median rent remained nearly unchanged from November, indicating minimal variation. The 30-Year Fixed Rate JUMBO Mortgage Index6 is trending at 6.8%, and the average JUMBO APR is 6.36%7. So, it’s a “catch-22” for renters, as the rent versus buy scale may feel equally punitive on both sides.
Investor Insights
The total return is driven by net rental income and capital appreciation. Brooklyn's cap rate is approximately 3.0 - 3.4% for all-cash investors. Unfortunately, there is no net income potential for those investors using a large percentage of leverage, with the average JUMBO mortgage APR at 6.36%. As the chart below illustrates, there was neither a discernible drop in median PPSF nor a rebound due to COVID-19. So, future price inflation will generate no potential for future capital appreciation. Timing and a strong USD may afford foreign investors, depending on their native currency, the opportunity to realize significant capital gains upon selling their assets.
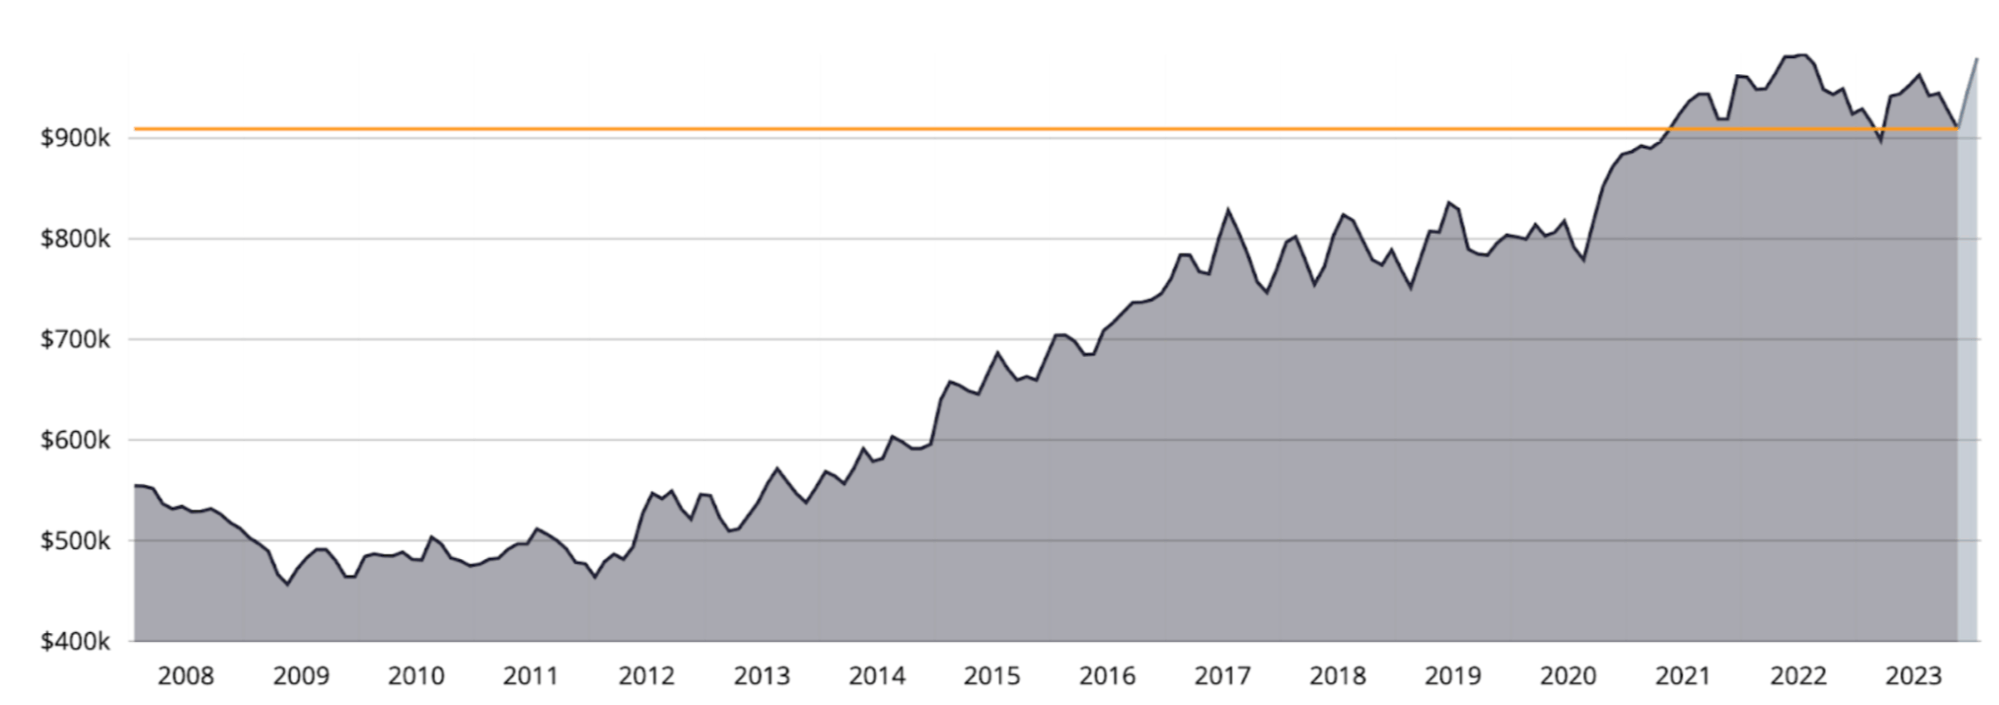
Chart courtesy of UrbanDigs and indicates Brooklyn median PPSF as a function of the closed sale date. The light gray area to the extreme right indicates incomplete data, and the orange line indicates the most recent median PPSF based on data considered complete.
References
- According to the Elegran | Forbes Global Properties Brooklyn Leverage Index
- Data courtesy of Miller Samuel, Inc.
- Mortgage data courtesy of fred.stlouisfed.org
- JUMBO mortgage rate APR data courtesy of Bank of America, Chase, and Wells Fargo
- January 2023 data is not yet available.
- Data courtesy of Federal Reserve Bank of St. Louis
- JUMBO mortgage rate APR data courtesy of Bank of America, Chase, and Wells Fargo