
Overall Brooklyn Market Update: June 2024
Rising Demand Outpaces Rising Supply; Brooklyn Becomes a “Seller’s” Market
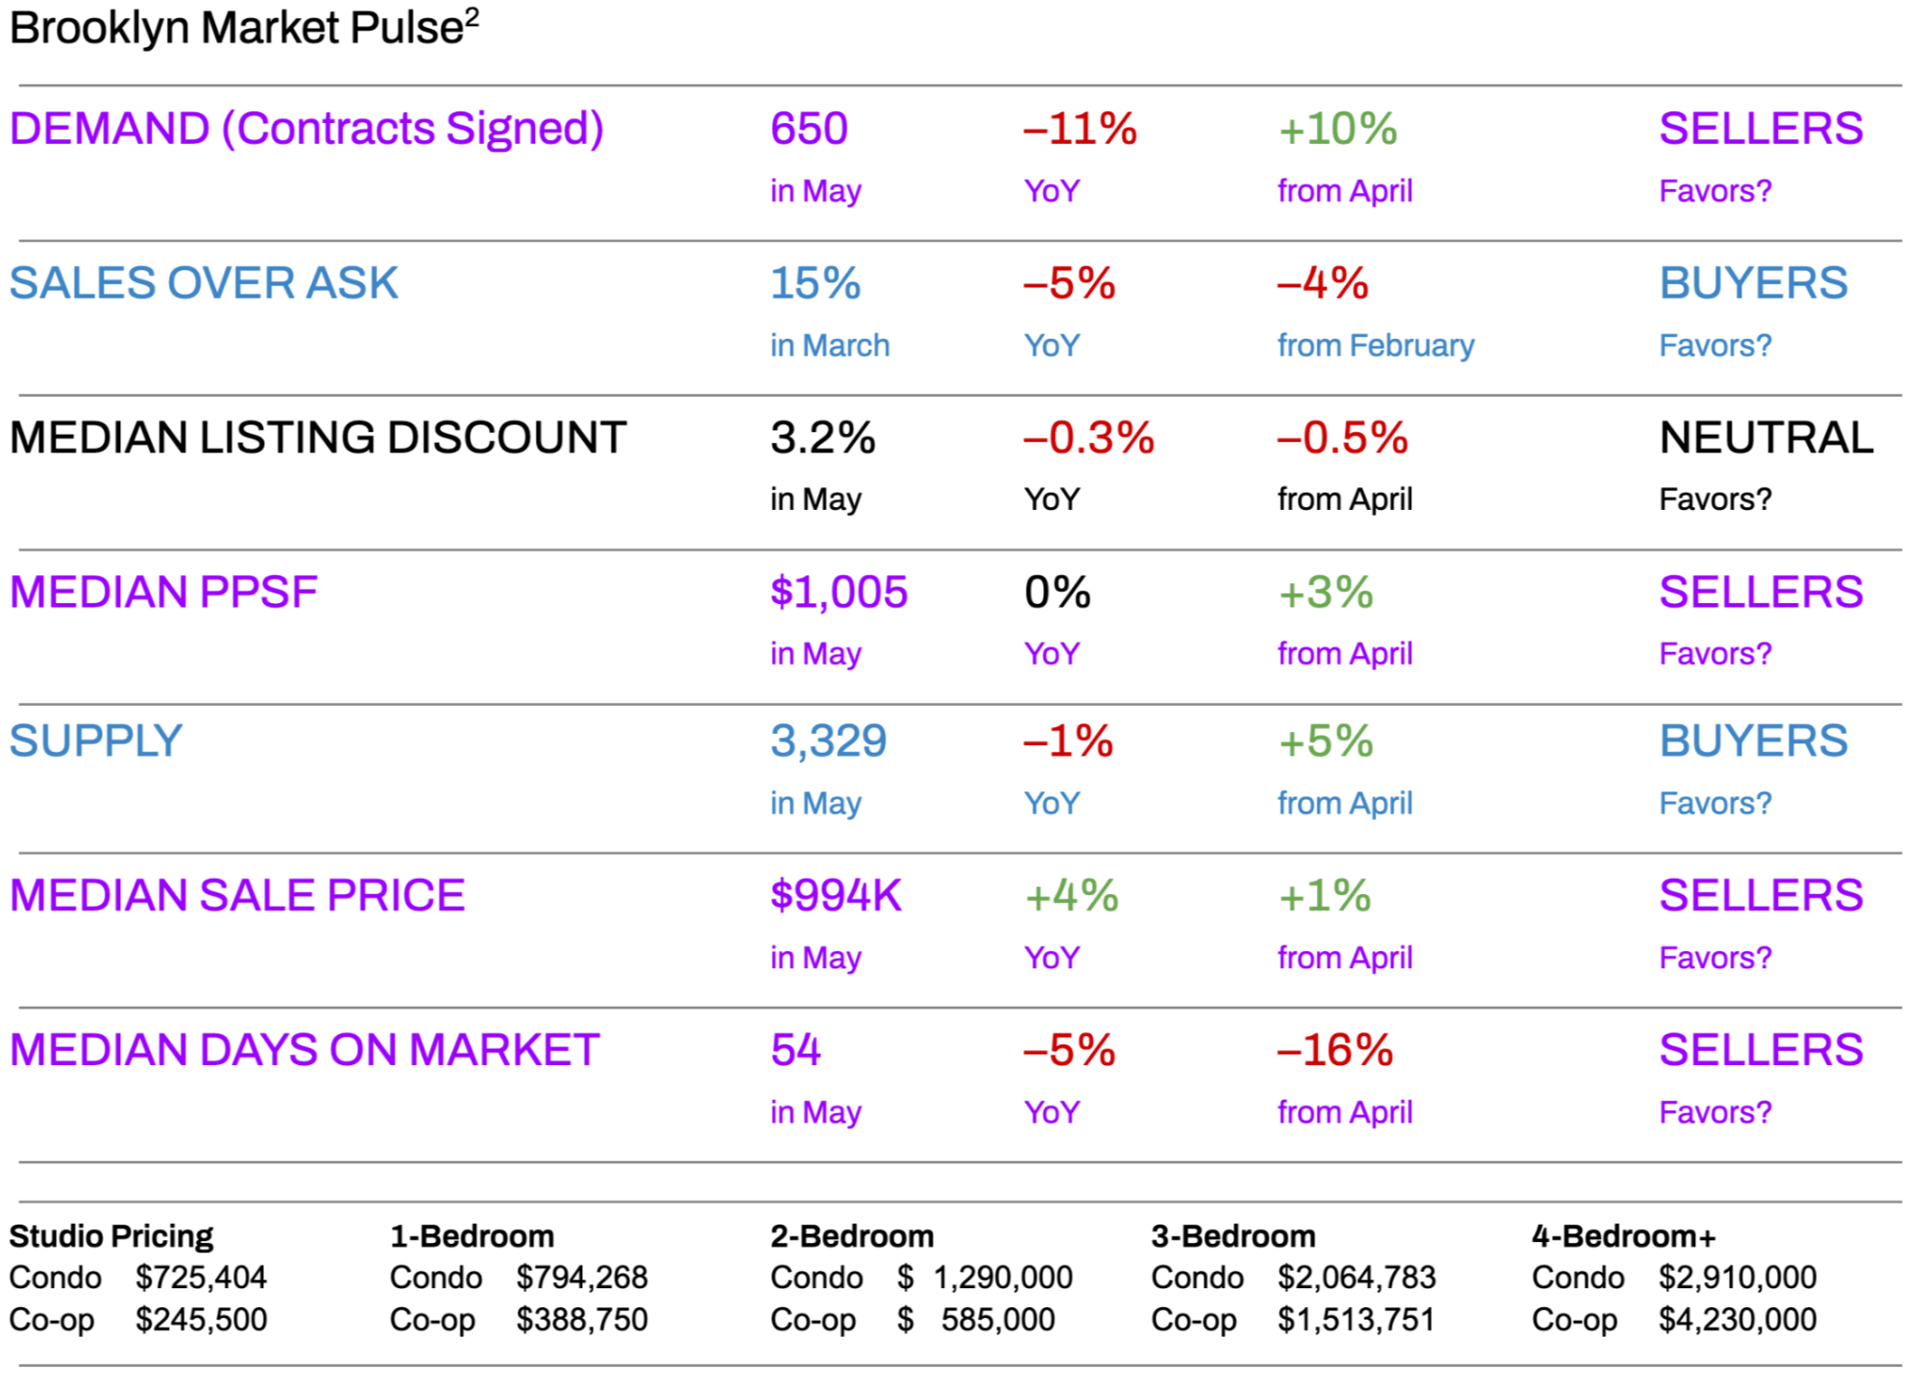
The Brooklyn real estate market significantly improved in May compared to April, with an uptick in contract volume and an increase in supply. However, both demand and total supply remained lower than in May of the previous year.
Contract volume increased by 10% month over month but declined by 11% year over year, while supply rose by 5% month over month and was 1% lower than the same time last year.
Despite the year-over-year decline, the short-term surge in demand is notable. With demand rising faster than supply, listing discounts have decreased, and prices have increased. According to the Elegran | Forbes Global Properties Brooklyn Leverage Index, these dynamics have shifted the market slightly in favor of sellers.
While overall demand has fallen more than supply over the past year, the recent spring uptick in demand has outpaced supply, creating a more competitive market. As we move into the summer months, steady demand is expected to continue. Buyers should prepare for heightened competition, with fewer new-to-market properties and more existing listings being taken off the market.
Sales
- “Neutral” markets don’t exist because buyers and sellers are constantly playing tug-of-war for leverage.
- At times (e.g., more than 1 year already), there’s no clear winner as buyers & sellers reach equilibrium.
- Based on the data, the Brooklyn market has shifted slightly in favor of sellers in April as:
- Demand (measured by contracts signed) increased in the seller's favor.
- Median PPSF (Price Per Square Foot) increased in the seller’s favor.
- Median days on the market decreased in the seller's favor.
- The median sales price increased in the seller's favor.
- Supply increased in the buyer's favor.
- Based on the data, the Brooklyn market has shifted slightly in favor of sellers in April as:
Rentals
- April saw an increase in the rental market, with a growth of 3% compared to March and an increase of 2.8% compared to last year. The steady growth in rents suggests a market that favors landlords.
- Renters face rising rental costs and increased competition for available units, necessitating quick decision-making and negotiation skills to secure desired accommodations.
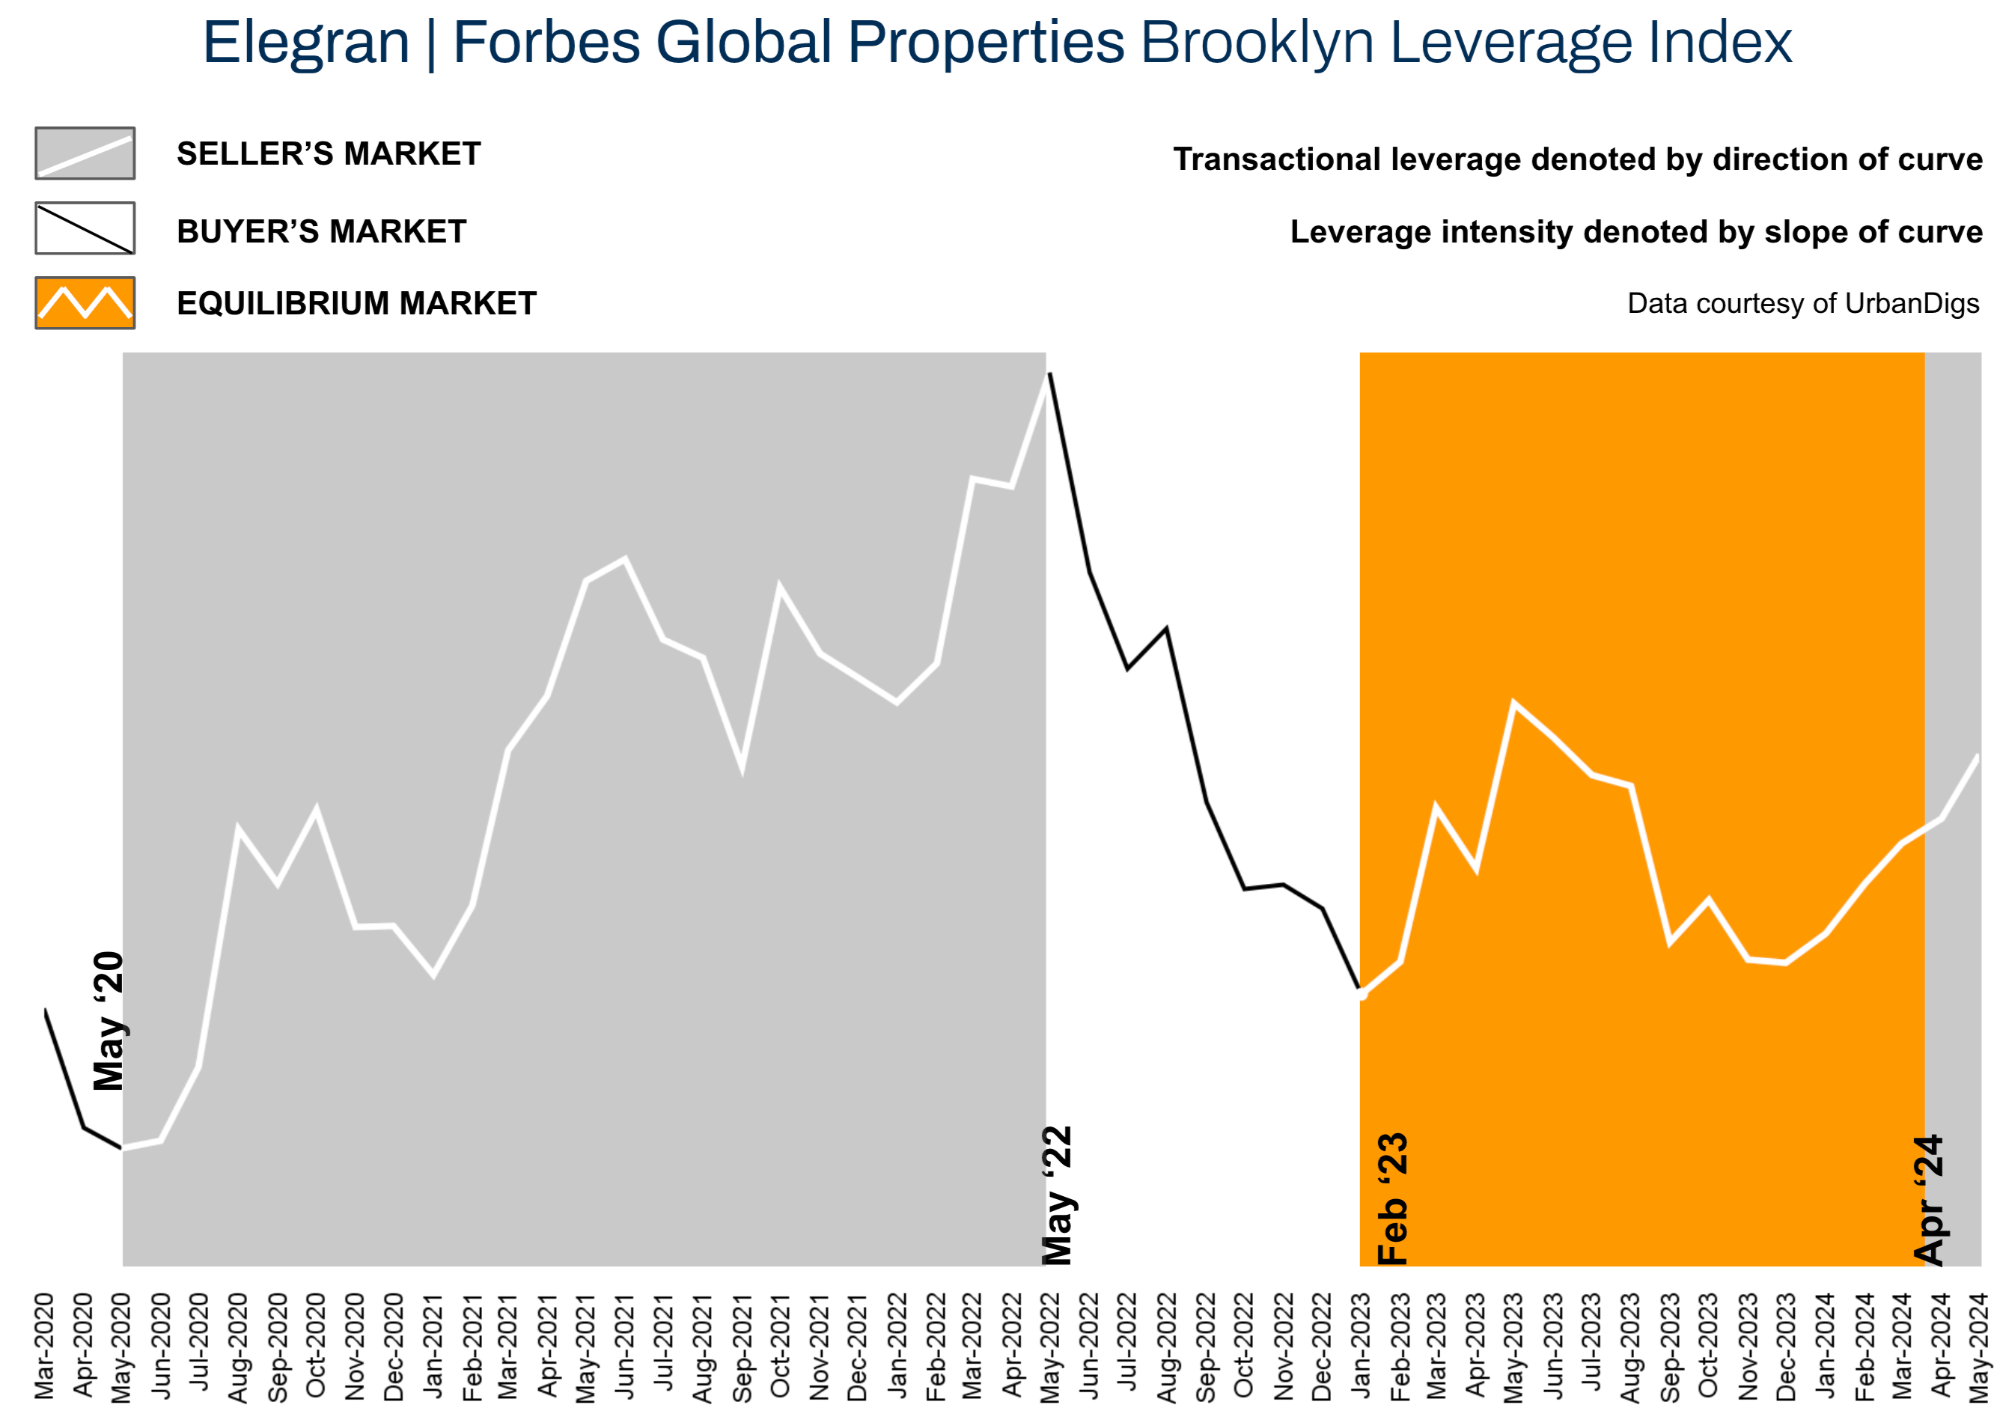
Elegran | Forbes Global Properties Brooklyn Leverage Index
The Elegran | Forbes Global Properties Brooklyn Leverage Index is powered by four indicators: supply, demand, median price per square foot (PPSF), and median listing discount.
It informs us whether the current is a buyer’s or a seller’s market, i.e., which party possesses transactional leverage. Looking at the graph below, this is indicated by the direction of the curve, where:
- An increasing trend from left to right indicates a seller’s market
- A decreasing trend from left to right indicates a buyer’s market
Our indicator also informs us regarding the relative strength of that leverage, indicated by the slope of the curve, where:
- A gentle slope indicates a weak advantage by one party over the other
- A sharp slope indicates a strong advantage.
But the numbers are not important. What is important is the direction and slope of the curve. We can consider that, starting in April and continuing into May, Brooklyn has turned into a [slight] seller's market. Demand and median PPSF favored sellers, median listing discount did not favor either party, and supply favored buyers given the recent increase.
Brooklyn Supply
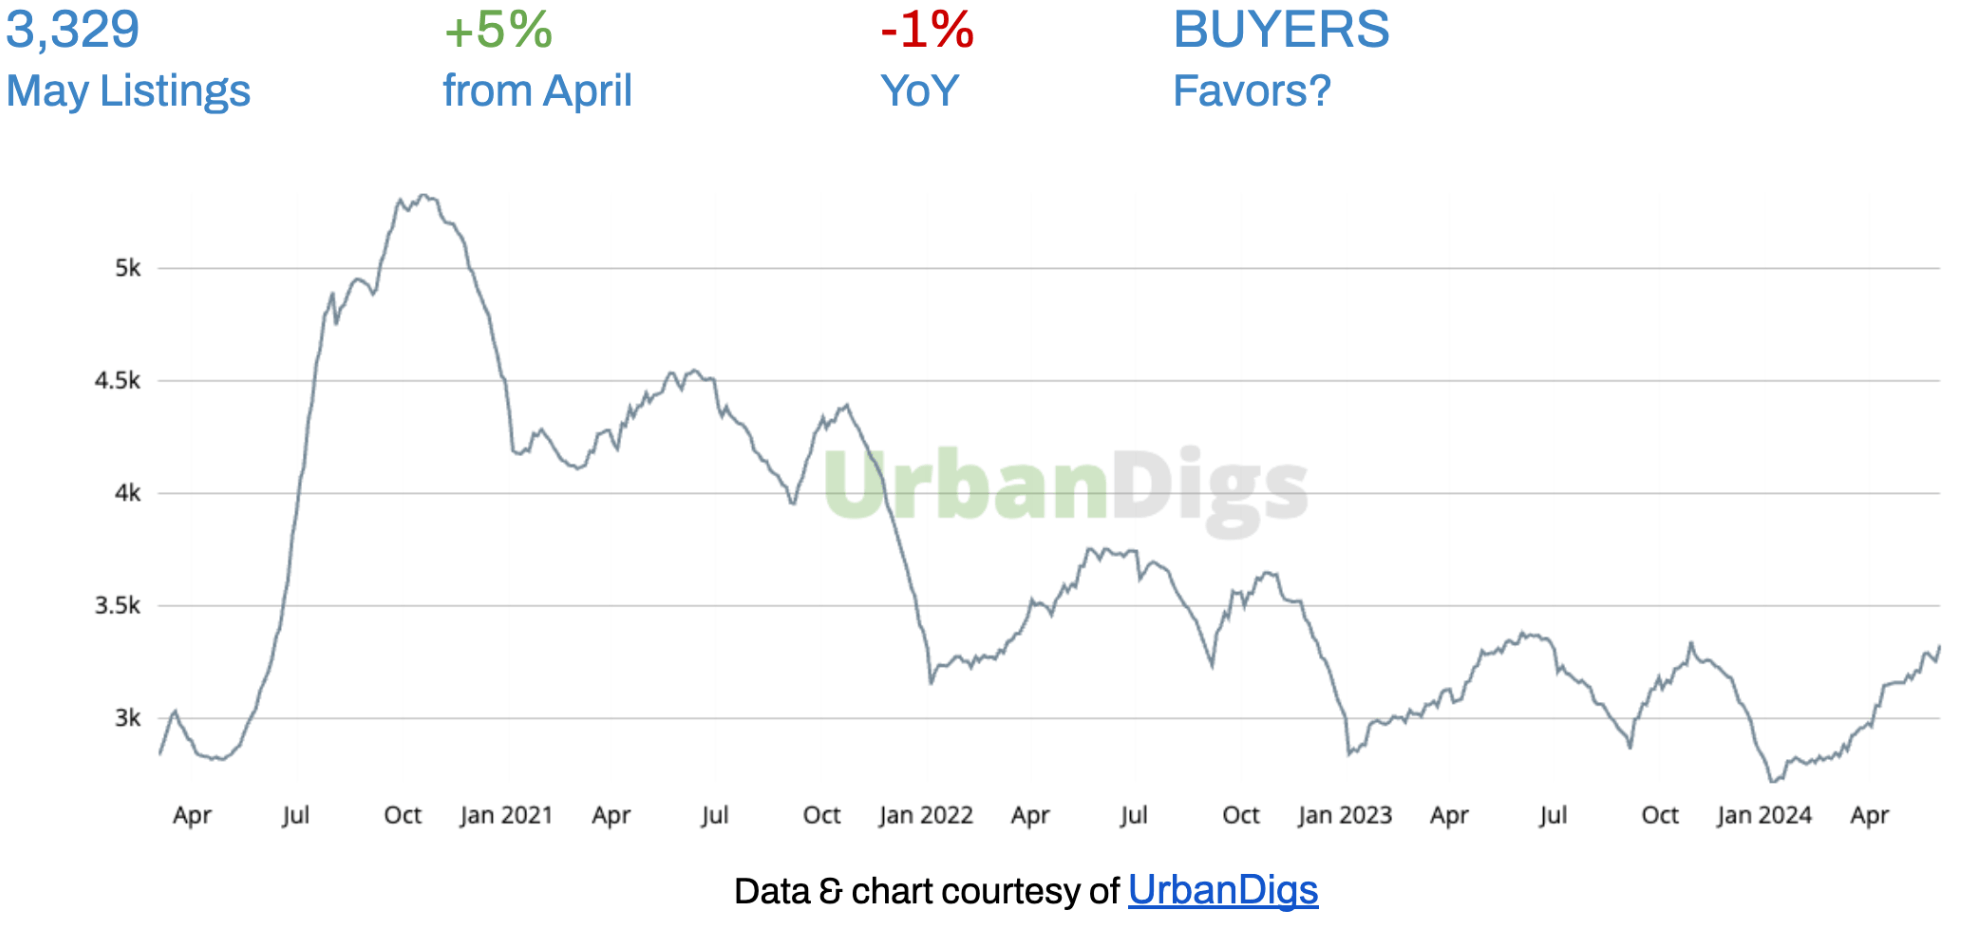
Despite the typical seasonal increase from April to May, the total supply in May was 1% lower than last year. This lower supply helps to counterbalance the year-over-year decrease in contract volume.
What Does This Mean for:
- BUYERS: The month-over-month increase might offer more options in the short term.
- SELLERS: The year-over-year decrease in supply might be beneficial for sellers, as less competition can potentially lead to faster sales and possibly better pricing power.
The Brooklyn residential real estate market leans slightly toward a seller's market, given the decrease in year-over-year inventory. The recent increase in supply is counterbalanced by the recent increase in demand, and it’s expected that demand will continue to outpace supply in the coming months. Buyers and sellers should monitor inventory levels and market conditions closely and look for a decrease in new-to-market supply over the summer months.
Brooklyn Demand
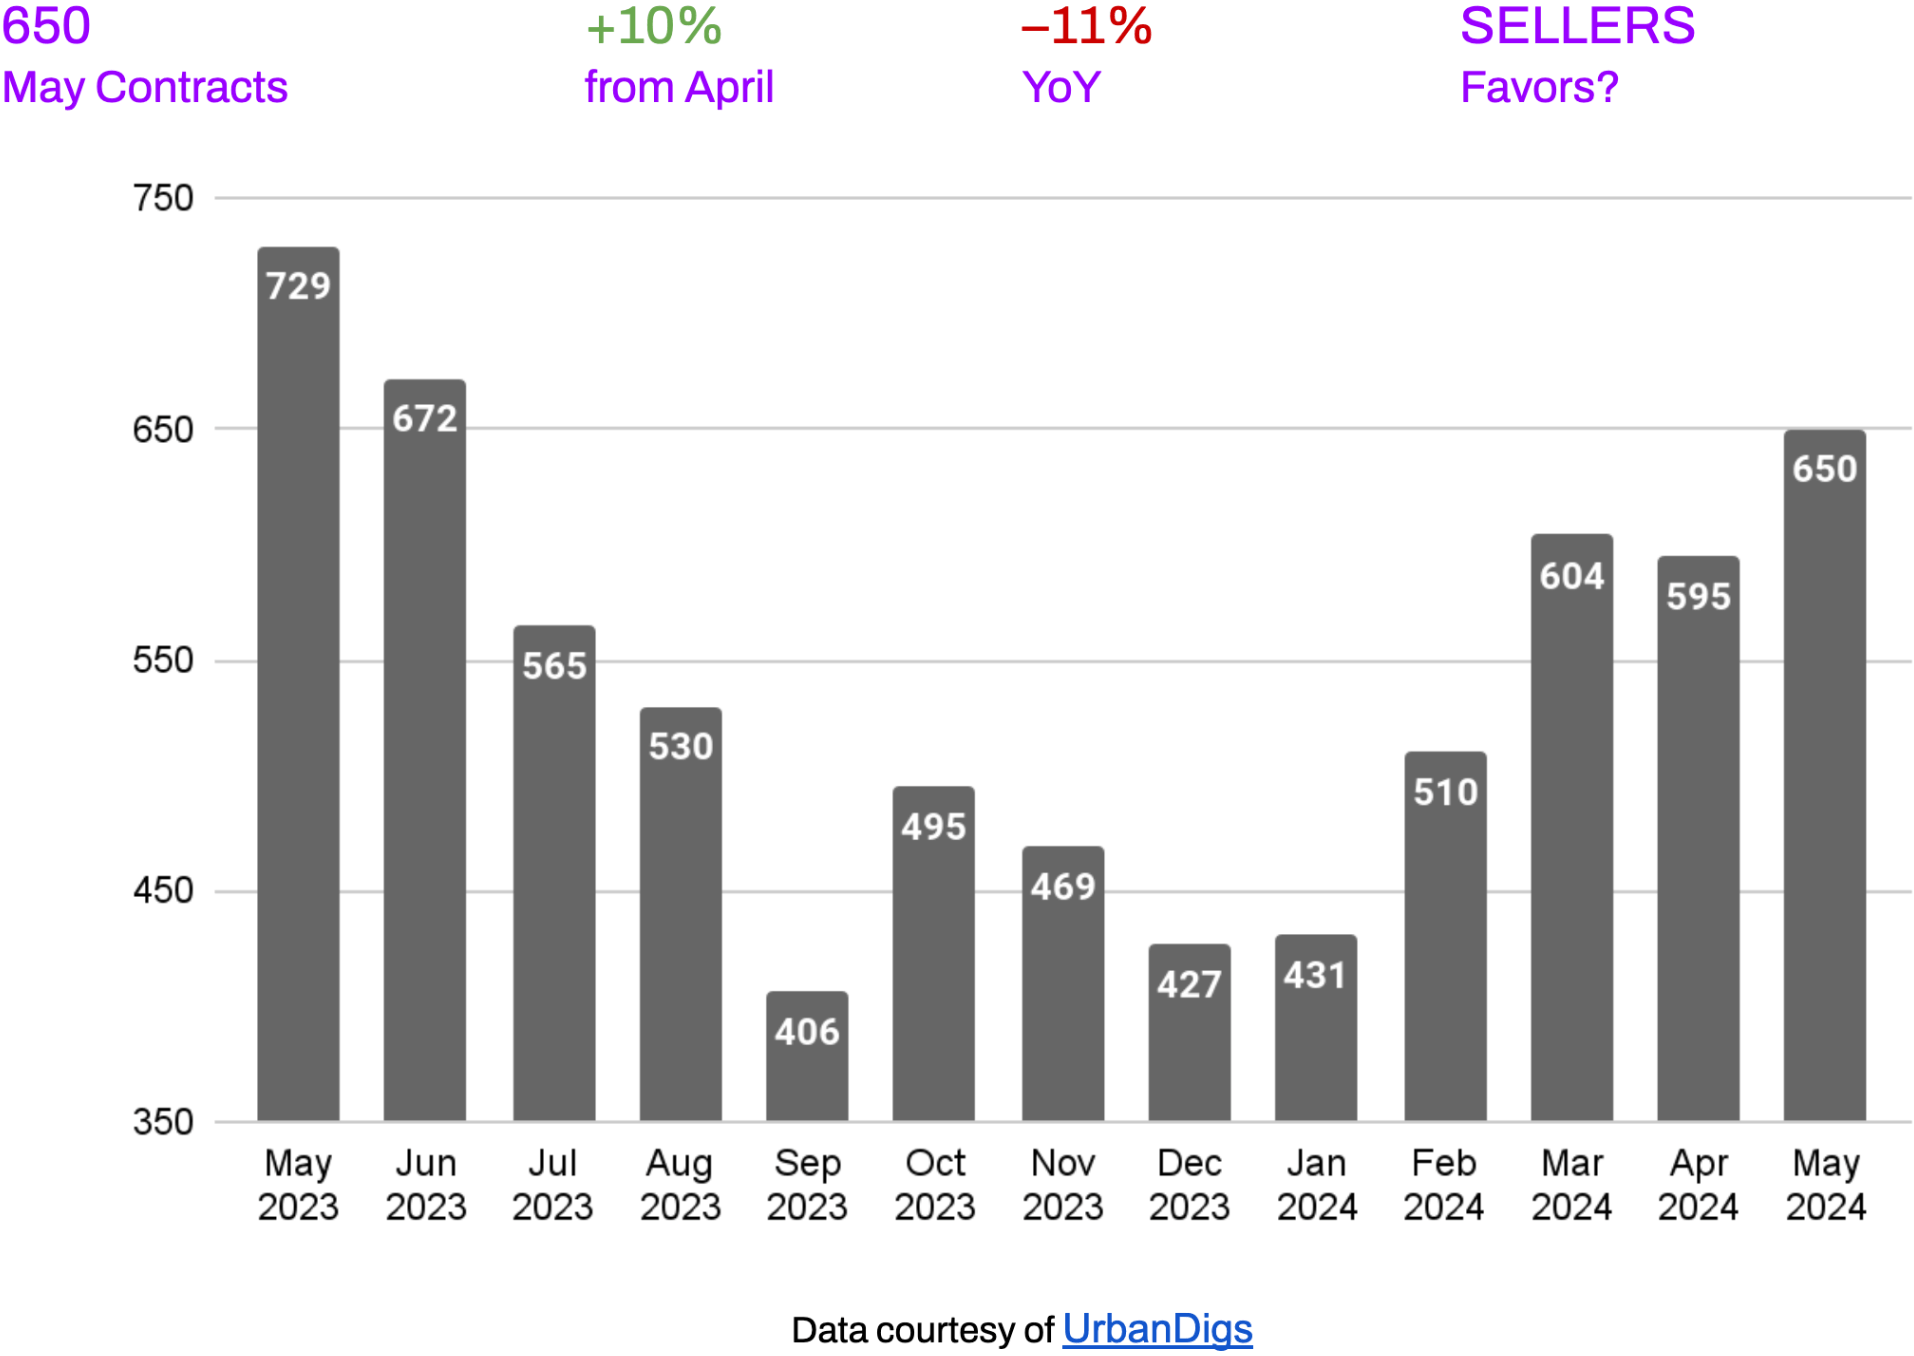
The 10% increase in contracts signed from April to May 2024 indicates a welcomed but perhaps seasonal or short-term uptick in market activity, which is typical for the spring season when more buyers and sellers enter the market. However, the 11% decrease in contracts signed compared to May 2023 suggests an annual slowdown influenced by higher interest rates, inflation, and the upcoming election.
What Does This Mean for:
- BUYERS: Despite the annual decrease, the month-over-month increase suggests heightened competition among buyers. Be prepared to act quickly.
- SELLERS: You may need to be more competitive with pricing due to the overall annual decrease in demand. However, the month-over-month increase indicates slightly more activity and interest than in April, providing a potentially better selling environment.
The mixed signals—a decrease year-over-year but an increase month-over-month—indicate a nuanced market. While there is a general cooling compared to last year, the seasonal trend shows a rebound in activity, typical for the spring season. Demand continues to outpace supply, leading to lower discounts and firm pricing.
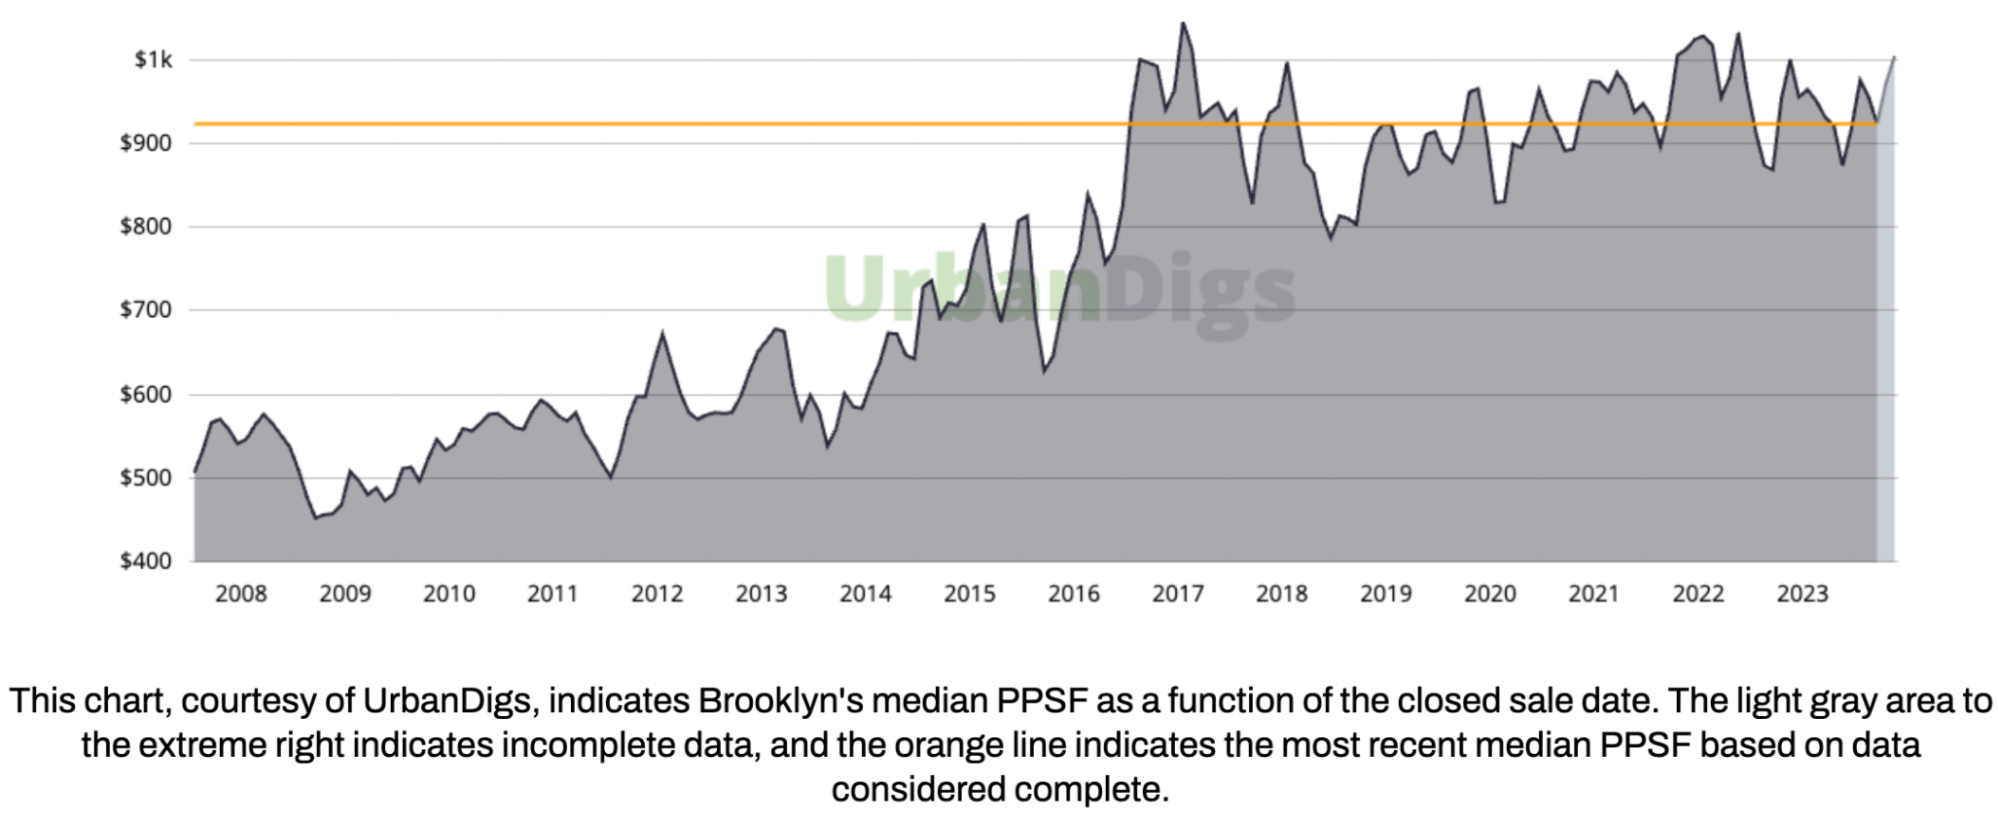
Brooklyn Median PPSF
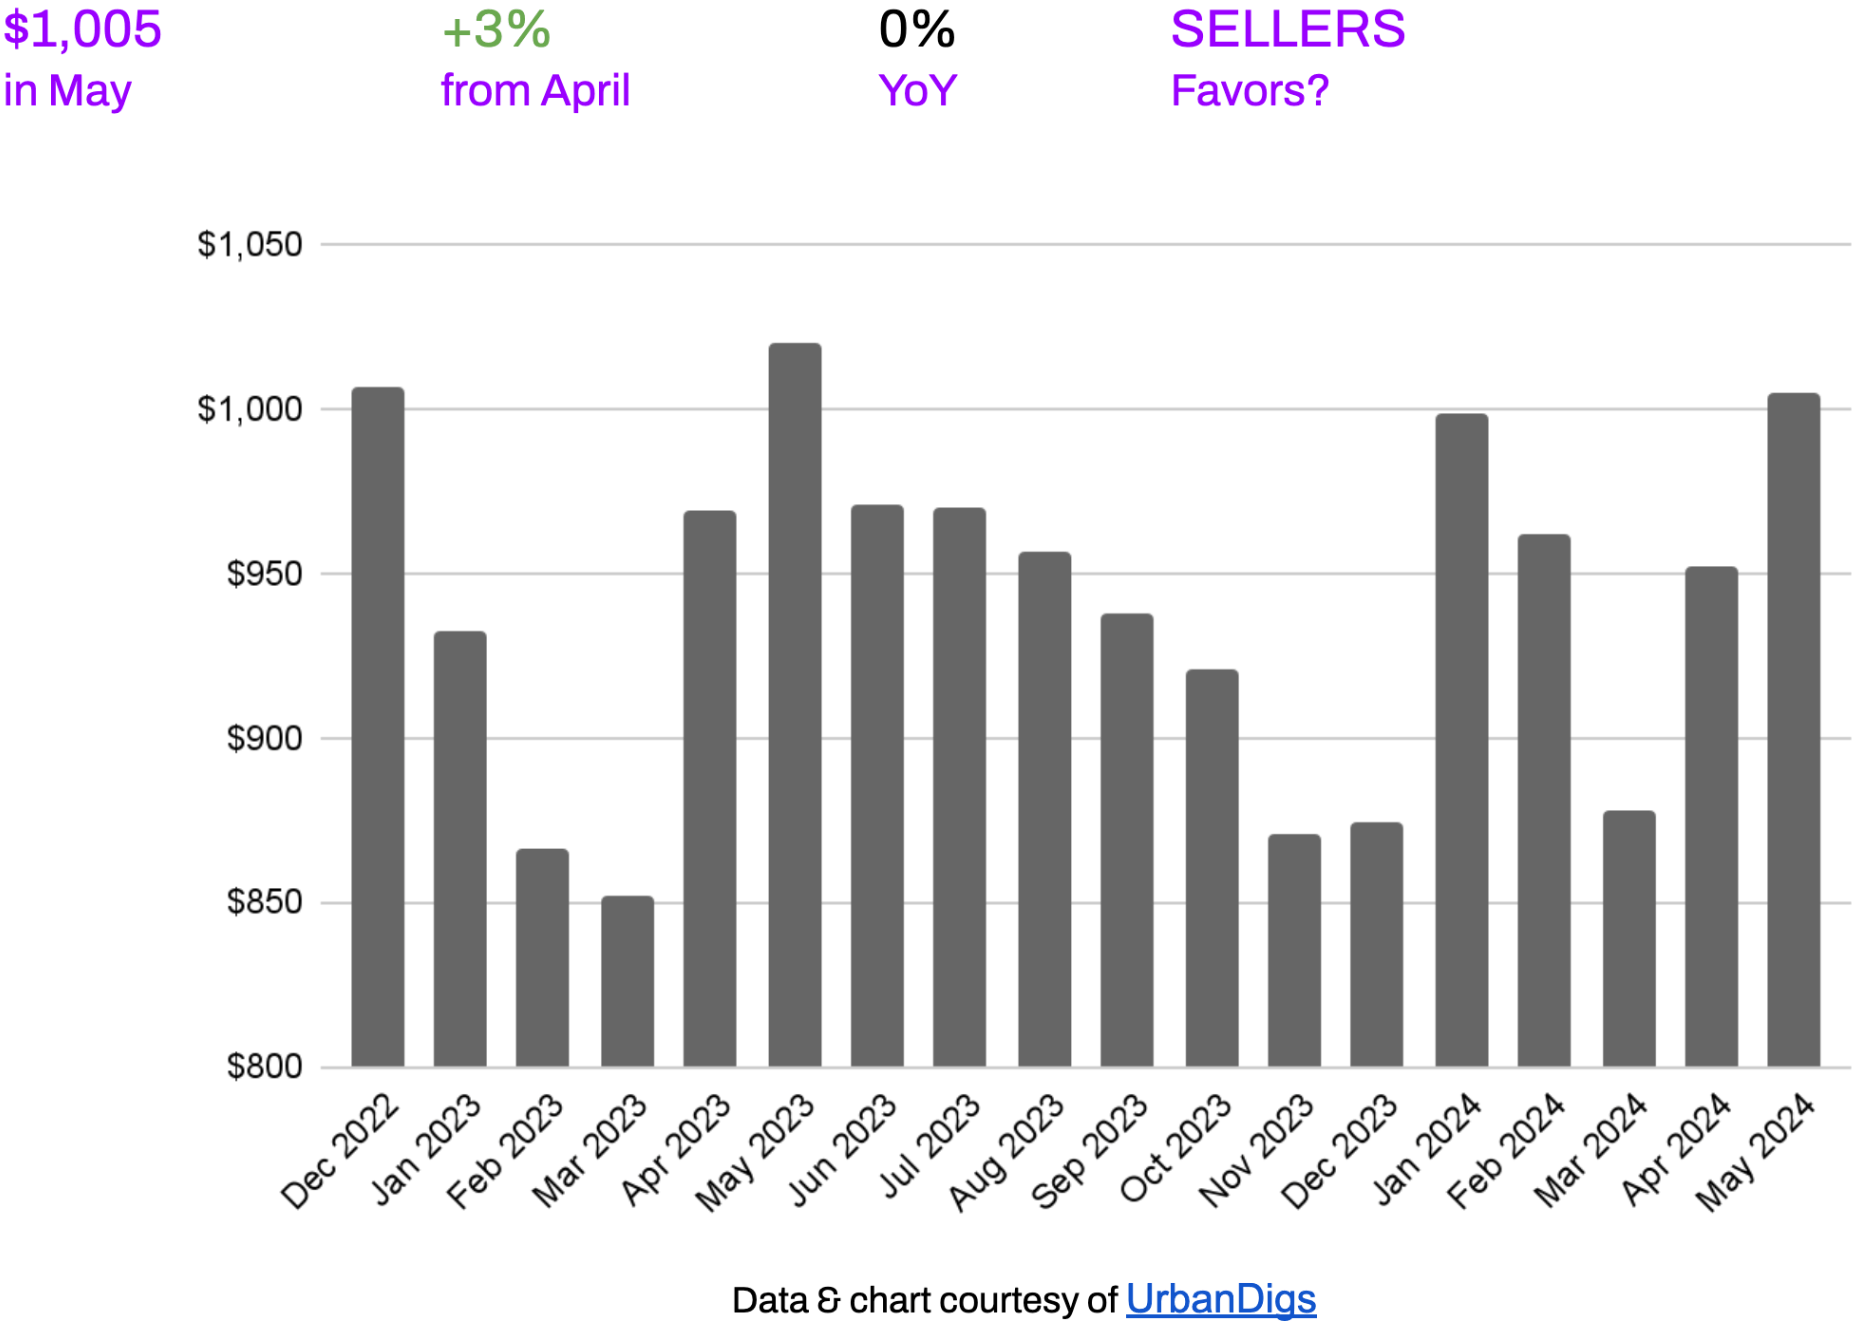
The Brooklyn residential market shows short-term price growth, with a 3% increase in the median price per square foot from April to May, and a flat market in the past year, with no change in the metric year over year.
What Does This Mean for:
- BUYERS: The 3% rise in the median price per square foot from April to May suggests that buyers might face slightly higher costs compared to the previous month. Buyers should factor in the recent price increase when budgeting for their purchases but can take comfort in the fact that longer-term prices have remained steady.
- SELLERS: Sellers can use the recent price increase as leverage in negotiations, but they should also be mindful that buyers are punished for mispriced or overpriced properties in the borough.
Year-over-year stability suggests that this growth is controlled and not part of a volatile spike. This balanced scenario provides a conducive environment for both buyers and sellers, promoting steady transactions without the fear of rapid price fluctuations.
Brooklyn Median Listing Discount
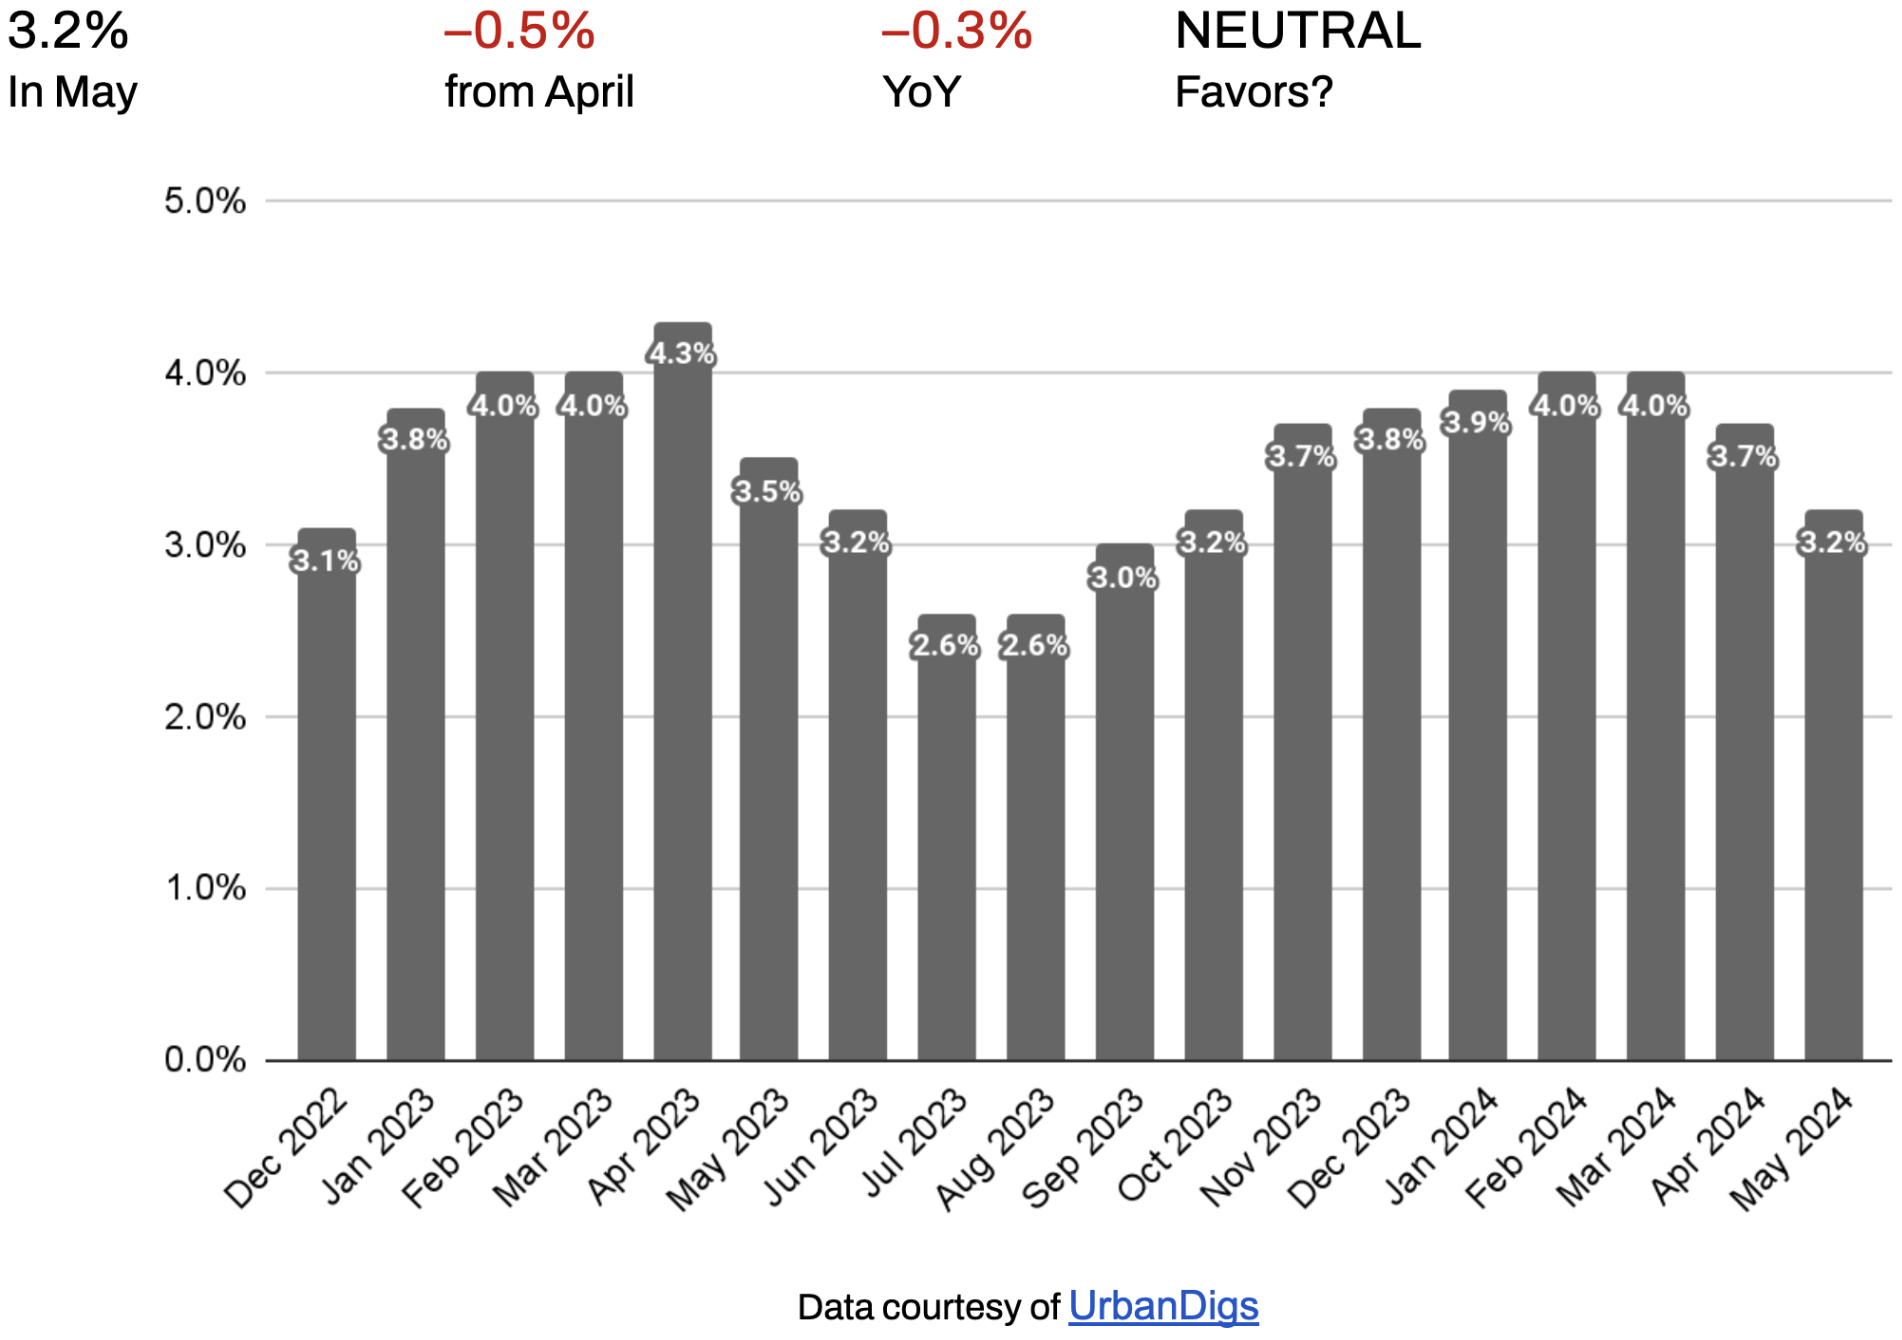
The median listing discount of 3.2% in May 2024 reflects a decrease of 0.5% from April and a 0.3% decrease year-over-year. The slight decrease in the median listing discount from April to May indicates a balanced market where both buyers and sellers have some negotiating power, albeit with sellers holding a slight advantage. There’s a narrow range for properties to be priced “accurately” in the borough and to sell quickly. Properties priced too high often languish on the market and face price drops.
What Does This Mean for:
- BUYERS: The trend of decreasing discounts means buyers might have less room for negotiation than in previous periods. As discounts decrease, the opportunity to secure a better deal might diminish, urging buyers to act more quickly.
- SELLERS: The decreasing median listing discount points to a potentially stabilizing market with improving conditions for sellers.
In the short term, the trend of decreasing listing discounts is likely to continue as demand has grown faster than supply, and the Brooklyn market has entered a market slightly more favorable to sellers.
Rental Remarks
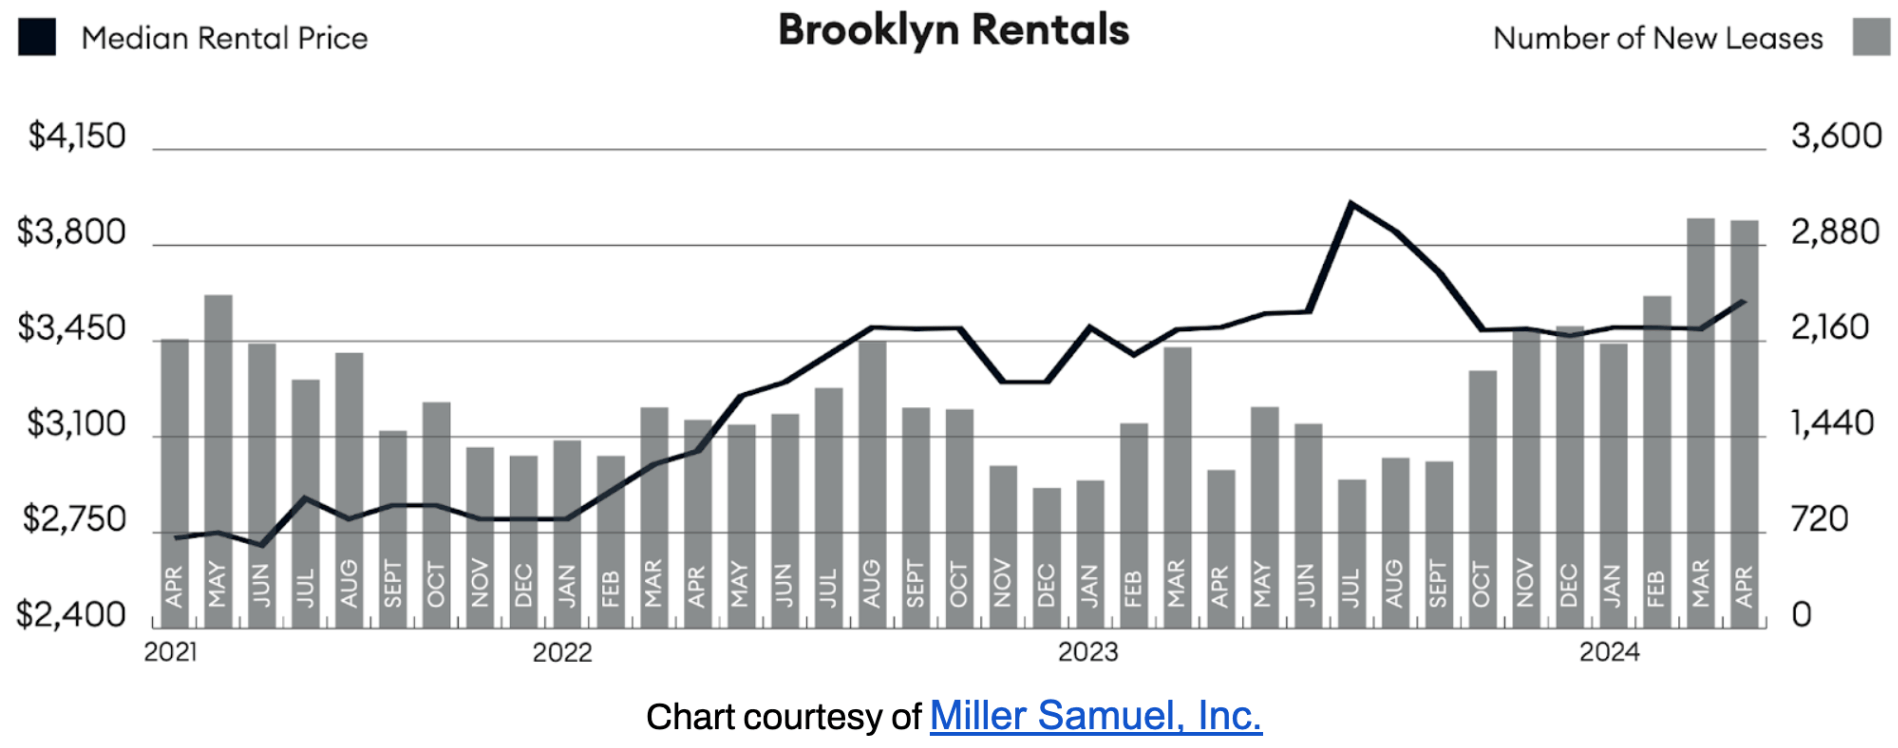
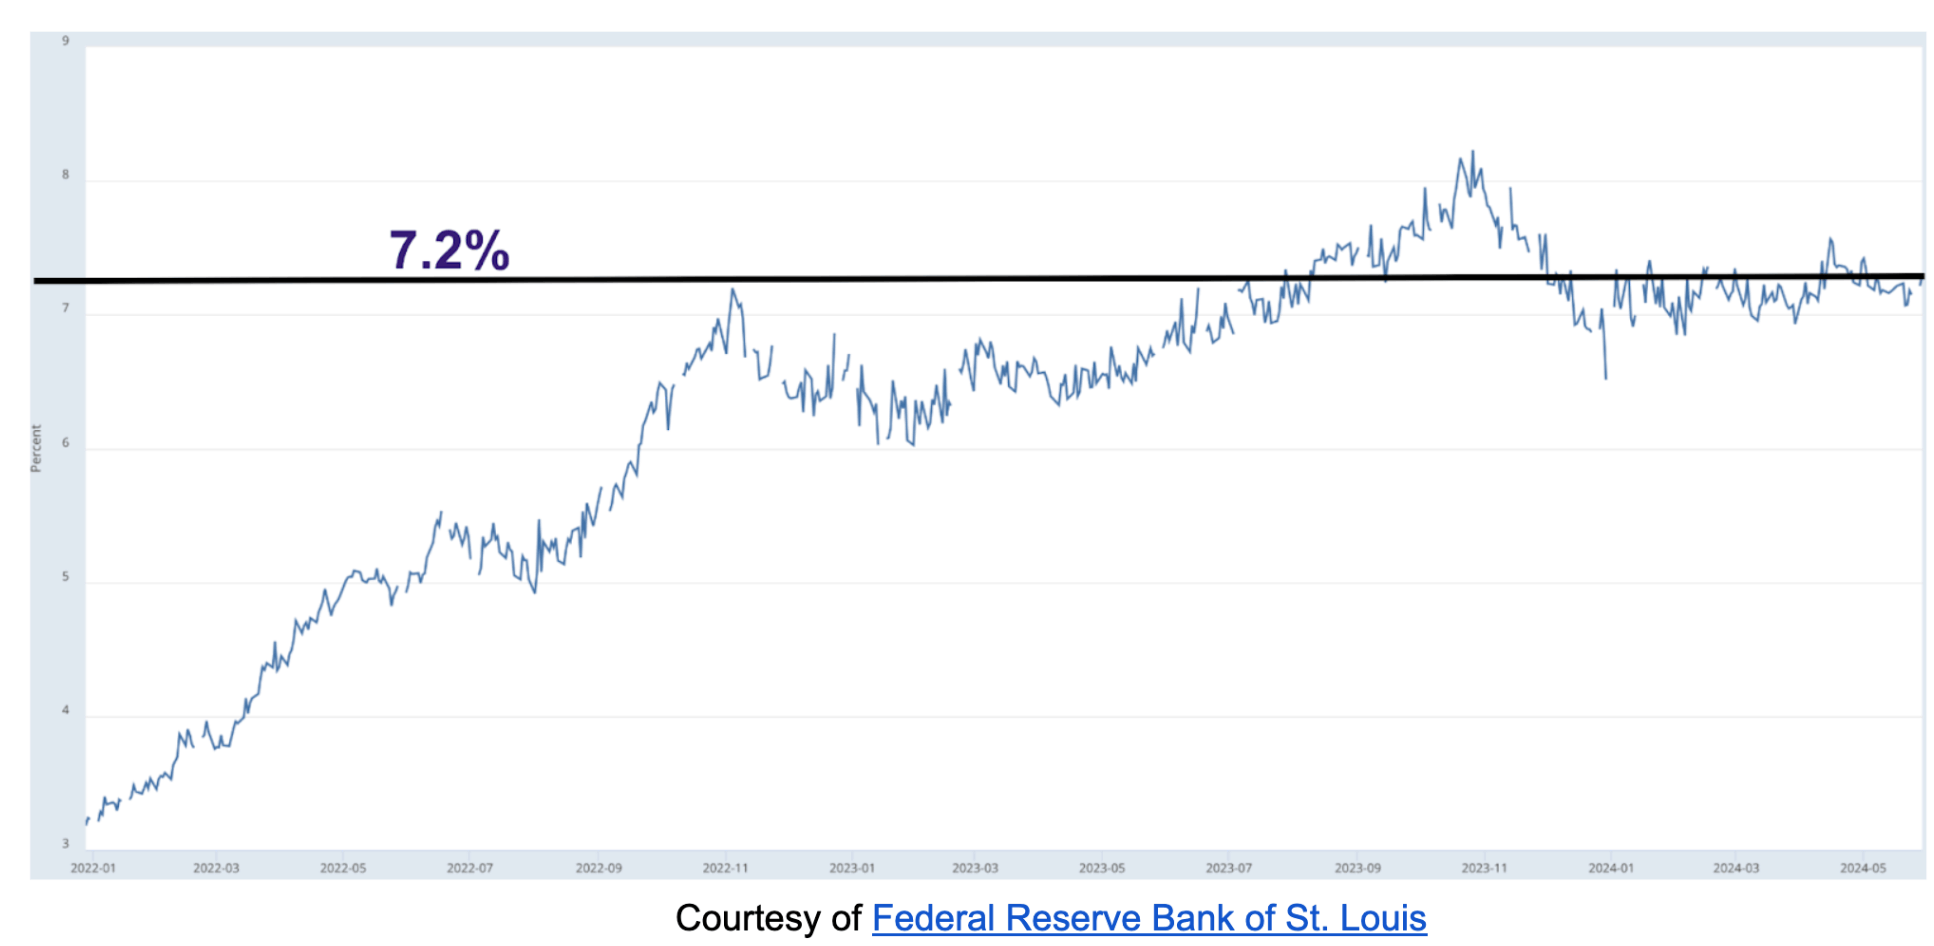
April4 saw an increase in the rental market, with a growth of 3% compared to March. With a year-over-year, rents edged up by 2.8%. The steady growth in rents suggests a market environment that favors landlords, providing potential opportunities for property owners to increase rental income and maximize returns on investment. The 30-Year Fixed Rate JUMBO Mortgage Index is trending at 7.2%, and the average JUMBO APR is 7.1%. So, it’s a “catch-22” for renters, as the rent versus buy scale may feel equally punitive on both sides.
Investor Insights
The total return is driven by net rental income and capital appreciation. Brooklyn's cap rate is approximately 3.0 - 3.4% for all-cash investors. Unfortunately, there is no net income potential for those investors using a large percentage of leverage, with the average JUMBO mortgage APR at 7.1%. As the chart below illustrates, there was neither a discernable drop in median PPSF nor a rebound due to COVID-19. So, future price inflation will generate any potential for future capital appreciation. Timing and a strong USD may afford foreign investors, depending on their native currency, the opportunity to realize significant capital gains upon selling their assets.
References
- According to the Elegran | Forbes Global Properties Brooklyn Leverage Index
- Data courtesy of UrbanDigs
- Data courtesy of Miller Samuel, Inc.
- Data courtesy of Miller Samuel, Inc.
- Data courtesy of Federal Reserve Bank of St. Louis
- JUMBO mortgage rate APR data courtesy of Bank of America, Chase, and Wells Fargo