
Data courtesy of UrbanDigs
Brooklyn Market Update: Sellers Hold a Slight Advantage
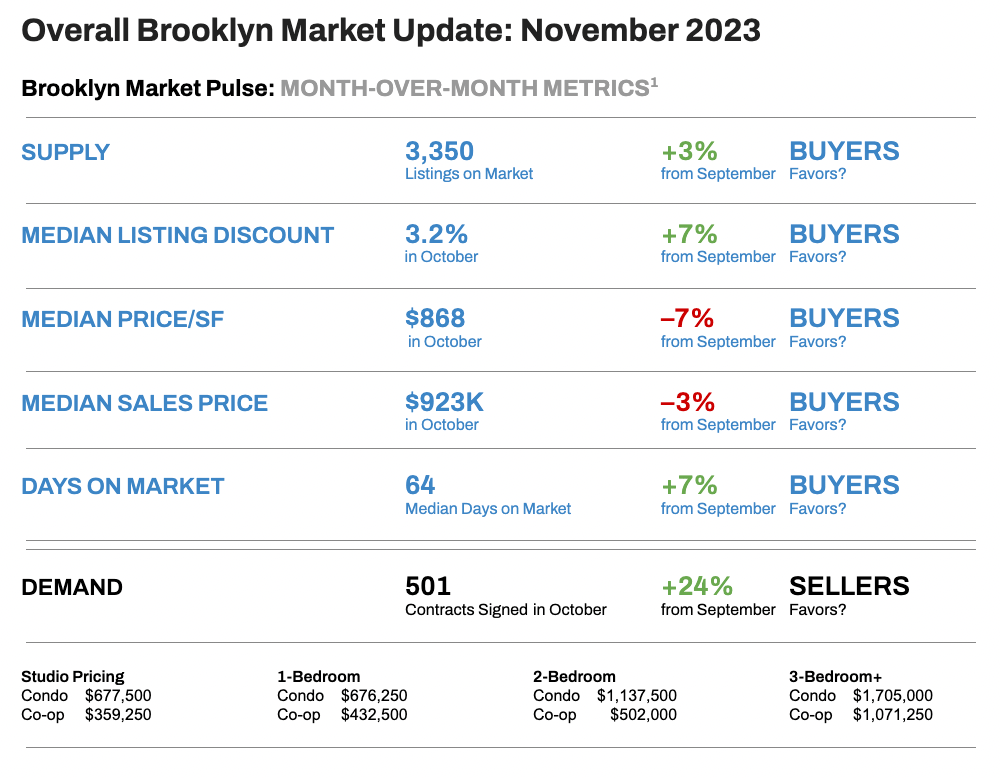
This month, while sellers are finding the market leaning slightly in their favor due to increased demand, buyers are not without their advantages.
Below, the Elegran | Forbes Global Properties Leverage Indicator provides a clear snapshot of the market, clearly showing whether it’s buyers or sellers who have transactional leverage.
This index is determined by 4 key metrics and how they've been trending since the last month:
- SUPPLY (favored BUYERS in October)
- DEMAND (favored SELLERS in October)
- MEDIAN LISTING DISCOUNT (favored BUYERS in October)
- MEDIAN PRICE/SF (favored BUYERS in October)
We’ll examine these four metrics individually before taking a look at the indicator.
Brooklyn Supply

Supply increases rapidly in September and October and typically peaks at the end of October before a sharp drop in November. Although the chart above displays less than 4 years of data, it shows that Brooklyn's supply follows a regular annual cadence. So, although Buyers enjoy more listings to choose from in October, while sellers suffer from more competition, that balance reverses course quickly in November.
What Does This Mean for?
- BUYERS? Peak October opportunities will decline sharply in November.
- SELLERS? Peak October competition will decrease sharply in November.
Brooklyn Demand

Brooklyn’s demand, measured by contracts signed, bottomed in September. Since then, it bounced back to 24% in October.
What Does This Mean for?
- BUYERS? More competition.
- SELLERS? More activity.
Brooklyn Median Price/SF

The median price per square foot has varied by 20% over the past 12 months and has declined since July.
What Does This Mean for?
- BUYERS? Prices are moving in their favor.
- SELLERS? Prices are moving against their interests.
Brooklyn Median Listing Discount

After a steep decline in Q2, the metric began ticking up again in September and October.
What Does This Mean for?
- BUYERS? Discounts are moving in their favor.
- SELLERS? Discounts are moving against their interests.
Elegran | Forbes Global Properties Leverage Indicator: Brooklyn
The Elegran | Forbes Global Properties Leverage Indicator signals who holds the upper hand in real estate transactions—buyers or sellers.
Looking at the graph below, this is indicated by the direction of the curve, where:
- An increasing trend from left to right indicates a seller’s market
- A decreasing trend from left to right indicates a buyer’s market
The relative strength of that leverage is indicated by the slope of the curve, where:
- A gentle slope indicates a weak advantage by one party over the other
- A sharp slope indicates a strong advantage
Although three of the four metrics powering the indicator favored buyers this month, the fourth, demand, shifted 24% toward sellers. This means sellers maintain a light grip on the market.

Rental Remarks
In September,* the median rent in Manhattan has cooled ever so slightly but remains near record highs. On the other hand, the average 30-Year Fixed Rate JUMBO Mortgage Index1 trend is near 8%. So, it’s a “catch-22” for renters, as the rent versus buy scale may feel equally punitive on both sides.
*August 2023 data is not yet available.
1Courtesy of Federal Reserve Bank of St. Louis

Investor Insights
All-Cash Opportunities
With Manhattan cap rates between 2.5 - 3.0% and the average JUMBO mortgage APR at 7.529%,2 there is simply no net income potential on leveraged investments. However, with rents near all-time highs, opportunities exist for all-cash buyers.
Global Currency Opportunities
On the sell side, a strong USD affords foreign investors, depending on their native currency, the opportunity to realize significant capital gains on selling their assets.
2Data courtesy of Wells Fargo, Chase, and Bank of America