
Manhattan Market Update: It Remains a Buyer’s Market
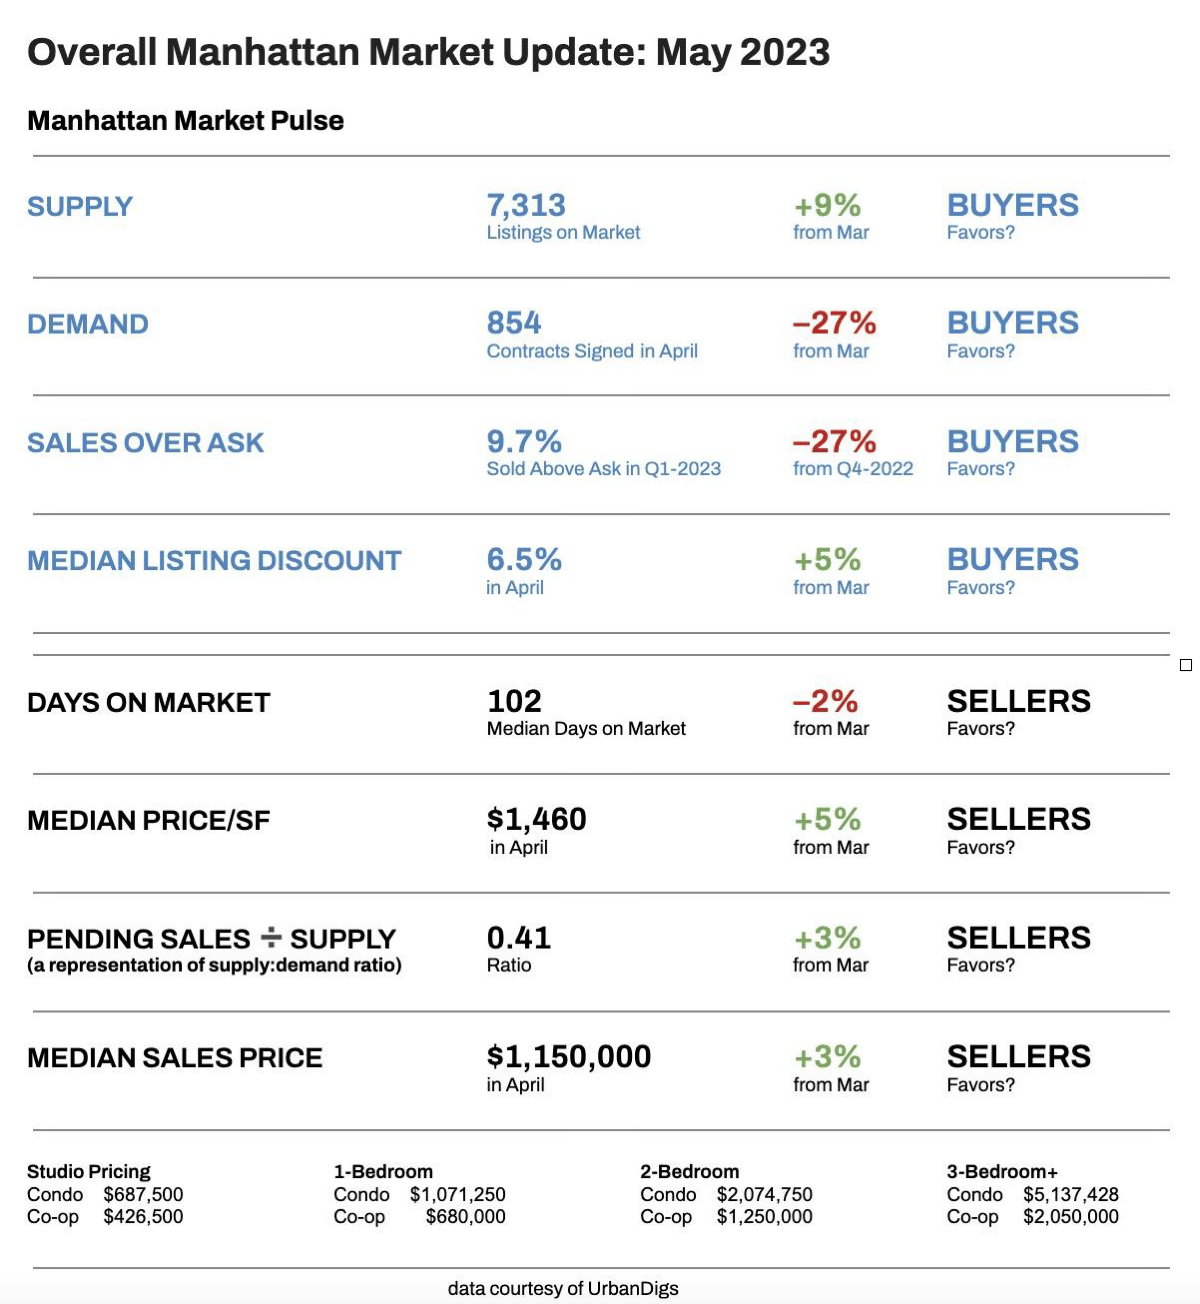
Elegran’s Leverage Indicator is a comprehensive market snapshot that informs us whether current market conditions favor buyers or sellers. In other words, it tells us which group has more transactional leverage.
Four metrics power our leverage indicator:
- SUPPLY
- DEMAND
- MEDIAN PRICE/SF
- MEDIAN LISTING DISCOUNT
Let’s examine these metrics individually before returning to the indicator and offering our verdict on the current state of the market.
Manhattan Supply
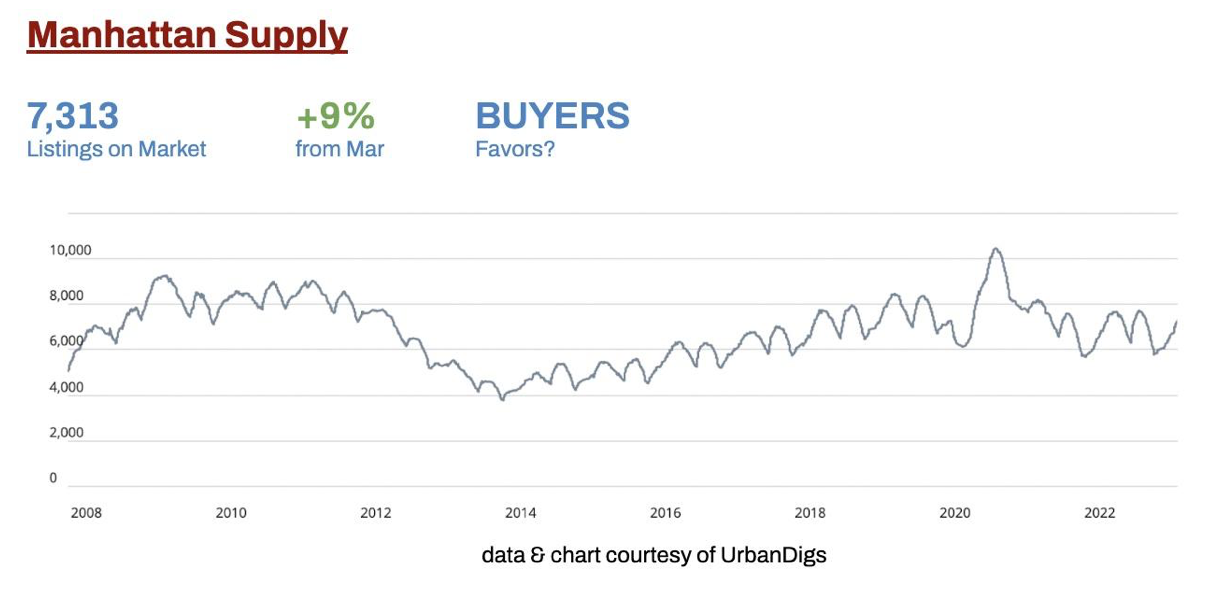
Like the years preceding it, the Manhattan supply level is increasing on its way to the June peak.
What Does This Mean for:
- BUYERS? They have more choices available.
- SELLERS? They face more competition with each other.
Manhattan Demand
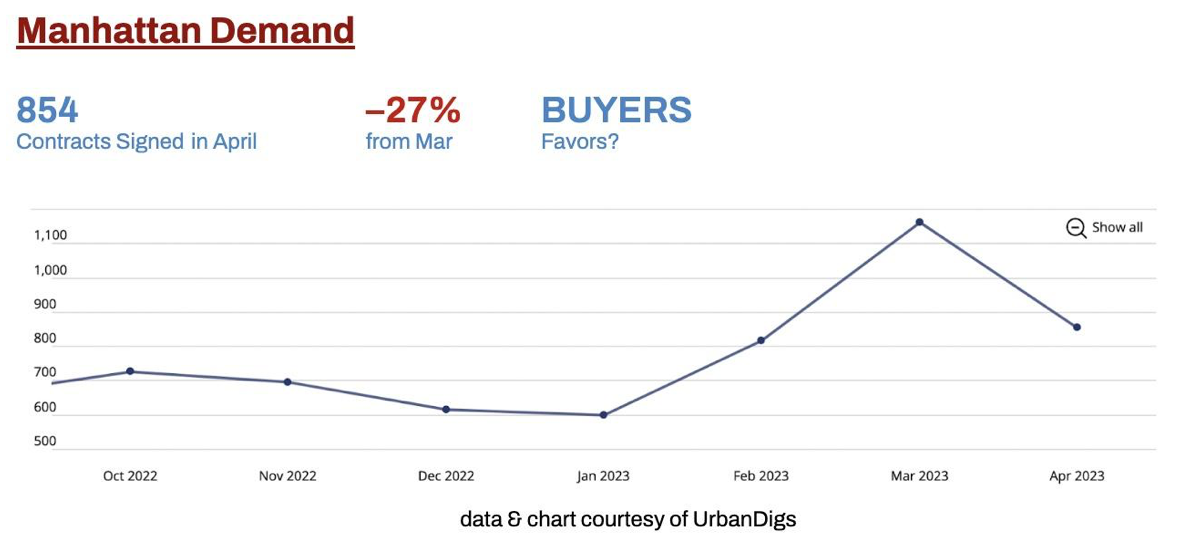
Manhattan contract activity peaked in March and fell in April, which is typical of spring’s seasonality in real estate.
What Does This Mean for:
- BUYERS? They face less competition with each other.
- SELLERS? There’s less activity among buyers.
Manhattan Median Price/SF
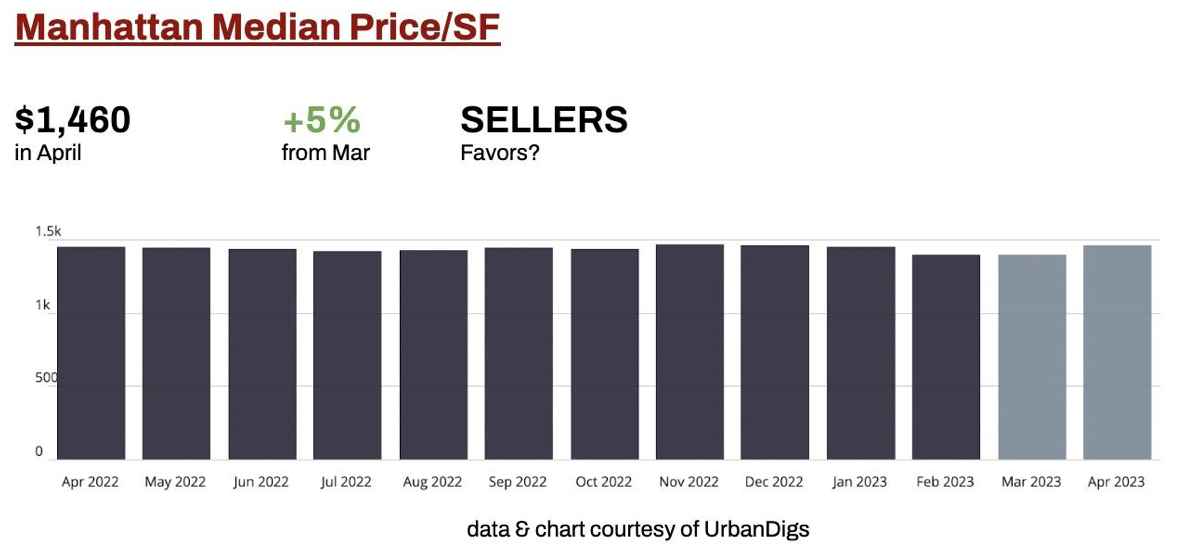
After trending downward slightly over the past few months, the median price per square foot in Manhattan increased in April.
What Does This Mean for:
- BUYERS? Price/SF is moving against their interest.
- SELLERS? Price/SF is moving in their favor.
Manhattan Median Listing Discount
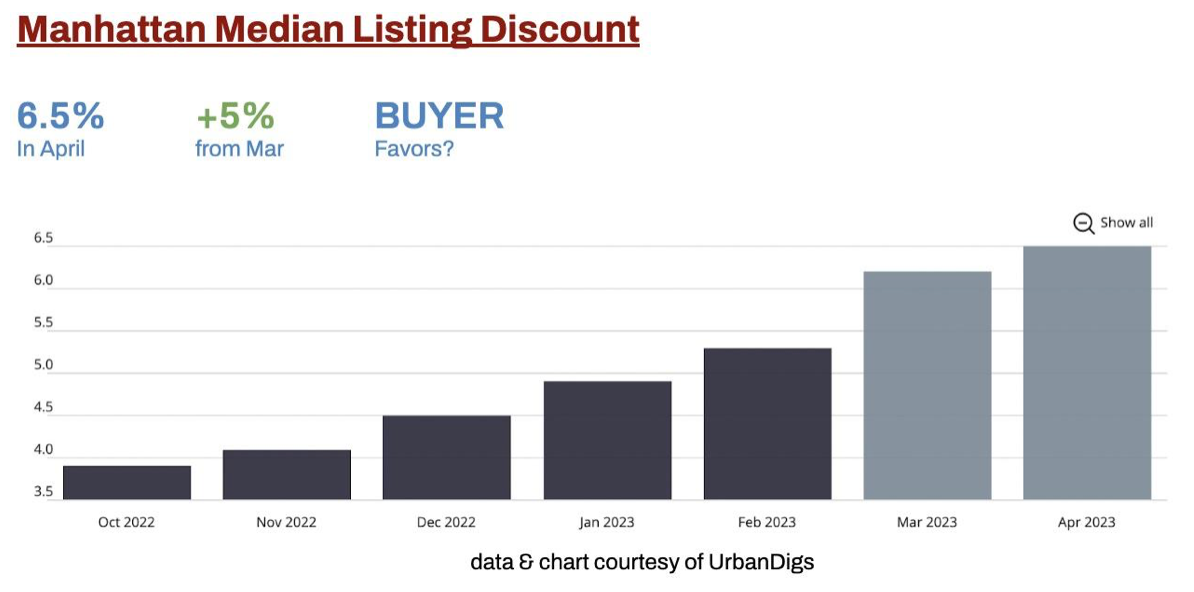
Listing discounts are still on the rise.
What Does This Mean for:
- BUYERS? Prices are moving in their favor.
- SELLERS? Prices are moving against their interest.
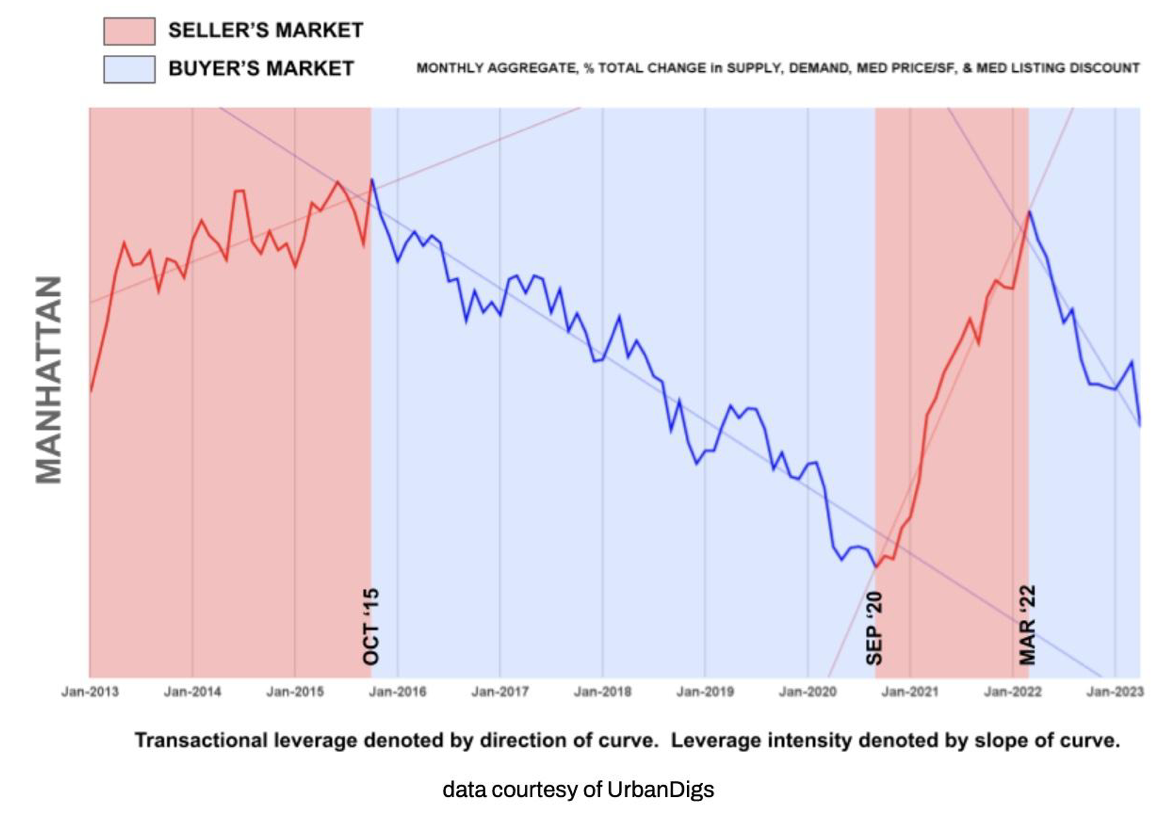
Elegran Leverage Indicator: Manhattan
Elegran’s Leverage Indicator informs us whether current market conditions favor buyers or sellers. In other words, it tells us which party has more transactional leverage over the other.
Looking at the graph below, this is indicated by the direction of the trendlines. Our indicator also tells us about the relative strength of that leverage, indicated by the slopes in those trendlines.
In October 2022, the curve flattened, followed by a reversal in direction from January to March 2023.
However, the direction of the curve has returned to that of a buyer’s market, and we now understand that there was a temporary reversal in spring due to the intense increase in buyer activity. Looking back, we can see the same spring uptick in the curve every year. We had just missed it previously.
The Verdict
Three of the four metrics that power our leverage indicator favor buyers, so it’s not surprising that leverage is still in buyers’ hands.
What Does This Mean for:
- BUYERS? They have the luxury of waiting for their ideal home prices.
- SELLERS? They feel a sense of urgency to transact quickly.
Rental Remarks
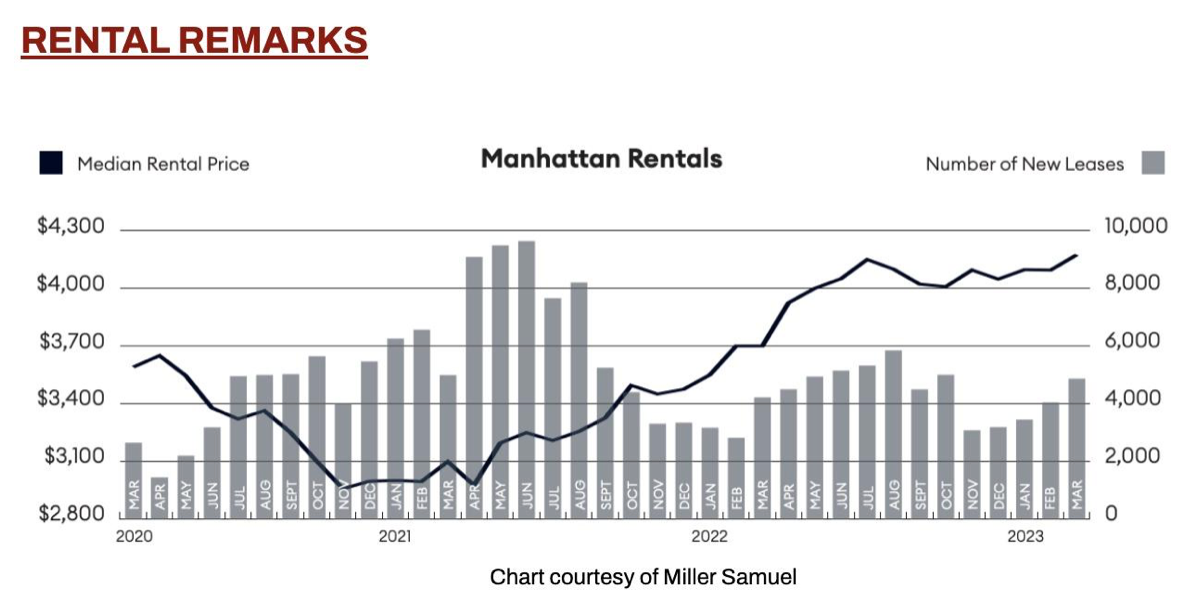
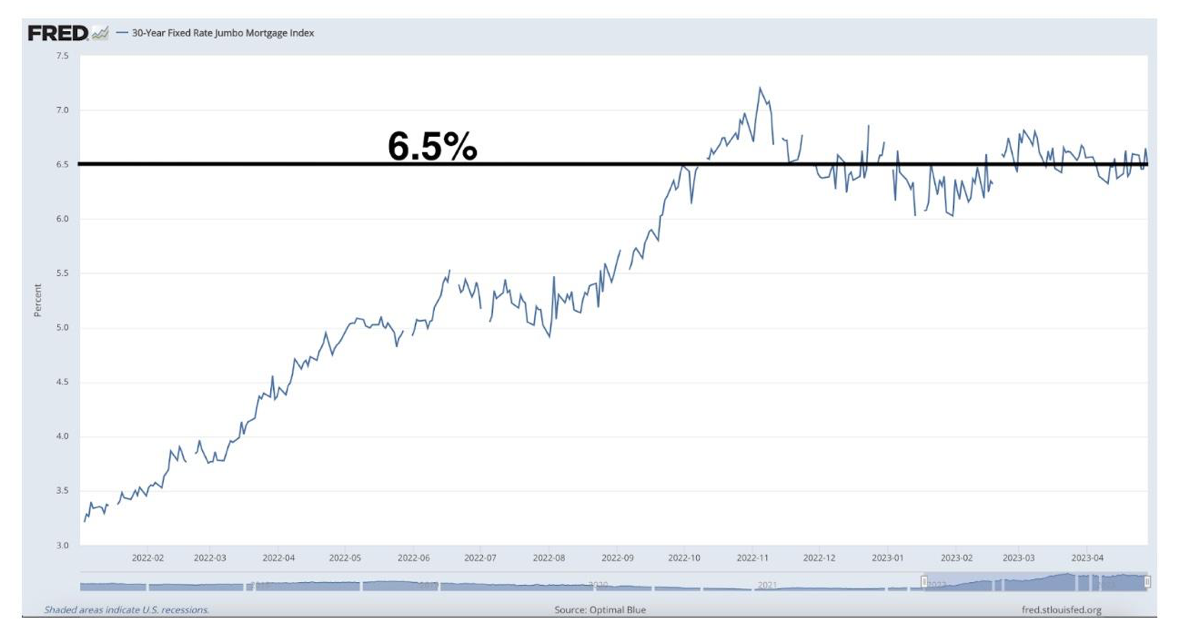
The median rent in Manhattan just hit a new high*, and the average 30-year JUMBO mortgage rate is 6.5%. It’s a “catch-22” for renters, as the rent vs. buy scale may feel equally punitive on both sides.
* March 2023 numbers, as April 2023 data is not yet available
Investor Insights
With NYC cap rates between 2.5 and 3.0%, plus mortgage rates at 6.5%, there’s simply no net income potential on leveraged investments. That said, however, with rents at all-time highs, opportunities exist for all-cash buyers.
On the sell side, a relatively strong US dollar allows foreign investors to produce significant capital gains upon the sale of their assets, depending on their native currency.
On the buy side, the weakening dollar creates opportunities for foreigners to purchase Manhattan real estate and lock in its notorious stability and potential for price appreciation.