
BROOKLYN SPRING 2026: EQUILIBRIUM HOLDS AS DEMAND RECOVERS
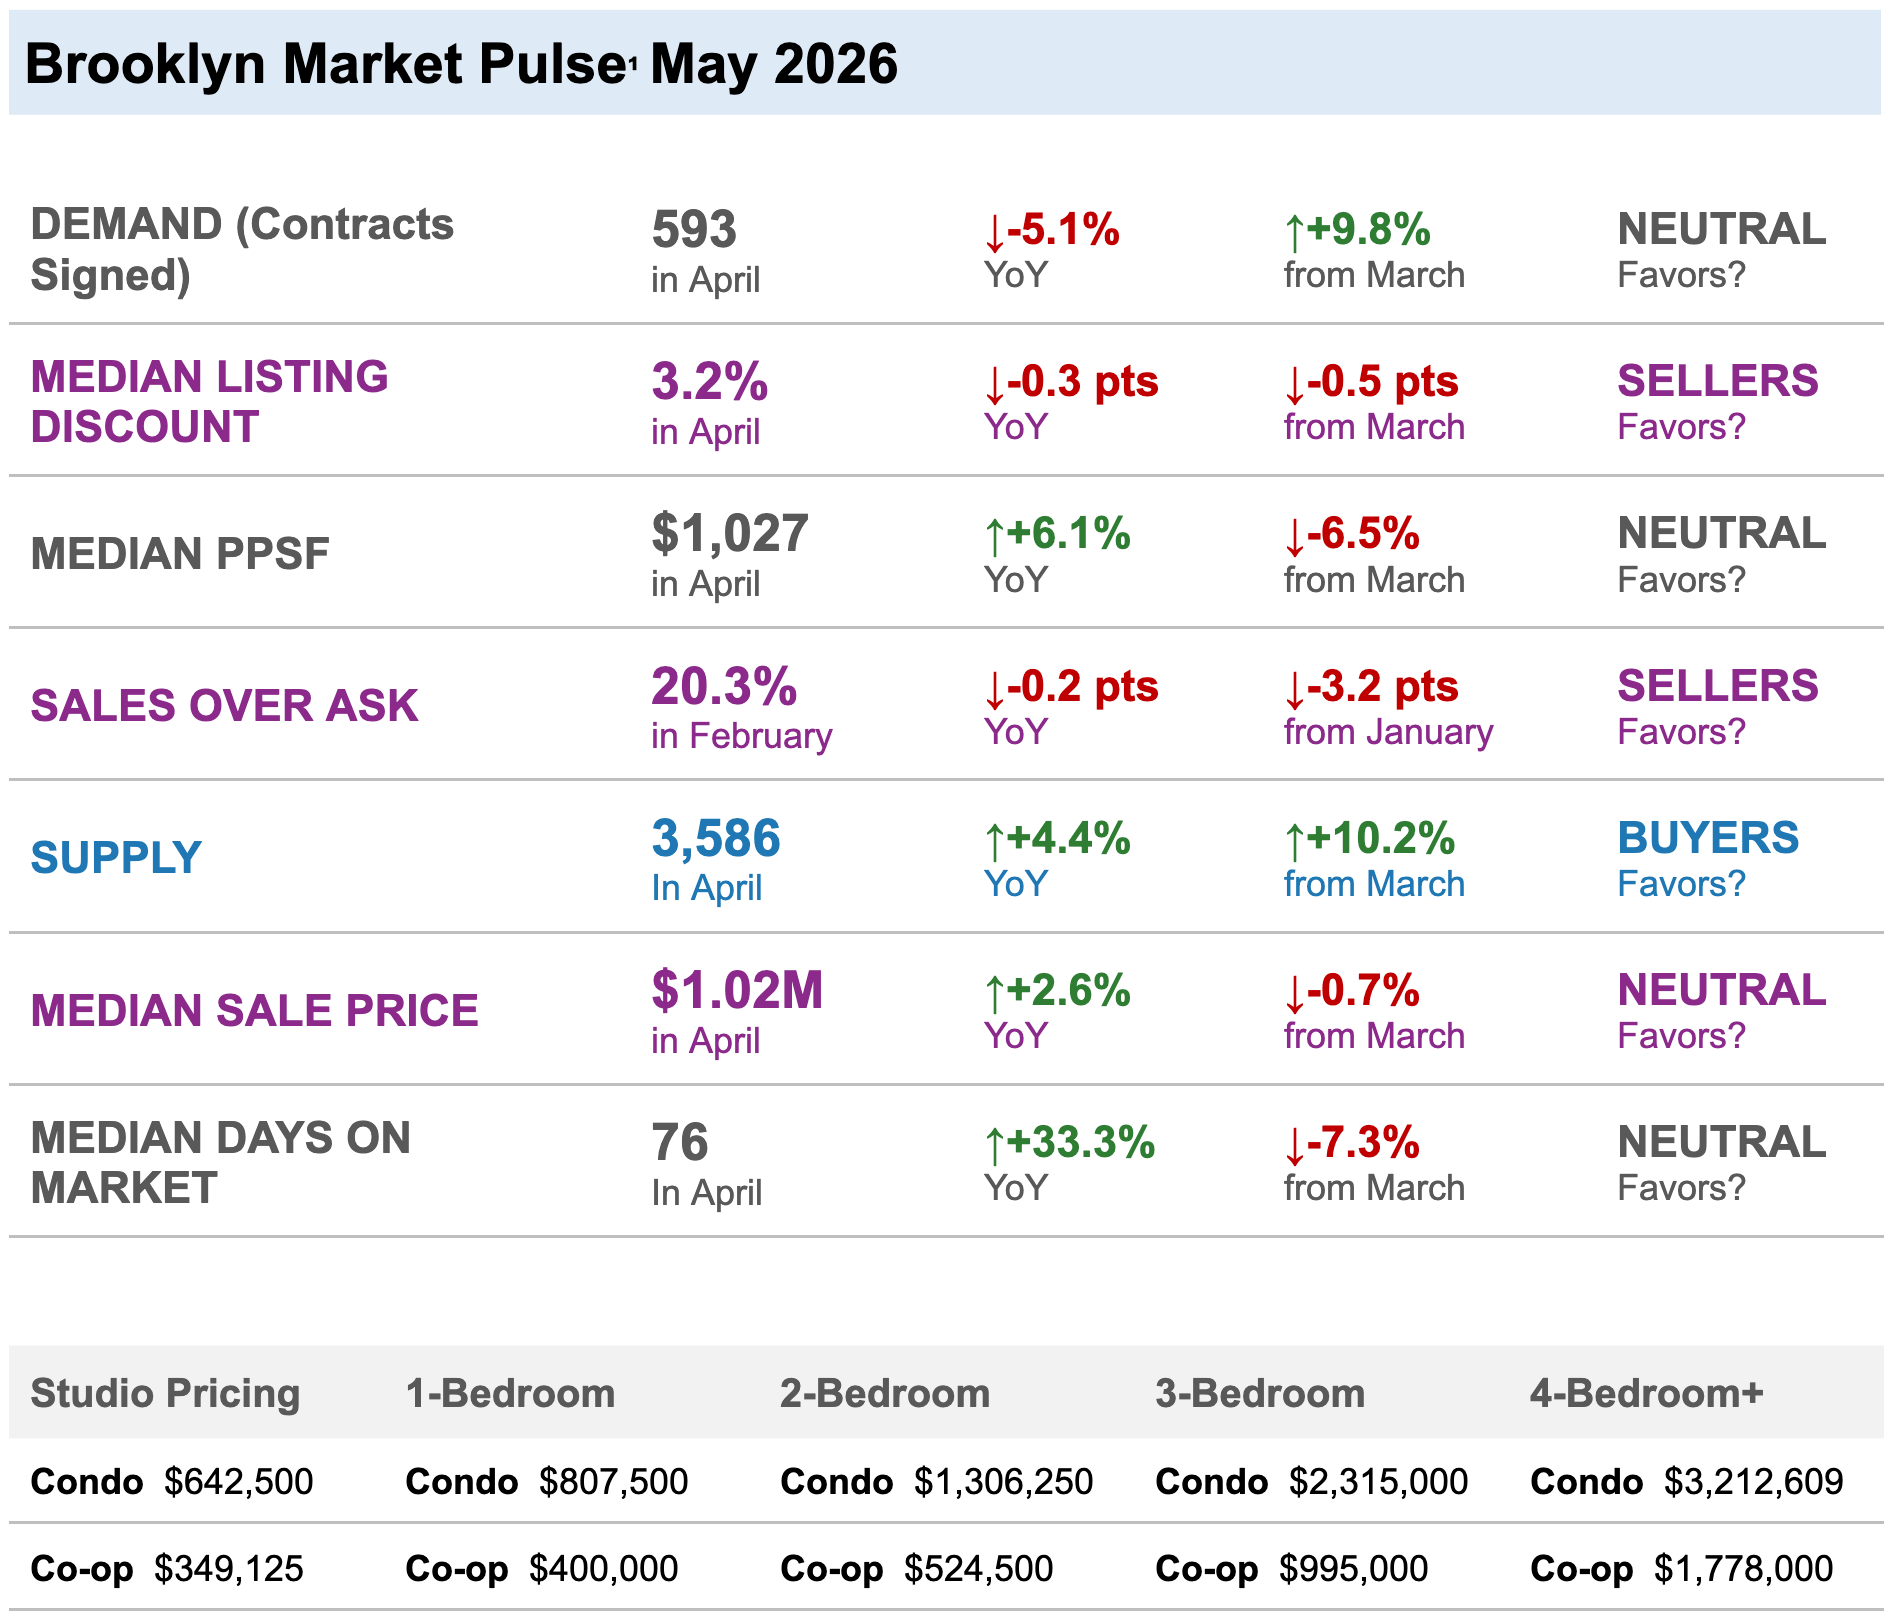
Brooklyn entered May 2026 with a market in transition — not from good to bad, but from seller-favored to balanced. The Howard Hanna NYC Brooklyn Leverage Index² moved modestly toward buyer territory in April, reflecting a coherent but mixed picture: supply is rising year-over-year, days on market remain elevated, and contract volume is recovering but not yet at 2025 levels. At the same time, median PPSF is up 6.1% year-over-year, the listing discount has compressed to 3.2%, and 20.3% of sales are still closing above asking price.
This is not a buyer's market or a seller's market. It is a market where outcome is determined by asset quality and pricing precision — where strong properties in desirable locations continue to command competition, and where everything else negotiates. Understanding that distinction is the difference between a well-executed transaction and a mispriced one.
MARKET SNAPSHOT: FIVE NUMBERS THAT MATTER
-
593 contracts signed in April — up 9.8% from March, with the year-over-year deficit narrowing from −8.4% to −5.1%. The direction of travel is the story.
-
3,586 active listings — up 4.4% year-over-year, giving Brooklyn buyers more options than Manhattan and putting real pressure on sellers to price competitively from day one.
-
$1.02M median sale price — up 2.6% year-over-year and holding above the $1M threshold, reflecting continued long-term appreciation despite a more balanced market.
-
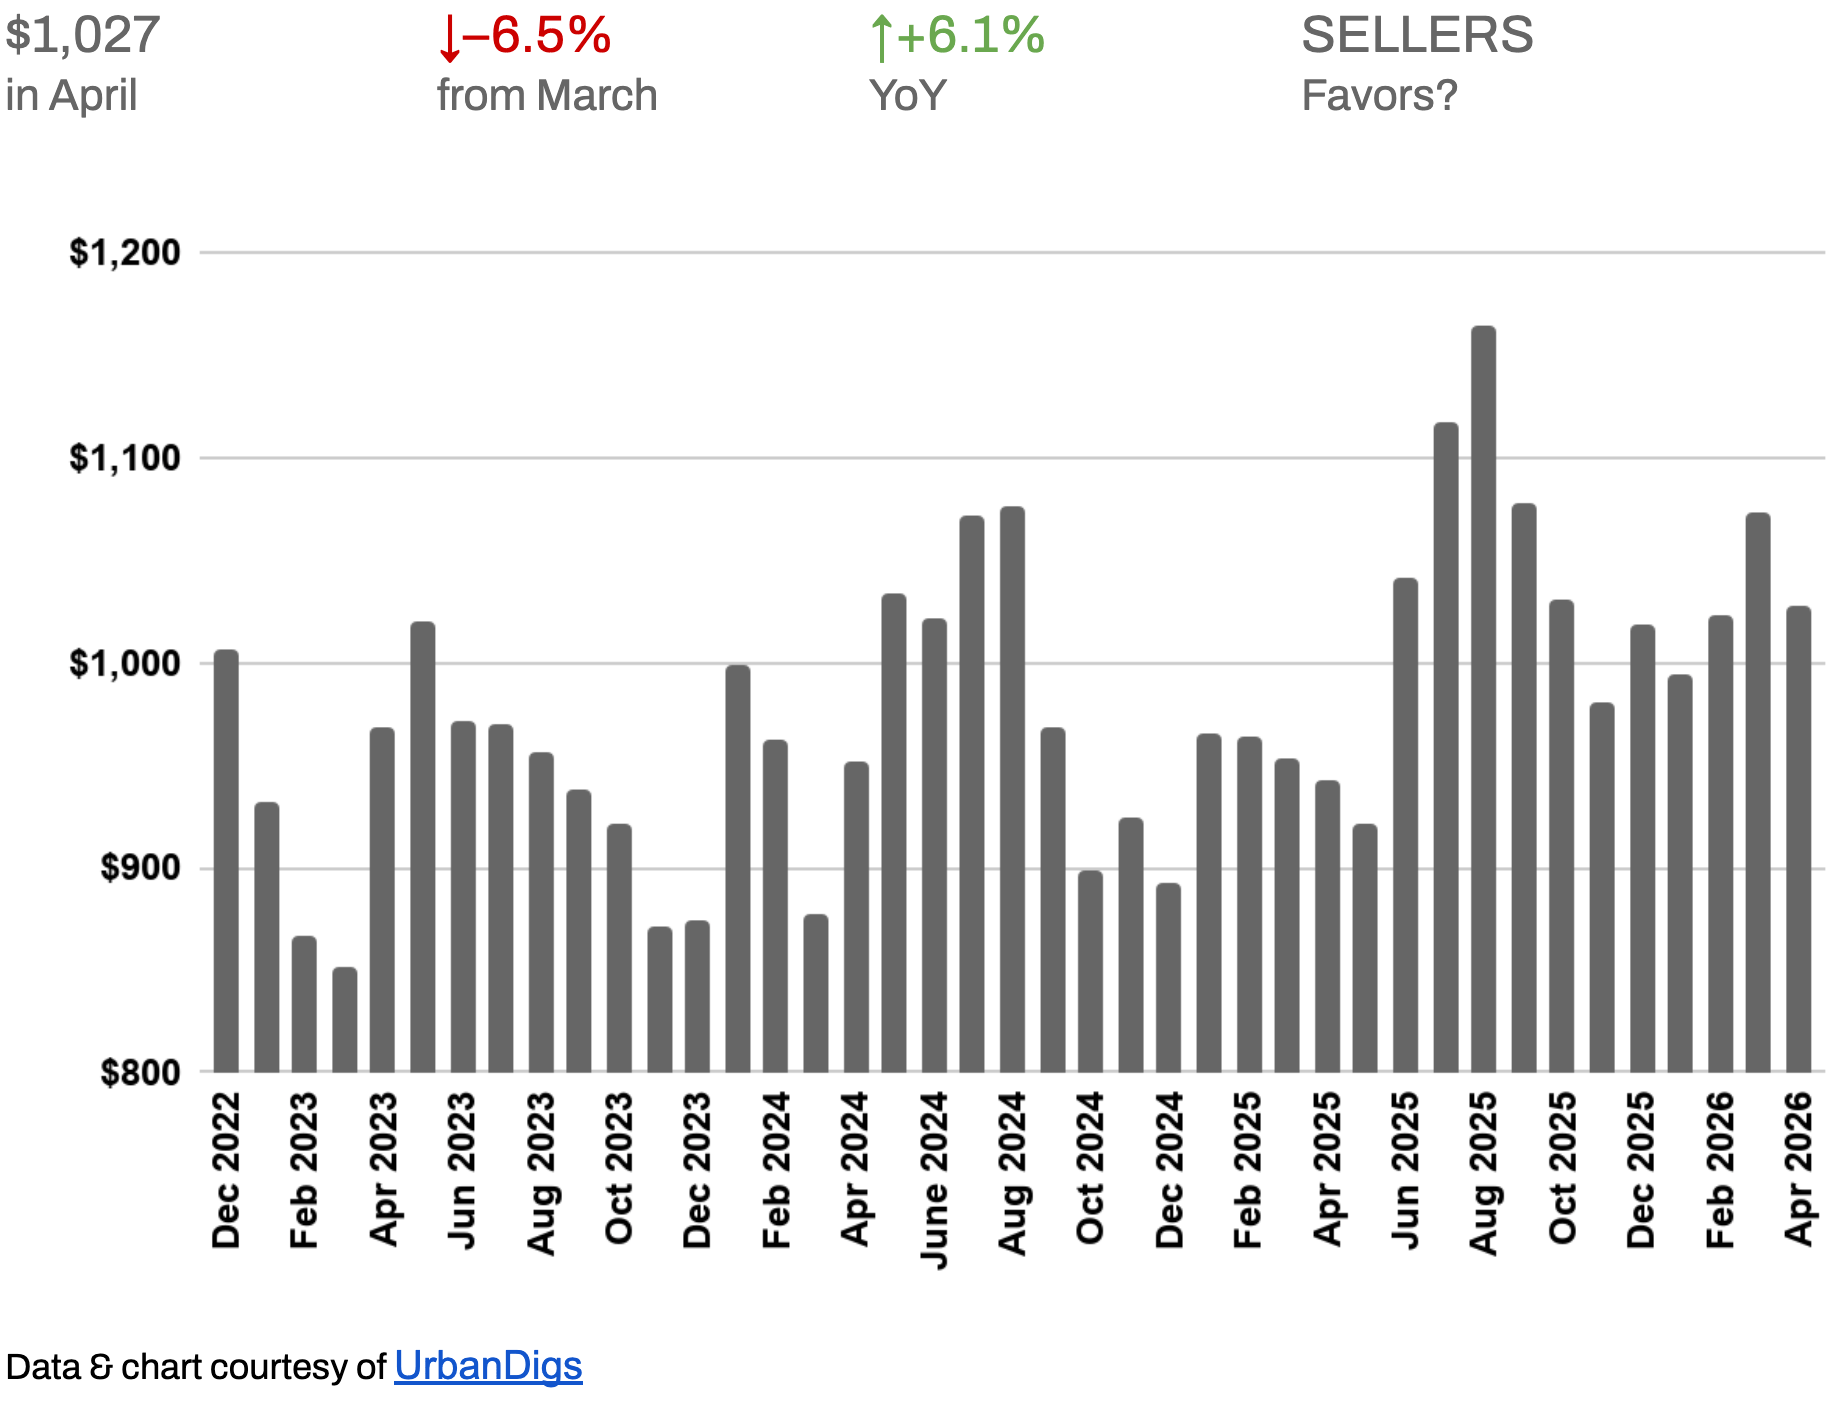
$1,027 median price per square foot — up 6.1% year-over-year. The MoM dip reflects transaction mix, not price weakness. The YoY trend is the reliable signal.
-
3.2% median listing discount — compressed 0.5 pts from March and now at its tightest level since late 2025, signaling that well-priced assets are still trading close to ask.
KEY TAKEAWAYS
-
Contracts recovered +9.8% MoM to 593 — two consecutive months of MoM growth, narrowing the YoY gap to −5.1%, the smallest deficit since late 2025.
-
Supply rose +4.4% YoY to 3,586 — Brooklyn remains the clearest contrast to Manhattan, where inventory is still 7.4% below last year.
-
Median PPSF at $1,027 is up 6.1% YoY — the underlying pricing floor is firm and appreciating.
-
Listing discount compressed to 3.2% — signal flipped from Buyers to Sellers as spring demand absorbed inventory pressure.
-
Median sale price holds at $1.02M, up 2.6% YoY — Brooklyn's long-term appreciation story remains intact.
-
Days on market at 76 are down 7.3% from March but remain +33.3% YoY — the critical reminder that overpriced listings are sitting while well-priced ones move.
-
20.3% of sales closed above asking price — premium assets in strong locations still attract competitive offers.
OUTLOOK
Brooklyn's spring 2026 story is one of normalization, not deterioration. The market has moved from the structurally seller-favored conditions of 2021–2022 toward something closer to equilibrium — where pricing discipline determines outcomes more than macro tailwinds. For buyers, Brooklyn offers more negotiating room and more inventory than Manhattan. For sellers with well-located, well-priced assets, competition remains real. The spring window is open; the margin for pricing error is not.

Photo by Rihards Gederts | Howard Hanna NYC
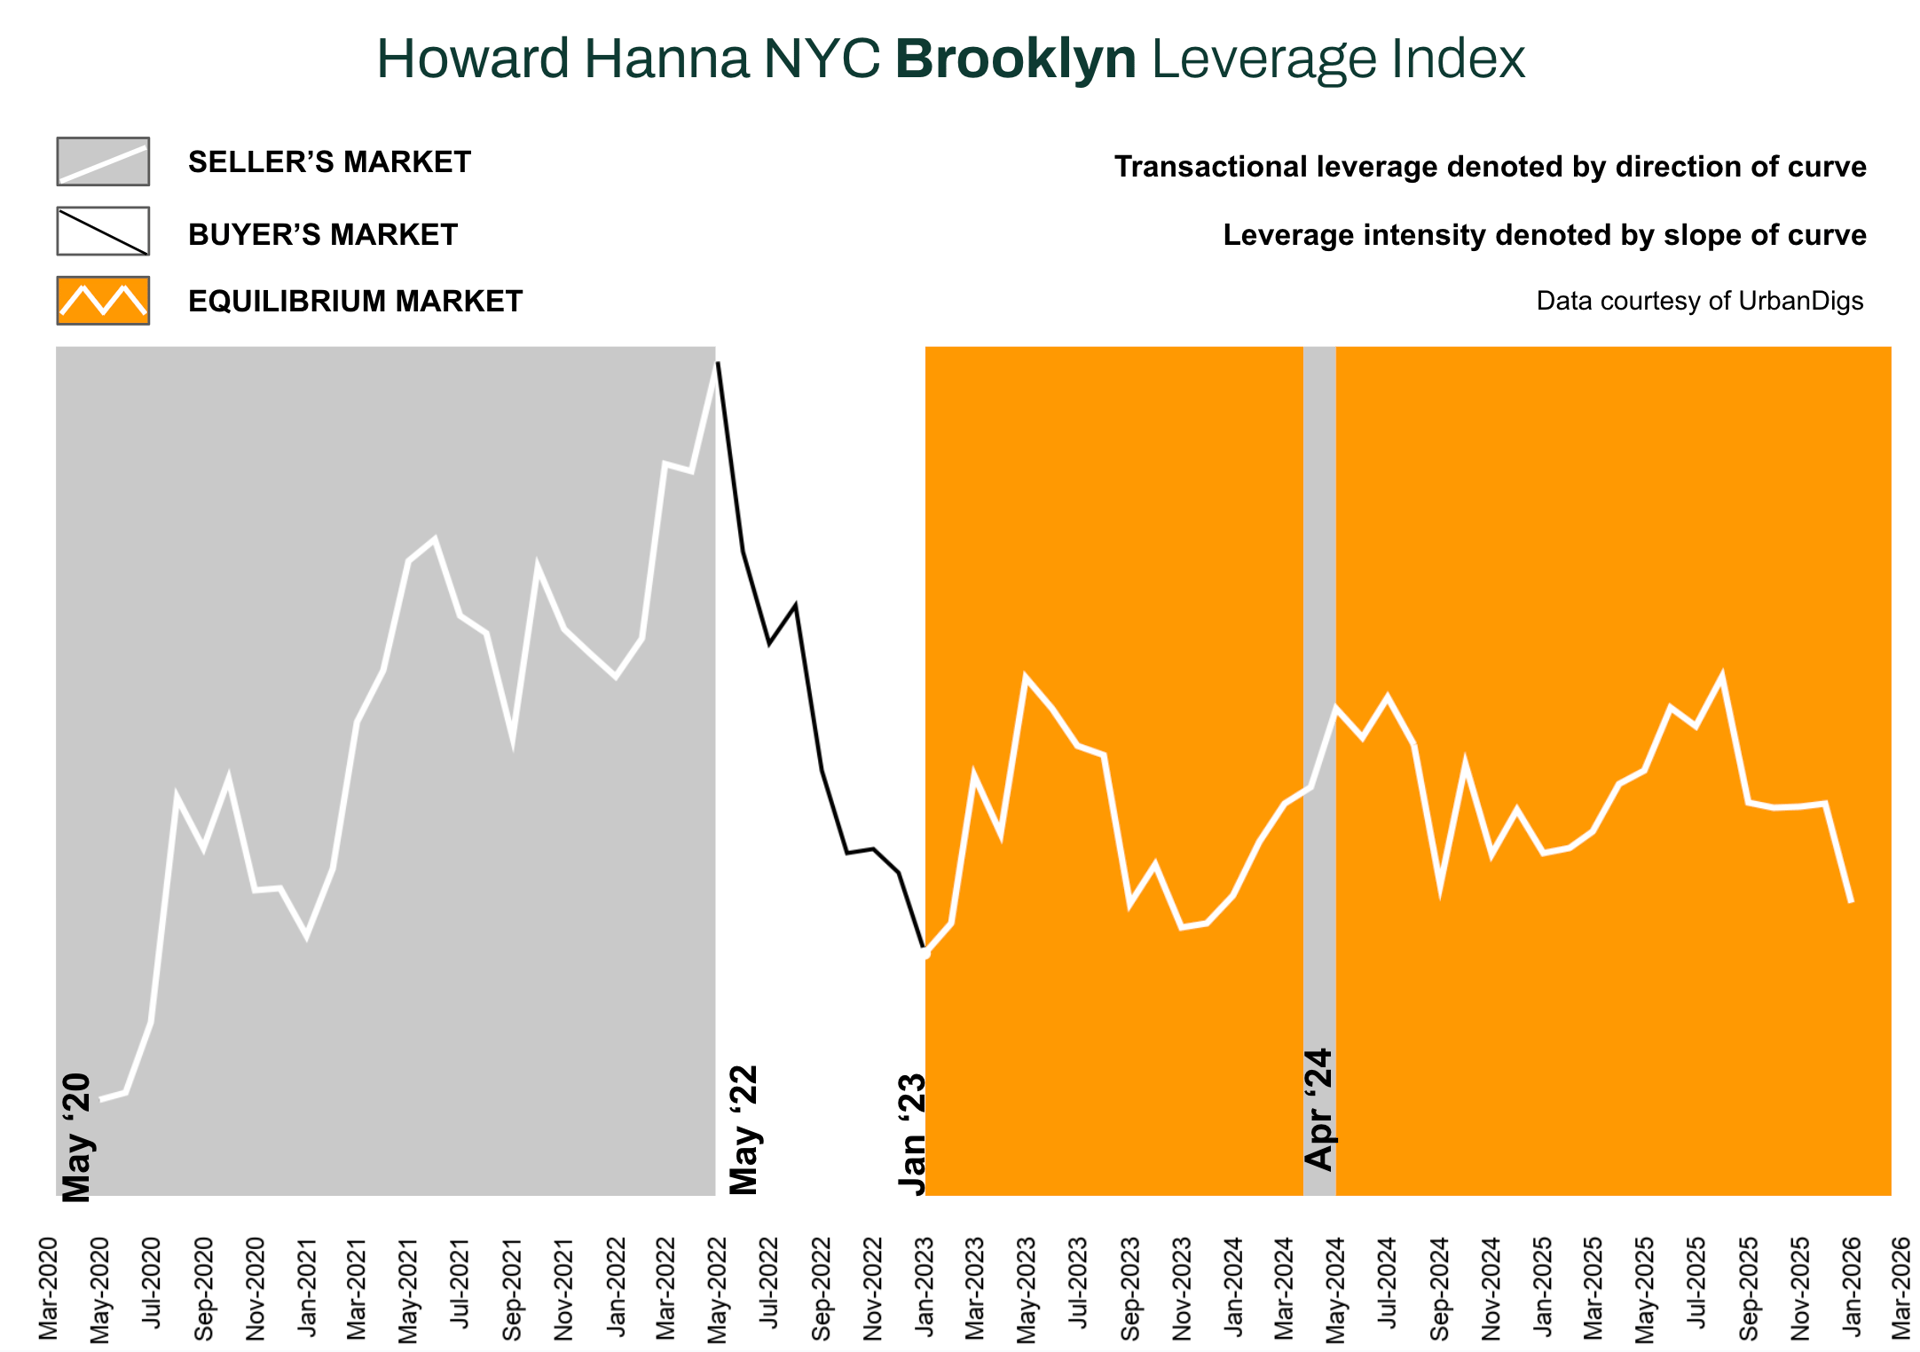
Howard Hanna NYC Brooklyn Leverage Index
The Howard Hanna NYC Brooklyn Leverage Index blends four market signals - supply, demand, median price per square foot, and median listing discount - to capture the balance of power between buyers and sellers.
Direction Matters:
-
An upward-sloping curve = seller’s market
-
A downward-sloping curve = buyer’s market
-
The steeper the slope, the stronger the advantage for either side
In April 2026, the index moved modestly toward buyer territory — a notable divergence from Manhattan, where the index held in seller-leaning territory. Of its four core inputs: supply favors buyers; the listing discount favors sellers; demand sits in neutral territory, leaning slightly buyer-ward given the year-over-year contraction in contracts; and median PPSF signals neutral with a slight buyer lean on the MoM reading, offset by strong YoY appreciation. The aggregate reading places the index in equilibrium, tilted marginally toward buyers — but not yet in buyer's market territory. If May carries a similar trajectory, the index could move more decisively toward buyers as we enter summer in June 2026.
The takeaway is not that Brooklyn has become a buyer's market — it is that the leverage balance has normalized relative to the seller-dominated conditions of 2021–2022. Asset quality and pricing precision now determine outcomes more than structural market dynamics.
Brooklyn Supply
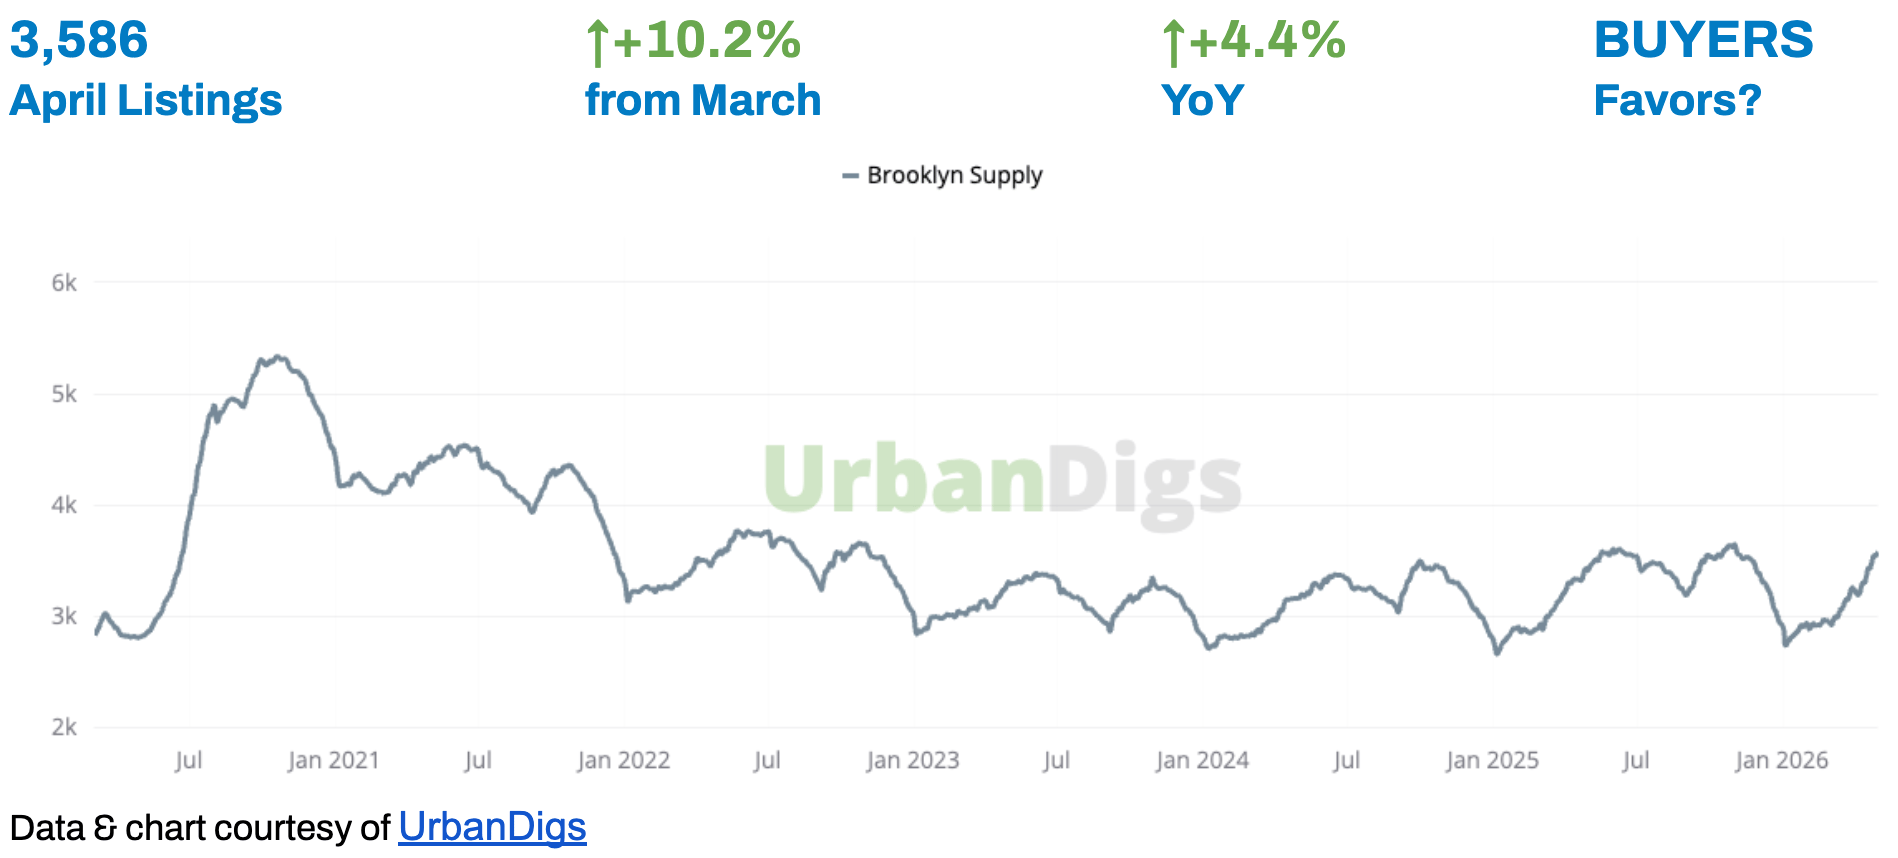
BROOKLYN INVENTORY RISES ABOVE LAST YEAR — A DIFFERENT STORY THAN MANHATTAN
Brooklyn's active listing count reached 3,586 in April, up 10.2% from March and 4.4% above April 2025. This is the sharpest contrast with Manhattan, where inventory remains 7.4% below last year. In Brooklyn, buyers have more options heading into spring, and sellers cannot rely on structural scarcity to do the pricing work for them.
Context matters: the 4.4% year-over-year increase does not indicate oversupply. It indicates normalization. Brooklyn inventory spent much of 2022–2024 at historically depressed levels; what we are seeing now is a return toward equilibrium, not a flood.
🟦 Buyers: More selection than a year ago, and more negotiating room than in Manhattan. Use this spring window strategically — rising inventory means fewer bidding wars on mid-market listings, though well-priced premium properties still attract competition.
🟪 Sellers: Accurate pricing from day one is no longer advisable — it is the defining factor between a smooth transaction and a lengthy, discount-driven one. Inventory is rising, days on market are up 33.3% YoY, and buyers have options.
Outlook: Inventory will continue its seasonal rise through May. Unless demand accelerates sharply, the supply-demand balance will remain closer to equilibrium than to either extreme — meaning price discovery will be driven by individual asset quality rather than market-wide scarcity.
Brooklyn Demand
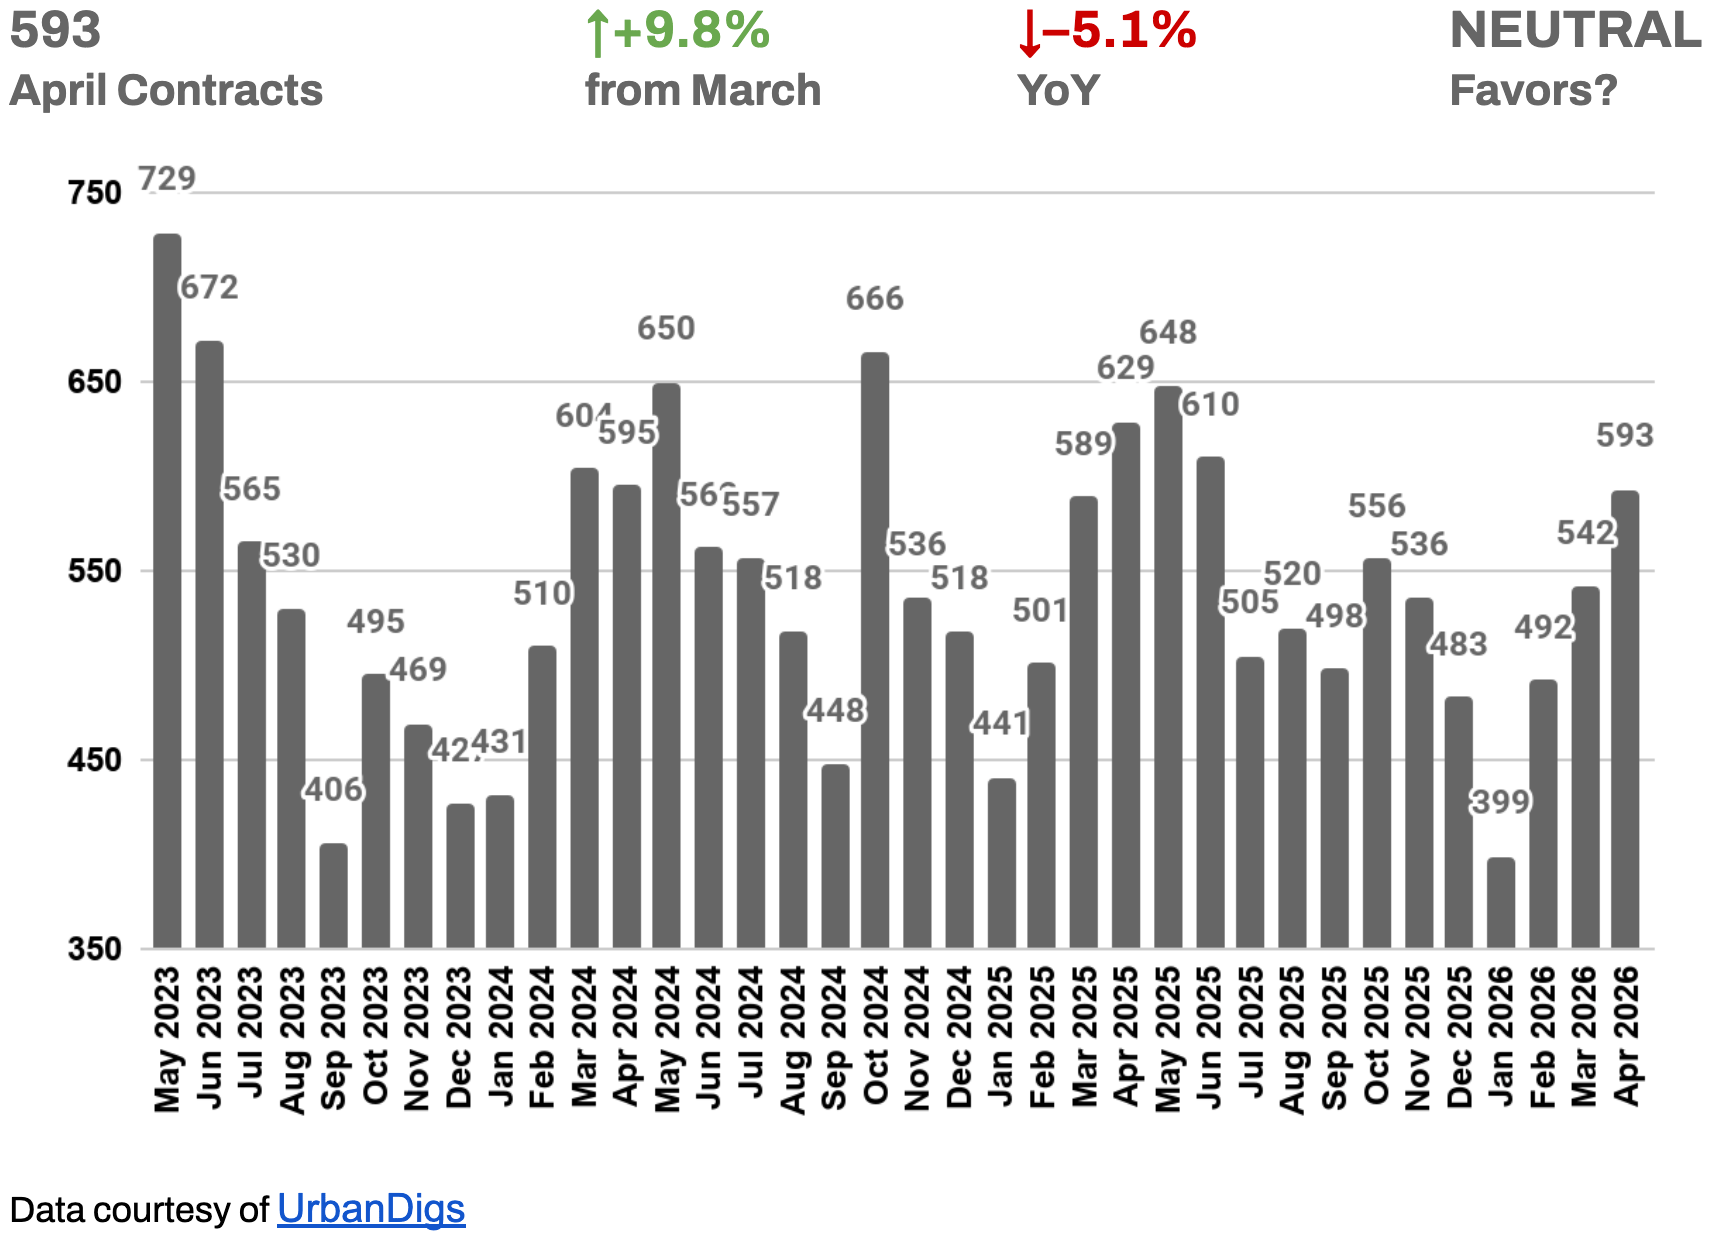
YoY GAP NARROWS — SPRING DEMAND IS CLOSING THE DISTANCE
April brought 593 signed contracts, up 9.8% from March and narrowing the year-over-year deficit from −8.4% in March to −5.1% — the smallest YoY gap since late 2025. The direction of travel matters here: Brooklyn demand is not recovering in a straight line, but it is recovering. Two consecutive months of MoM growth, with the YoY shortfall shrinking each month, points to genuine spring engagement rather than a statistical bounce.
The gap with 2025 remains honest context: Brooklyn buyers are still rate-sensitive and selective. But at 593 contracts, demand is firmly within its recent mid-cycle range and trending the right direction.
🟦 Buyers: Spring has arrived and competition for well-priced, well-located properties is building. This window offers a better inventory-to-competition ratio than the fall cycle is likely to deliver.
🟪 Sellers: The MoM rebound is real and working in your favor — but the −5.1% YoY reminder stands: the market is not self-correcting for overpricing. Accurate pricing from day one captures the spring momentum; ambition squanders it.
Outlook: If April's trajectory holds, May could see the YoY gap close further or flip to flat. A full recovery to 2025 peak levels remains rate-dependent — but the trend no longer requires that scenario to tell a positive story.
Brooklyn Median PPSF
STRONG YoY APPRECIATION — MoM REFLECTS MIX SHIFT, NOT PRICE WEAKNESS
Median PPSF reached $1,027 in April — up a strong 6.1% year-over-year, but down 6.5% from March's elevated reading. The MoM decline is a mix-shift effect: March's high reading reflected a concentration of premium, larger-unit transactions; April's broader transaction pool pulled the median back toward its underlying trend. The YoY number is the more reliable signal — and at +6.1%, Brooklyn's per-square-foot appreciation is among the strongest of any major market nationally.
🟦 Buyers: Co-ops continue to offer meaningful PPSF value relative to condos. The YoY appreciation trend suggests that waiting for lower PPSF is unlikely to be a productive strategy.
🟪 Sellers: The underlying pricing floor is firm and appreciating. Premium finishes, natural light, and functional layouts continue to command PPSF premiums above the median.
Outlook: PPSF is expected to remain in the $1,000–$1,060 range through Q2, with variability driven by transaction mix rather than fundamental price movement.
Brooklyn Median Listing Discount
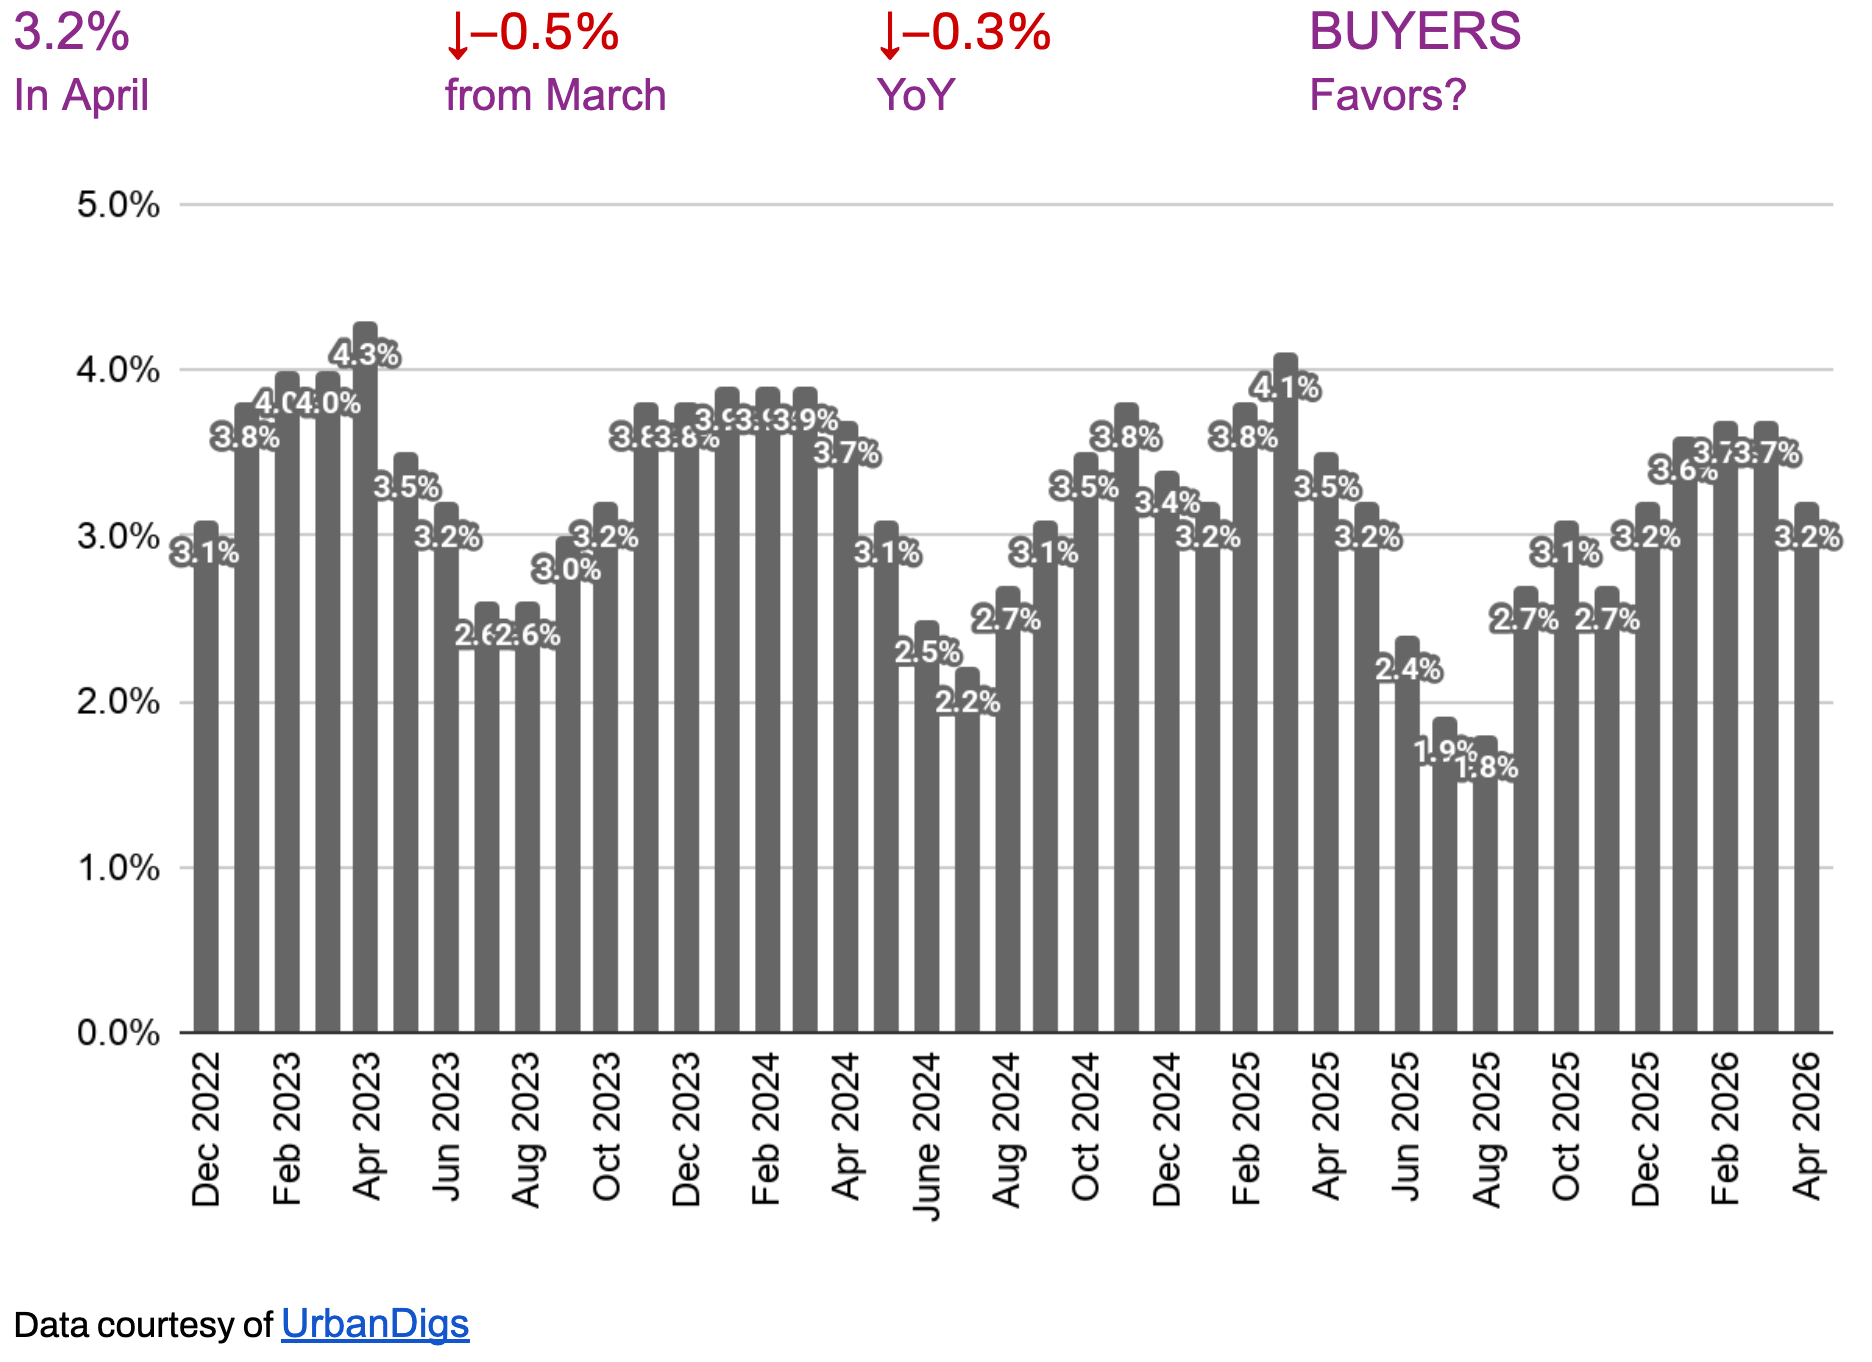
3.2% DISCOUNT: SIGNAL FLIPS TO SELLERS AS SPRING DEMAND ABSORBS SUPPLY
The median listing discount compressed to 3.2% in April — down 0.5% from March and 0.3% below April 2025, flipping the market signal from Buyers to Sellers for the first time since late 2025. In practical terms, properties are trading at approximately 96.8 cents on the dollar of their last asking price. For a $1M listing, that is roughly $32,000 of negotiating room — and it is shrinking.
The compression is notable because it is happening alongside rising inventory and above-average days on market — two conditions that would normally widen discounts, not compress them. The fact that discounts are tightening anyway reflects a clear divide: premium, well-priced assets are closing with minimal or no discount, while longer-sitting listings are absorbing larger concessions. The average is being pulled down by quality, not across-the-board pricing pressure.
🟦 Buyers: The negotiating window is narrowing. It still exists — particularly on properties that have been on market more than 45 days or have already taken price reductions. On fresh, well-priced listings, expect to pay close to ask.
🟪 Sellers: The signal has moved in your favor. A 3.2% market discount means accurate pricing from day one closes quickly and cleanly. Overpricing into this market pulls your listing into the longer-sitting cohort — which is dragging the average up, not helping it.
Outlook: Discounts are unlikely to compress materially further unless spring demand accelerates sharply. The more likely scenario is that the 3.0–3.5% range holds through Q2, with individual outcomes determined by asset quality and initial pricing precision rather than macro conditions.
RENTAL REMARKS
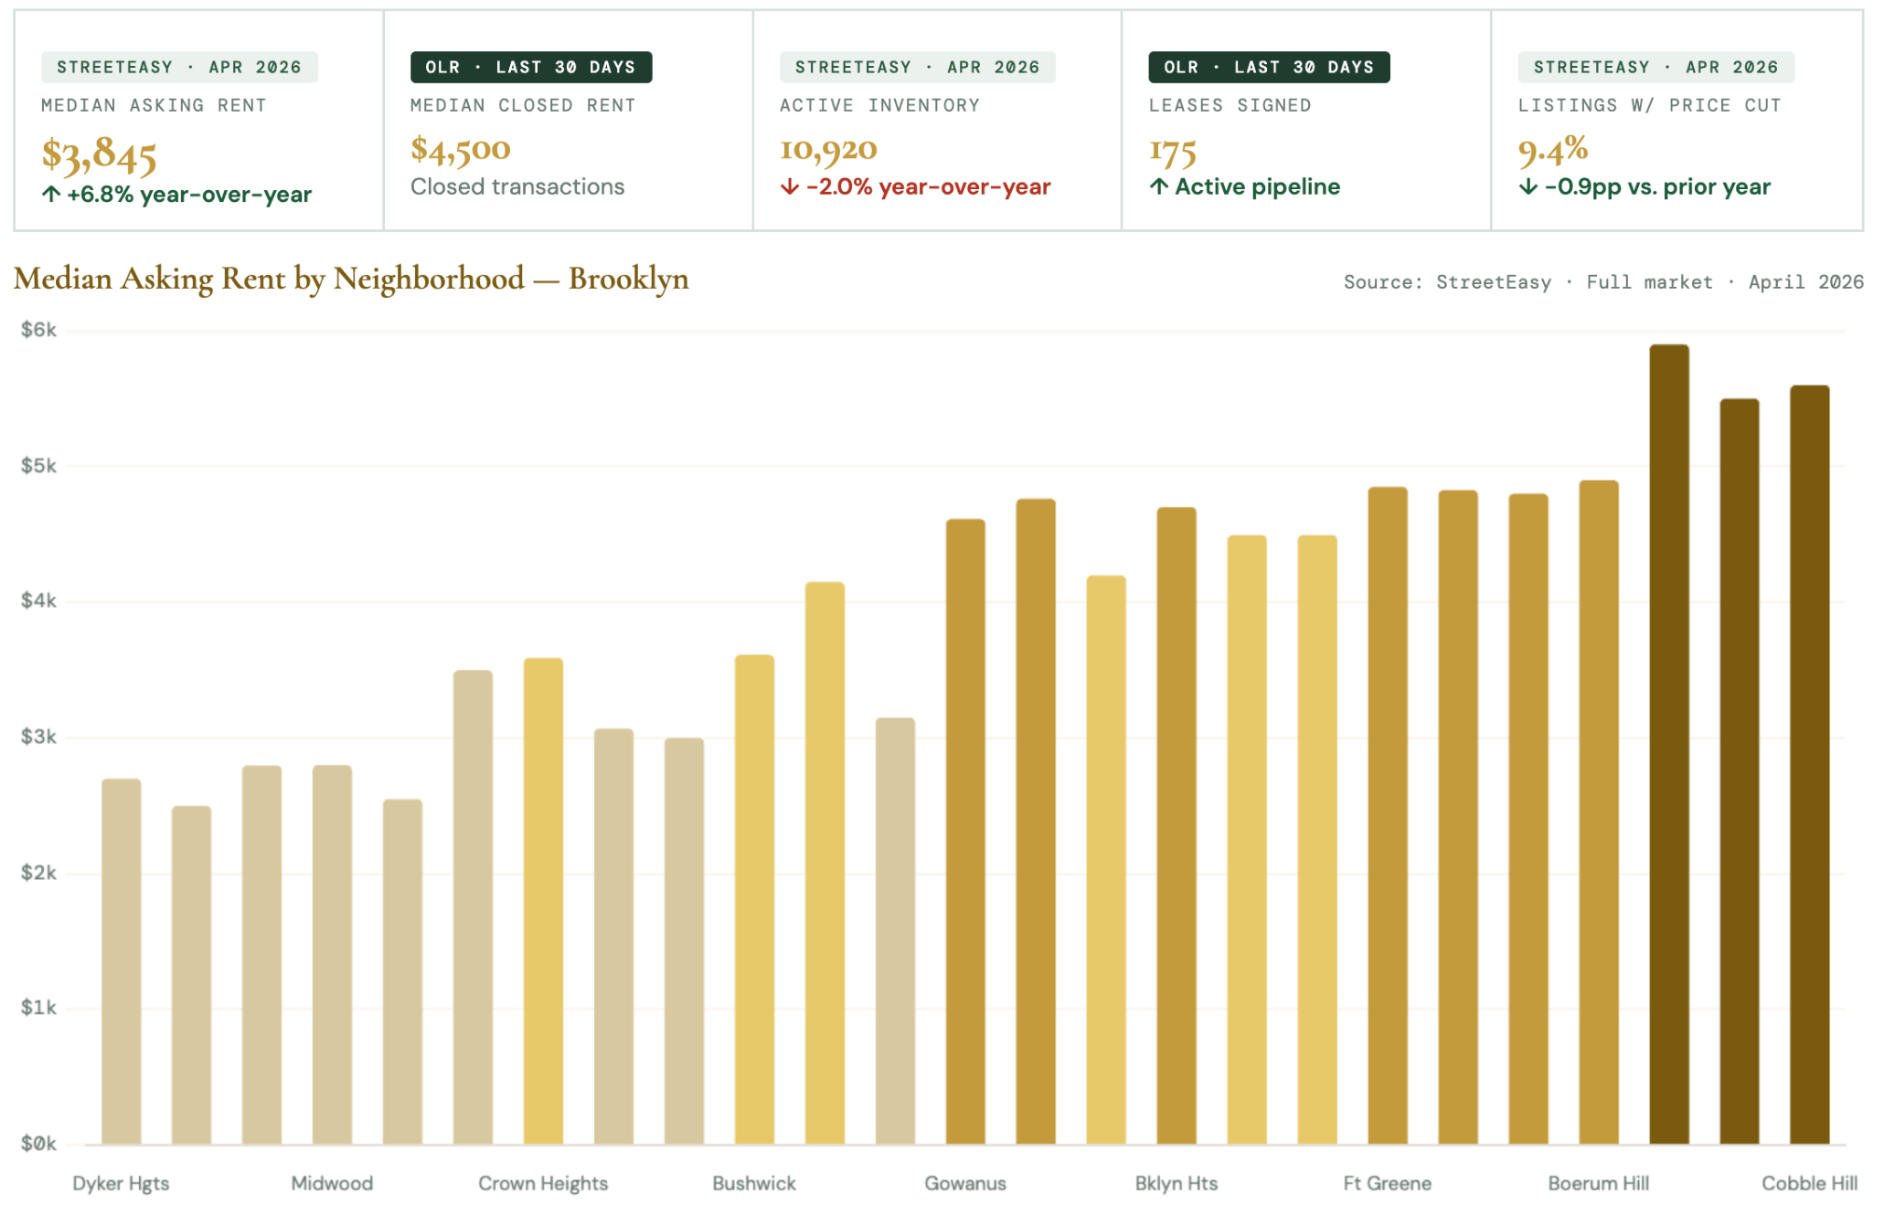
Brooklyn's median asking rent reached $3,845 in April — up 6.8% year-over-year for the sixth consecutive month of annual growth. Both sources confirm the same direction: rents rising, landlord pricing power firm. Note: OLR's closed median of $4,500 skews toward premium sub-markets within the 500-listing cap; StreetEasy's full-market figure better represents the typical renter. Carroll Gardens (+22%, $5,500) and Fort Greene (+11.5%, $4,850) lead on appreciation.
Williamsburg and Downtown Brooklyn lead on volume (88 closed deals each). Bedford-Stuyvesant ($3,499, +3.7%) remains Brooklyn's most accessible entry point.
For Renters: High competition, but more choice than Manhattan. At 9.4%, Brooklyn's price-cut share is the lowest of any major borough — landlords are not negotiating. Bed-Stuy, Crown Heights, and Flatbush ($3,200–$3,590) offer the most accessible options. For 2-bedrooms: competition is up 171% vs. pre-pandemic — move decisively.
For Landlords: Firmly favorable. Despite Brooklyn absorbing ~60% of citywide new rental supply in 2025 (11,000+ units), rents still rose 6.8%. Demand is absorbing new supply as fast as it arrives — a strong indicator of underlying market strength.
Outlook: Two-speed appreciation continuing. Premium sub-markets (Carroll Gardens, Williamsburg, Fort Greene) are appreciating at rates rivaling Manhattan's best. Outer Brooklyn remains accessible but is closing the gap. Supply-constrained neighborhoods face continued upward pressure through 2026.
Data source:
-
Asking rent data: StreetEasy Master Report · Median Asking Rent, Rental Inventory, Discount Share · April 2026 · Full market (uncapped) · 10,920 active Brooklyn listings
-
Closed transaction data: OLR (On-Line Residential) export · Rented status · Last 30 days to May 7, 2026 · 500-listing platform cap · OLR mix skews toward premium neighborhoods
-
Note: StreetEasy median asking rent ($3,845) represents the full Brooklyn market. OLR closed median ($4,500) reflects the most recently updated 500 transactions and should be read as a premium-segment indicator.³
MORTGAGE REMARKS
RATES ELEVATED — BUT BROOKLYN BUYERS ARE MORE DIVERSE IN THEIR RATE SENSITIVITY
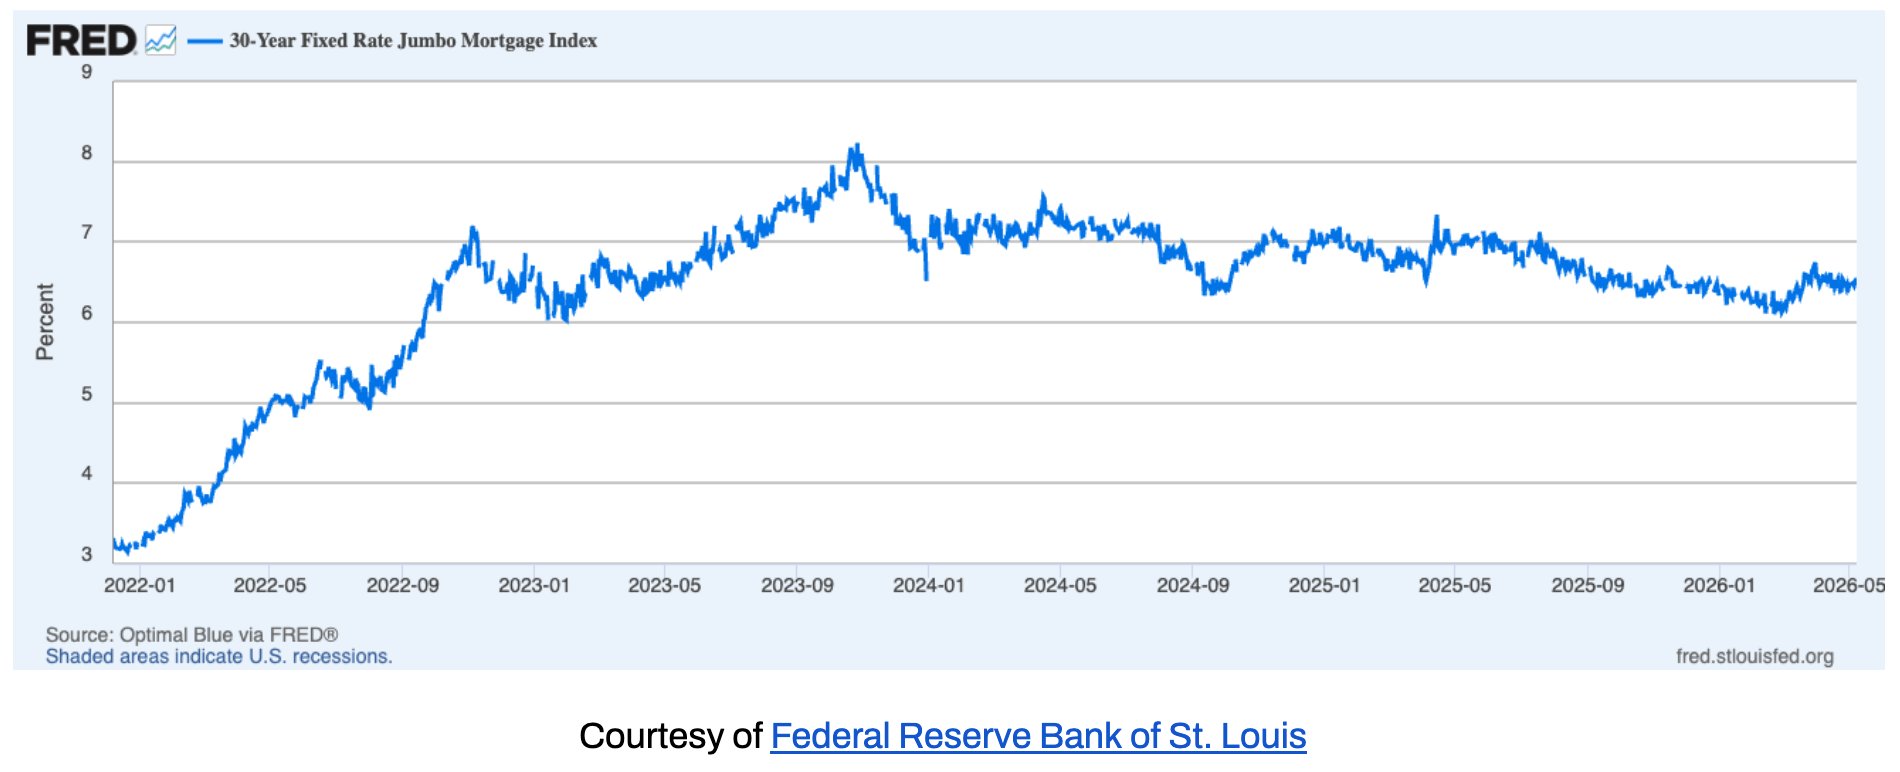
Average 30-year jumbo rates were hovering around 6.5%⁴ in early April, with effective APRs near 6.4%⁵ — roughly 40 basis points above the February low near 6.1%. The brief window of relative stability that had begun to reduce rate-shock hesitation has partially unwound. For buyers, the question is not whether rates will fall to 5% — it is whether waiting for that scenario means missing a spring window that currently offers more inventory and less competition than Brooklyn has seen since 2023.
Brooklyn's buyer pool spans a wider income and financing range than Manhattan's, which means rate sensitivity here is more varied. Buyers at the sub-$1M co-op level feel rate increases meaningfully; buyers at the $2M+ condo level tend to be more equity-financed and less dependent on rate movements. That bifurcation is visible in the data: the median sale price is holding at $1.02M while days on market are rising, suggesting that rate-sensitive buyers are pausing more than rate-insulated buyers.
Outlook: The rate path depends heavily on incoming inflation and labor data. A further move toward 7% is possible if inflation proves sticky; a drift back toward 6% is equally possible if the economy softens. In the absence of clarity, locking early on well-priced properties remains the prudent strategy — particularly in Brooklyn, where the inventory environment is more favorable to buyers today than it is likely to be in the fall.
INVESTOR INSIGHTS
INTERNATIONAL BUYERS
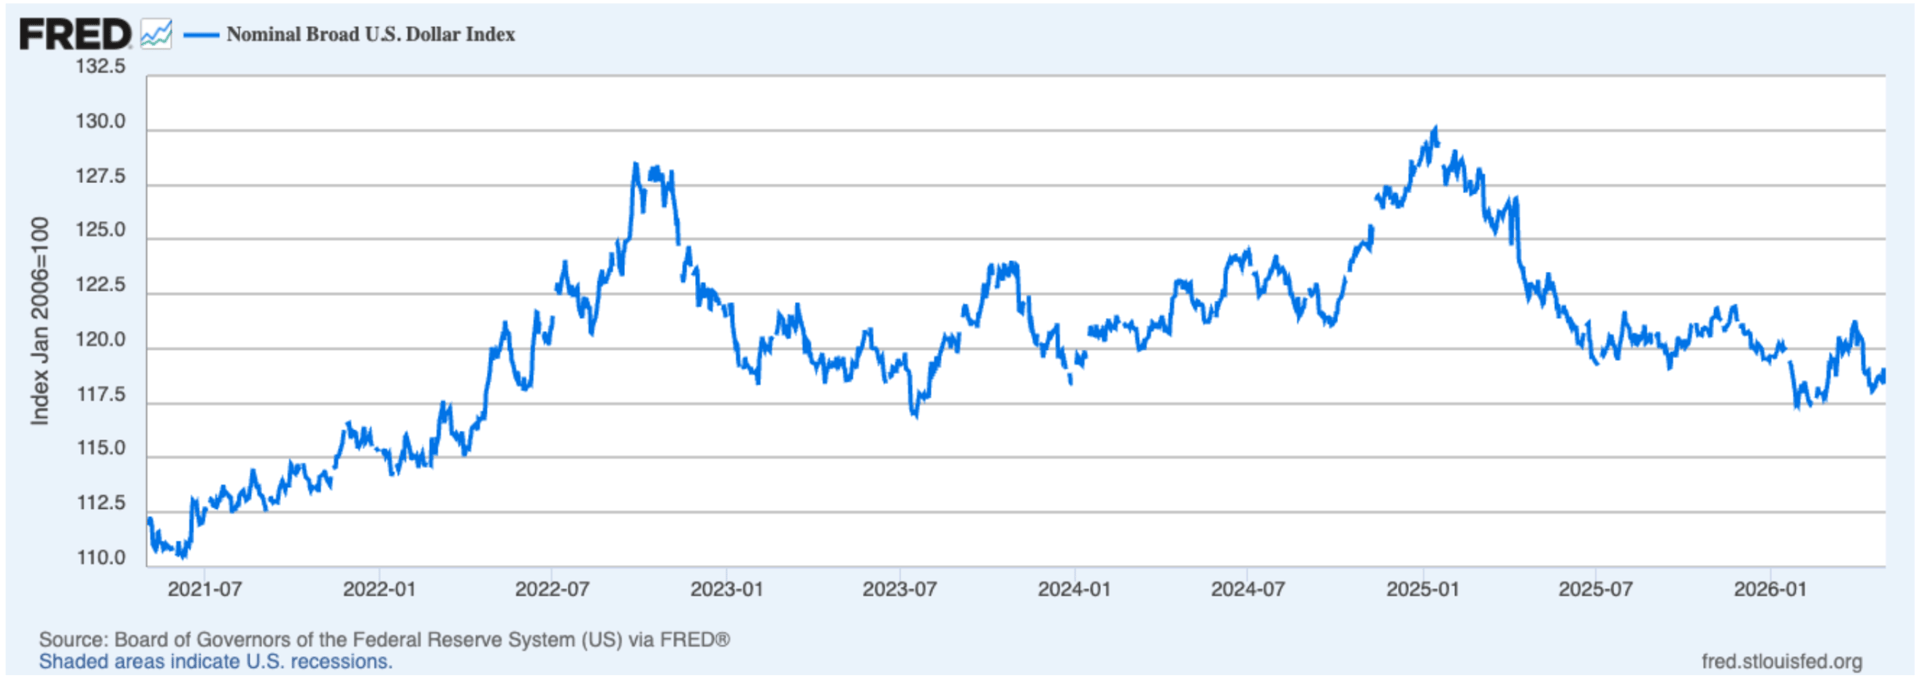
With the US dollar down 10–15% against major currencies over the past year, Brooklyn is effectively cheaper for European and international buyers without any change in asking prices. The FX tailwind is real and underused: a €1M budget buys meaningfully more Brooklyn square footage today than it did twelve months ago. Brooklyn's combination of value relative to Manhattan, strong rental demand, and appreciating PPSF (+6.1% YoY) makes it a compelling entry point for international capital that wants New York City exposure at a lower absolute price point.
DOMESTIC INVESTORS
The rent-versus-buy calculation is shifting in Brooklyn just as it is in Manhattan. At a $3,845 monthly median asking rent across the borough (StreetEasy, April 2026) — and with closed rents in premium sub-markets running at $4,500 — the carrying cost of owning a well-priced Brooklyn co-op is increasingly competitive for buyers with sufficient capital. Brooklyn also offers gross rental yields that are structurally higher than Manhattan's, given lower entry prices and sustained rental demand. For long-term renters in Carroll Gardens, Fort Greene, or Williamsburg who have built savings over three years of rising rents, the buy conversation is worth having now.
THE BROOKLYN PPSF STORY
After steadily appreciating from a post-financial-crisis trough toward $700 per square foot in the mid-2010s, Brooklyn's median PPSF has established itself in the $900–$1,100 range over the past several years — currently at $1,027, reflecting a strong April transaction mix. Unlike Manhattan, where PPSF has traded in a notably tight band for over a decade, Brooklyn's PPSF has a more active appreciation trajectory, driven by the ongoing re-rating of the borough as a premium residential destination in its own right rather than a Manhattan alternative.
The +6.1% year-over-year gain in April PPSF confirms that trajectory is intact. Brooklyn is not a market to buy expecting Manhattan-like price stability; it is a market where patient capital and quality assets have delivered consistent appreciation, and where the supply dynamics — rising inventory notwithstanding — do not support a material pricing correction from current levels.
For investors, the combination of a rising PPSF floor, strong rental demand across the borough, and continued development activity concentrated in specific sub-markets (Downtown Brooklyn, Williamsburg) rather than spread borough-wide means that asset selection matters as much as borough selection. The best assets in the best locations continue to trade above ask; the rest negotiates.
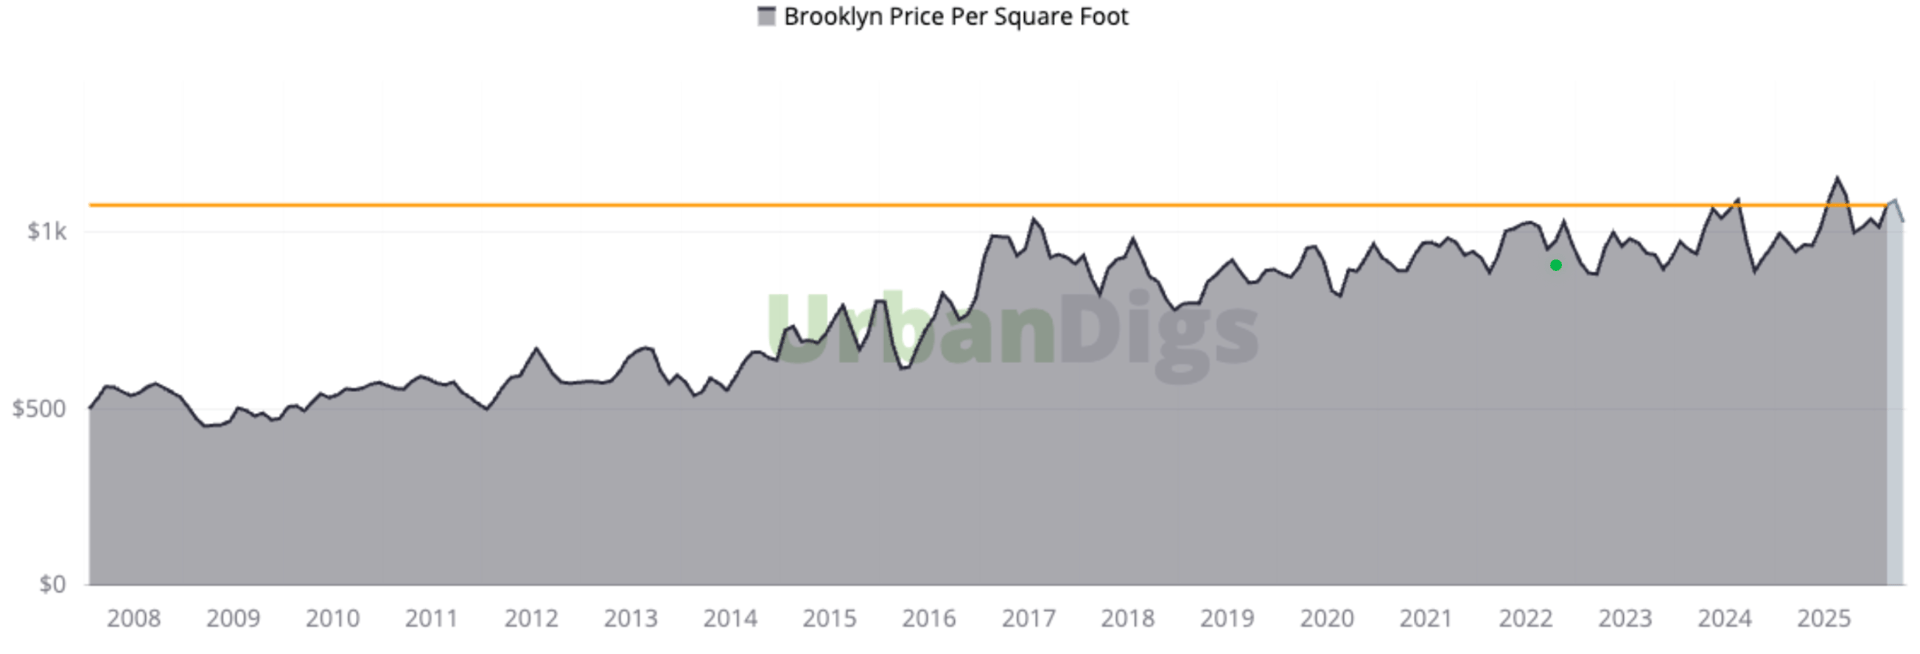
Chart courtesy of UrbanDigs and indicates Brooklyn median PPSF as a function of the closed sale date.
The light grey area to the extreme right indicates incomplete data, and the orange line indicates the most recent median PPSF based on data considered complete.
References
1. Data courtesy of UrbanDigs
2. According to the Howard Hanna NYC Brooklyn Leverage Index
3. Data courtesy of OLR (On-Line Residential) and StreetEasy · February 2026 NYC Market Report
4. Data courtesy of Federal Reserve Bank of St. Louis
5. JUMBO mortgage rate APR data courtesy of Bank of America, Chase, and Wells Fargo
6. Cover Photo by Rihards Gederts.
If you would like to chat about the most recent market activity,
feel free to contact us at [email protected] or connect with one of our Advisors.
Howard Hanna NYC brings the nation’s largest independent and family-owned brokerage to New York City, uniting the strength of a national network with the insight and sophistication of a local firm. Formed through joining forces with Elegran Real Estate, Howard Hanna NYC delivers a seamless, full-service experience backed by more than 15,000 agents across 500 offices in 14 states. The firm’s forward-thinking, agent-first culture continues to shape the future of real estate across Manhattan and the Tri-State area.Learn more at www.howardhannanyc.com.