SPRING HOLDS ITS GROUND
Manhattan's spring market deepened in April without tipping into frenzy. The Howard Hanna NYC Manhattan Leverage Index moved modestly higher and remains in seller-leaning territory, carried by demand that flipped positive year-over-year, prices at decade-range highs, and inventory that — despite seasonal gains — remains well below 2025 levels. This is a market where preparation wins more decisively than timing.
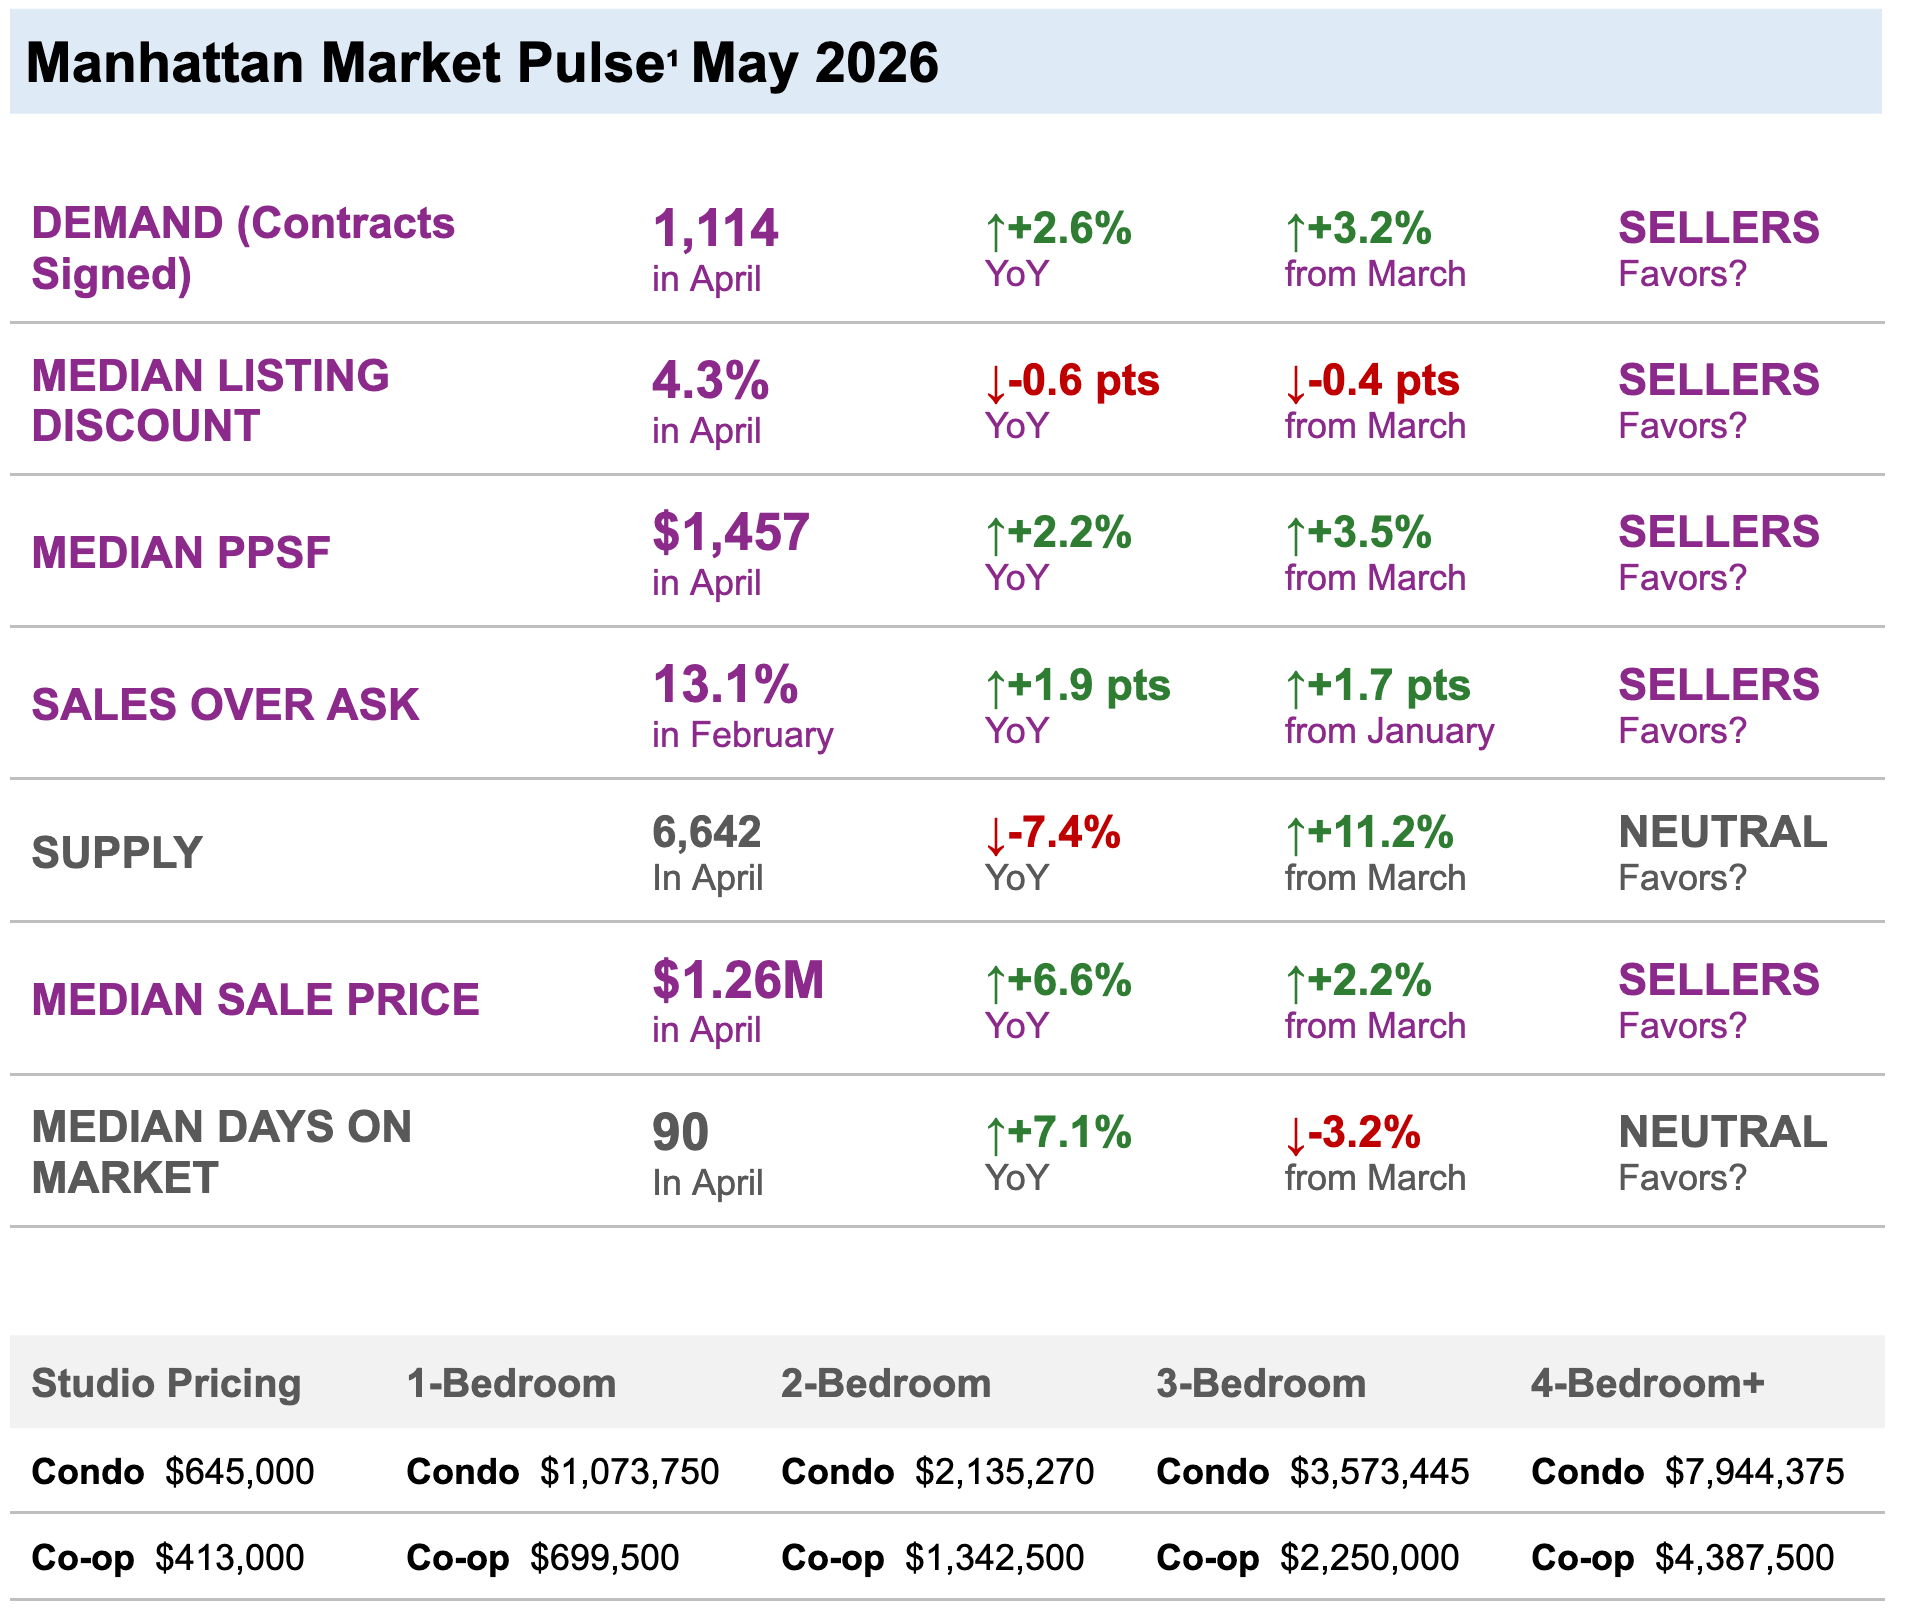
MARKET SNAPSHOT: FIVE NUMBERS THAT MATTER
-
1,114 contracts signed in April — up 3.2% from March and now +2.6% year-over-year, reversing the prior month's slight YoY dip. Spring momentum is sustained.
-
6,642 active listings — up 11.2% from March, but still 7.4% below this time last year. More choice than a month ago; structurally tight relative to demand.
-
$1.26M median sale price — up 6.6% year-over-year and 2.2% from March. Appreciation is broad-based and holding.
-
$1,457 median price per square foot — up 3.5% from March and 2.2% year-over-year. Back at the high end of its decade-long range.
-
4.3% median listing discount — down 0.6 pts year-over-year and 0.4 pts from March. Negotiating room is compressing, not expanding.
KEY TAKEAWAYS
-
Demand flipped +2.6% YoY at 1,114 contracts — the market is tracking ahead of last spring, not behind it.
-
Supply rose 11.2% from March but remains 7.4% below April 2025 — the structural gap is intact.
-
Median sale price at $1.26M is up 6.6% YoY, the strongest YoY gain since late 2021.
-
Median PPSF at $1,457 has broken back into the upper end of its decade range, ending the mix-shift drag from prior months.
-
Listing discounts compressed to 4.3% — near multi-year lows. The era of 6–8% negotiating room has not returned.
-
13.1% of sales are closing above asking price, confirming competition for well-priced listings is active and real.
-
Jumbo rates at ~6.5% add urgency for rate-sensitive buyers; Manhattan's equity-heavy buyer profile limits but does not eliminate rate sensitivity.
OUTLOOK
April confirmed what March signaled: 2026 is a steady, seller-leaning spring. Well-priced listings are clearing efficiently. Buyers with financing in place are finding selective opportunities, particularly in co-ops and condos below $2M. Days on market at 90 — up 7.1% YoY — remains the one metric worth watching: it suggests absorption is not fully keeping pace with new supply at the margin. If that number continues rising into May, it will be an early signal of softening before prices reflect it.
For sellers: the window is open and favorable. Accurate pricing from day one outperforms ambition every time in this market.
For buyers: waiting for meaningfully better conditions means competing against a stronger spring market later. Act with conviction on the right asset.

Photo by Rihards Gederts | Howard Hanna NYC
Howard Hanna NYC Manhattan Leverage Index
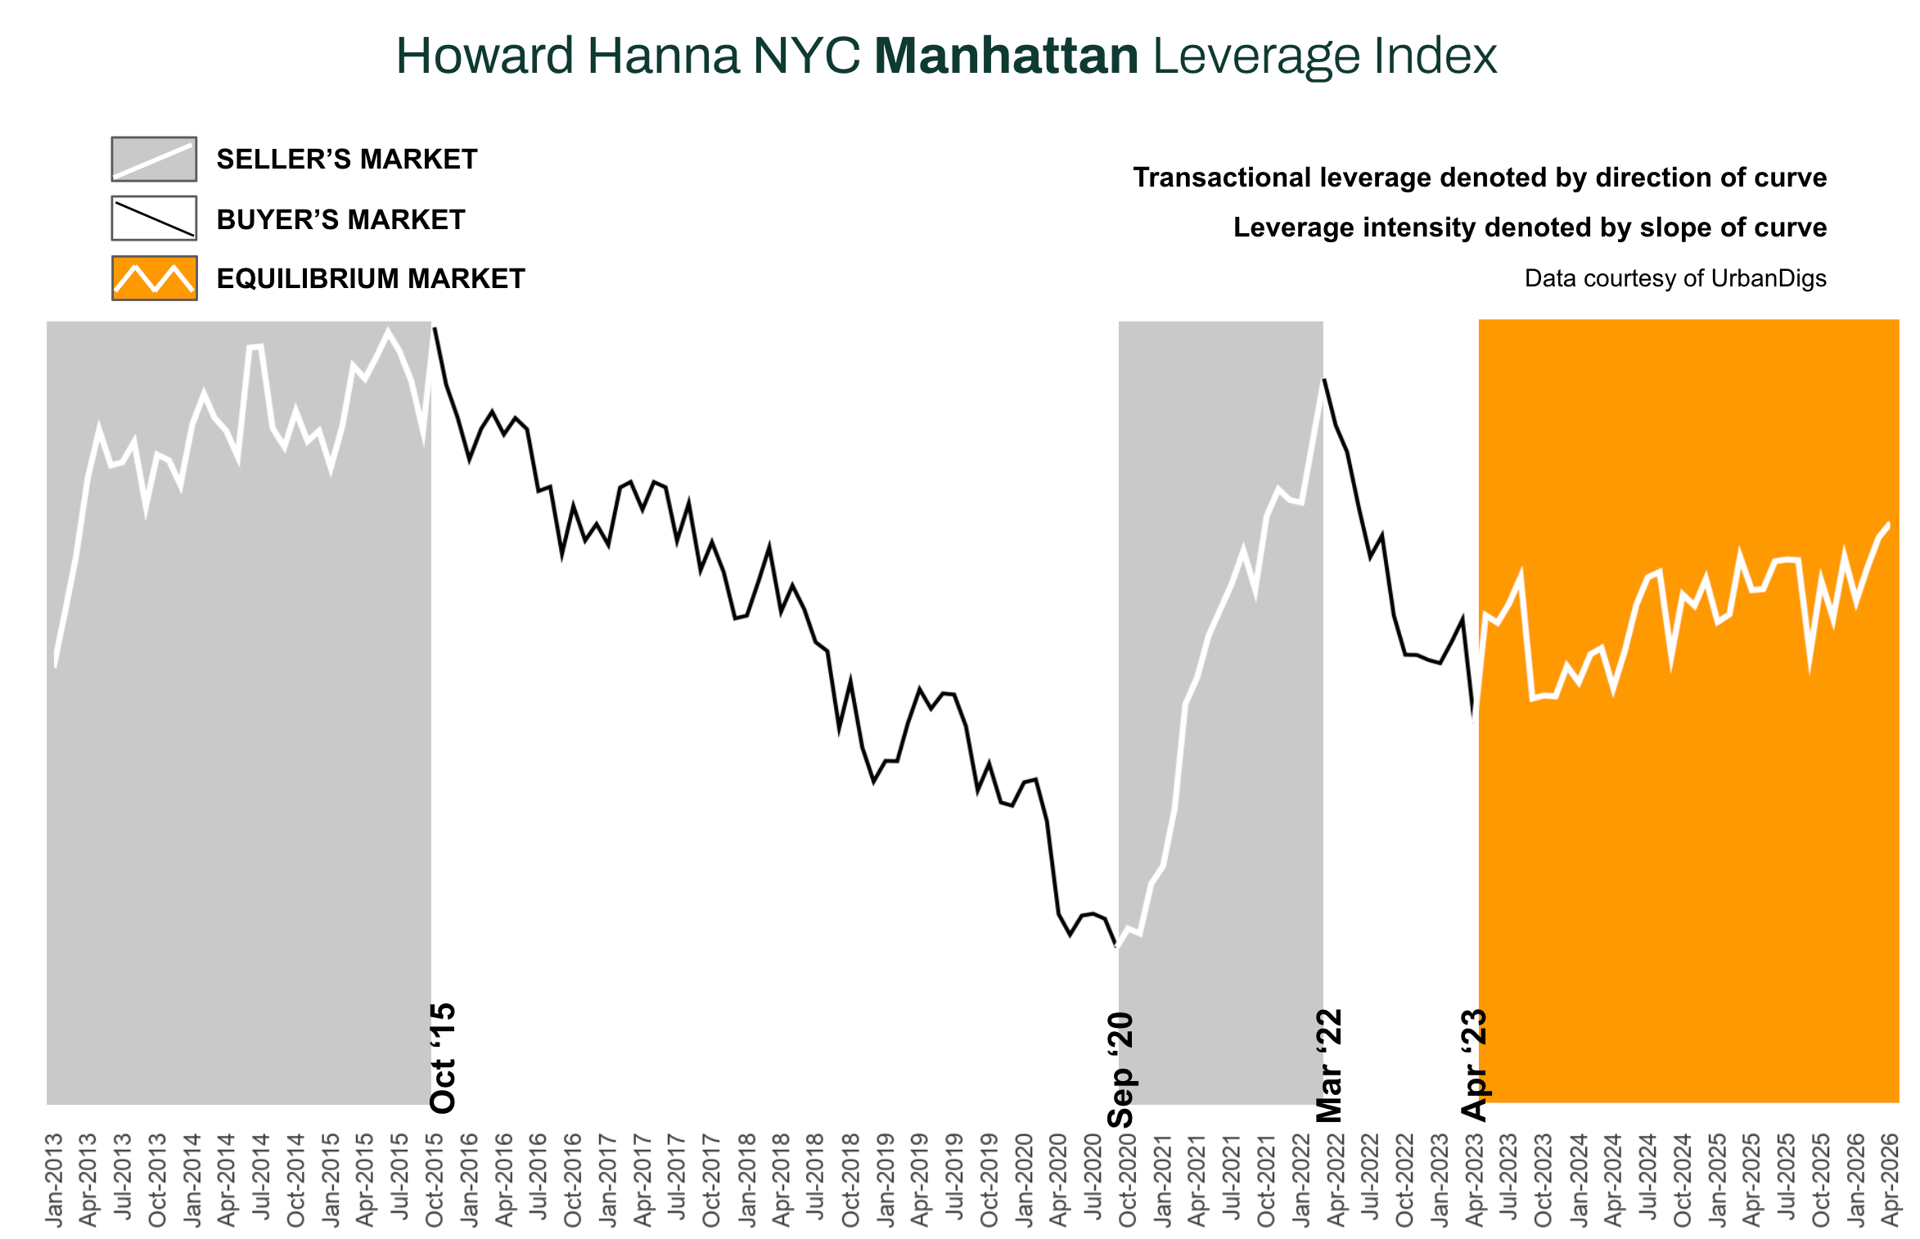
The Howard Hanna NYC Manhattan Leverage Index² blends four key market signals – supply, demand, median PPSF, and median listing discount – to gauge the balance of power between buyers and sellers in Manhattan. It’s a proprietary index that distills these metrics into one indicator of market leverage. Direction Matters:
-
An upward-sloping curve = seller’s market
-
A downward-sloping curve = buyer’s market
The steeper the slope, the stronger the advantage for either side
In April 2026, the index moved modestly higher and remains in seller-leaning territory. Demand registered its first positive YoY reading since January, the listing discount compressed further, and PPSF broke back into the upper end of its decade range. Supply rose seasonally but the YoY deficit widened — keeping the structural tilt firmly toward sellers.
From a historical perspective, this pattern resembles mid-cycle normalization periods such as 2013–2015, when modest rate increases co-existed with steady price appreciation and no broad correction. What distinguishes this cycle is structural undersupply: Manhattan inventory remains well below 2017–2019 averages, limiting the probability of distress-driven repricing.
Manhattan Supply
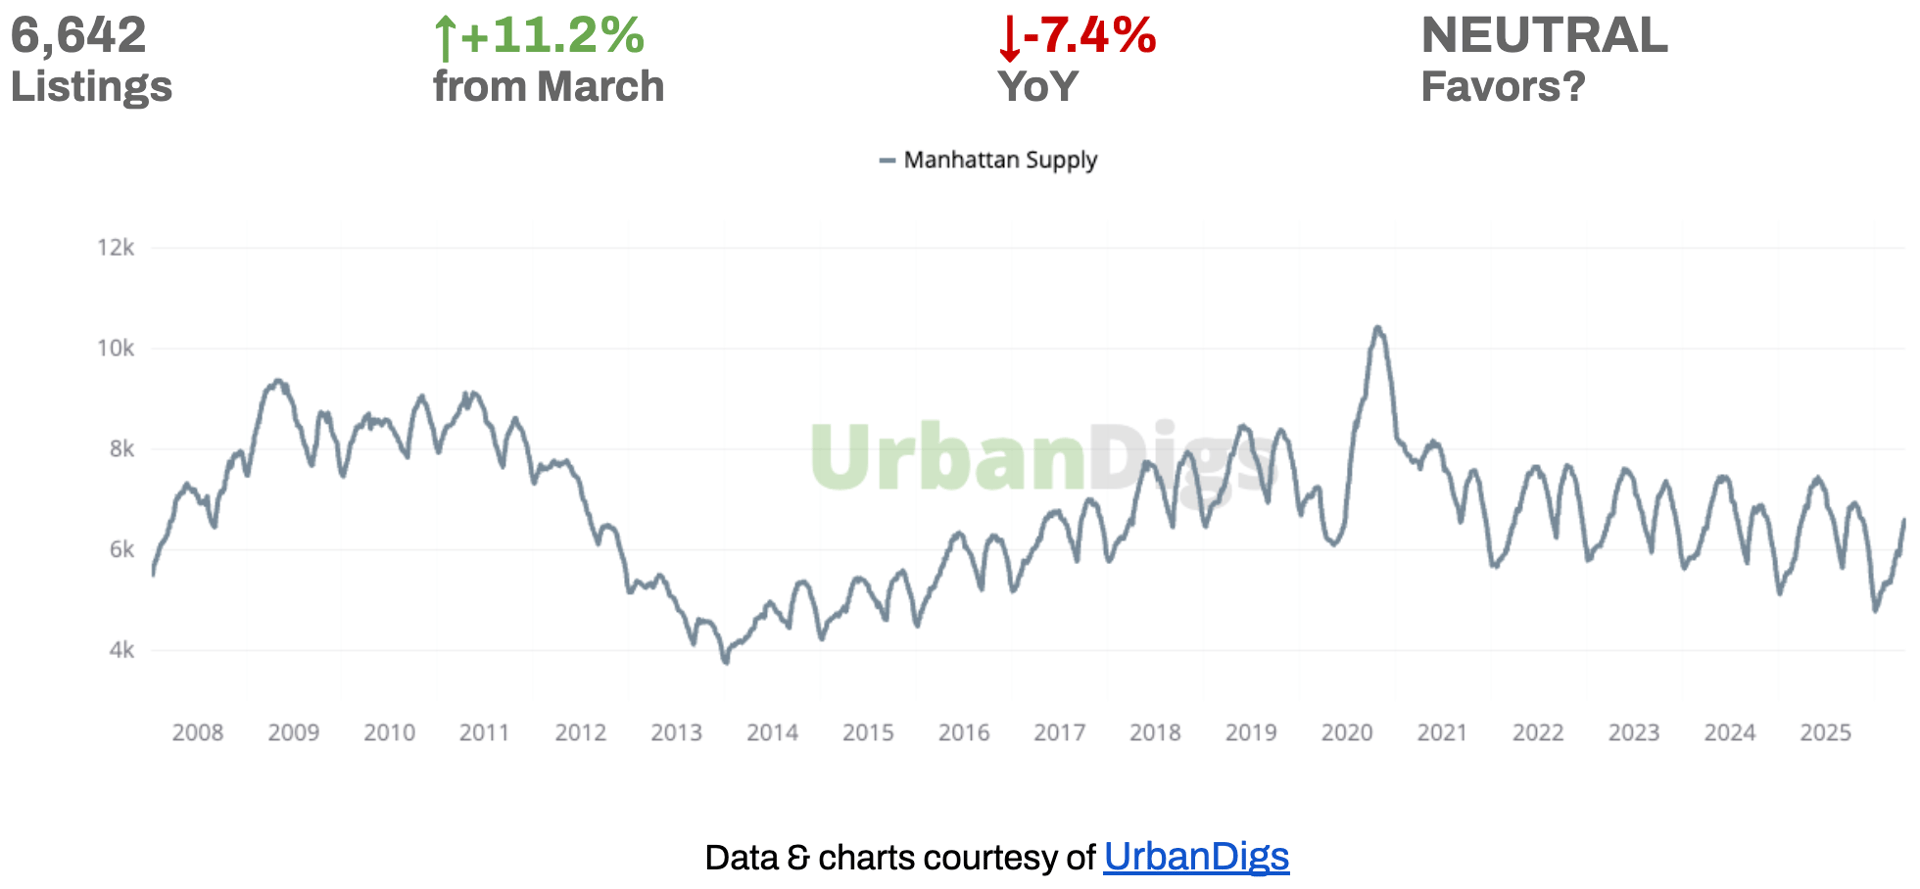
Active listings rose +11.2% from March to 6,642 in April, the second straight monthly gain as more sellers list into the spring window. The year-over-year picture, however, still favors sellers: supply is 7.4% below where it was at this time in 2025. Buyers have more to choose from than a month ago, but the absolute pool remains tight relative to demand — and demand itself is up +2.6% YoY at 1,114 contracts signed.
🟦 Buyers: Selection is the best it has been in months and continues to improve, but inventory is still meaningfully below 2025 levels. With sale prices up 6.6% YoY and the listing discount tightening to 4.3%, holding out for materially better terms means competing against a stronger market in late spring.
🟪 Sellers: The structural supply gap and firming pricing power continue to work in your favor — median PPSF is up 3.5% from March and 2.2% YoY. Pricing accurately from day one still wins; the market rewards precision over ambition, with median listing discounts narrowing to 4.3%.
Outlook: Inventory should keep building through Q2 as the seasonal listing wave continues, but with demand still rising YoY and the YoY supply deficit intact, a meaningful shift toward buyer-favoring conditions is unlikely without a macro disruption. Watch days-on-market — at 90 it is up 7.1% YoY, the one early signal that absorption is not keeping full pace with new supply.
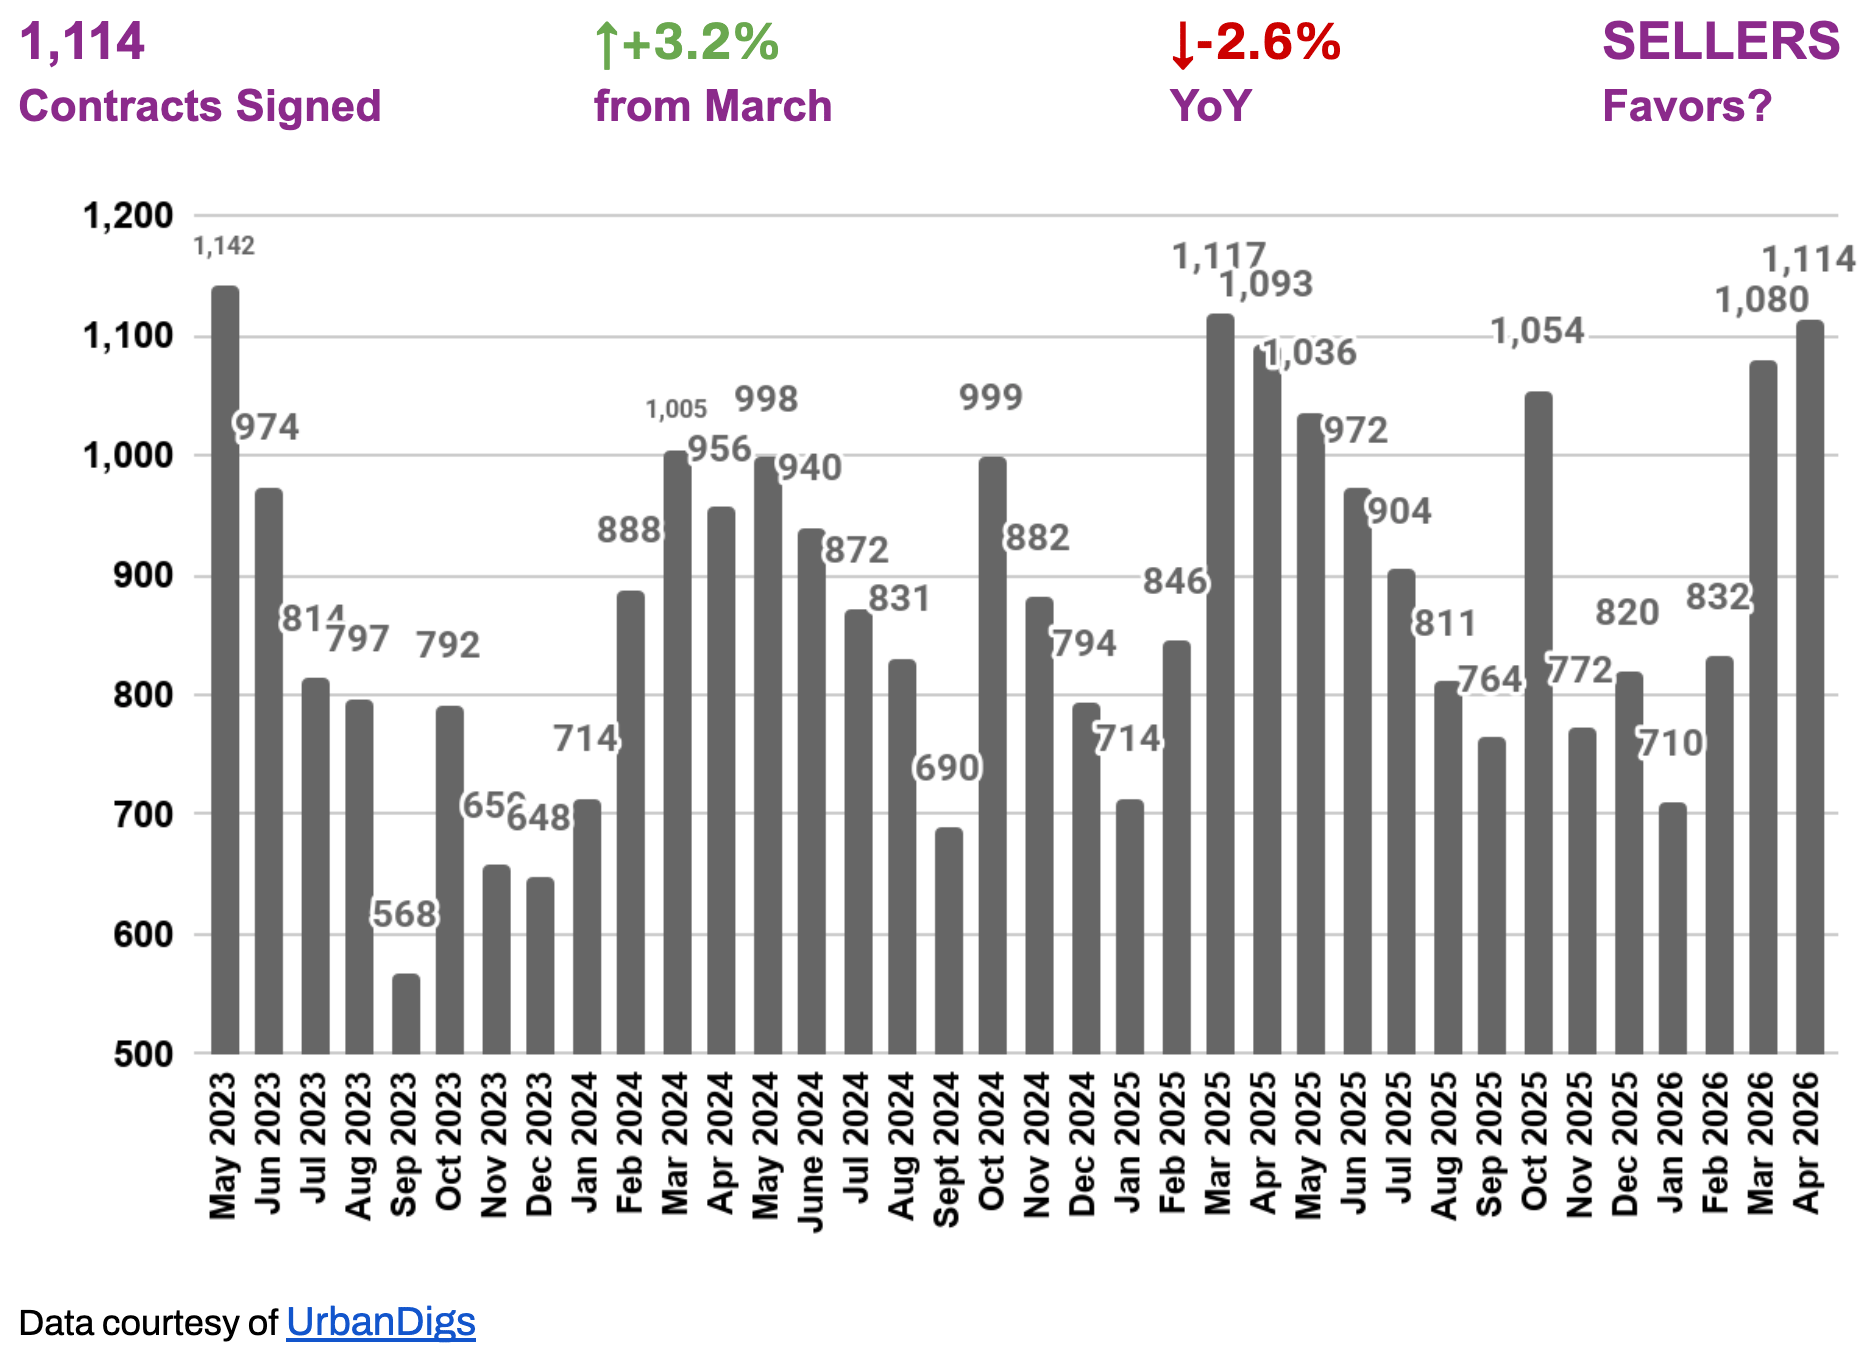
Manhattan Demand
SPRING MOMENTUM HOLDS — DEMAND NOW POSITIVE YOY
April brought 1,114 signed contracts — up 3.2% from March and now +2.6% YoY, flipping the prior month's slight YoY dip into a clear gain. The spring rebound that began in March has carried through, with activity tracking comfortably above the same period in 2025.
🟦 Buyers: Competition is firming, not easing. Two consecutive months of MoM growth confirm the spring window is fully open — waiting carries a real cost.
🟪 Sellers: YoY positive demand alongside tightening listing discounts (4.3%) gives realistic pricing strong reach. Properly positioned listings continue to clear.
Outlook: Expect activity to hold near these levels through May as seasonal supply meets sustained buyer interest. The pattern points to a steady, broad-based spring rather than a peak.
Manhattan Median PPSF
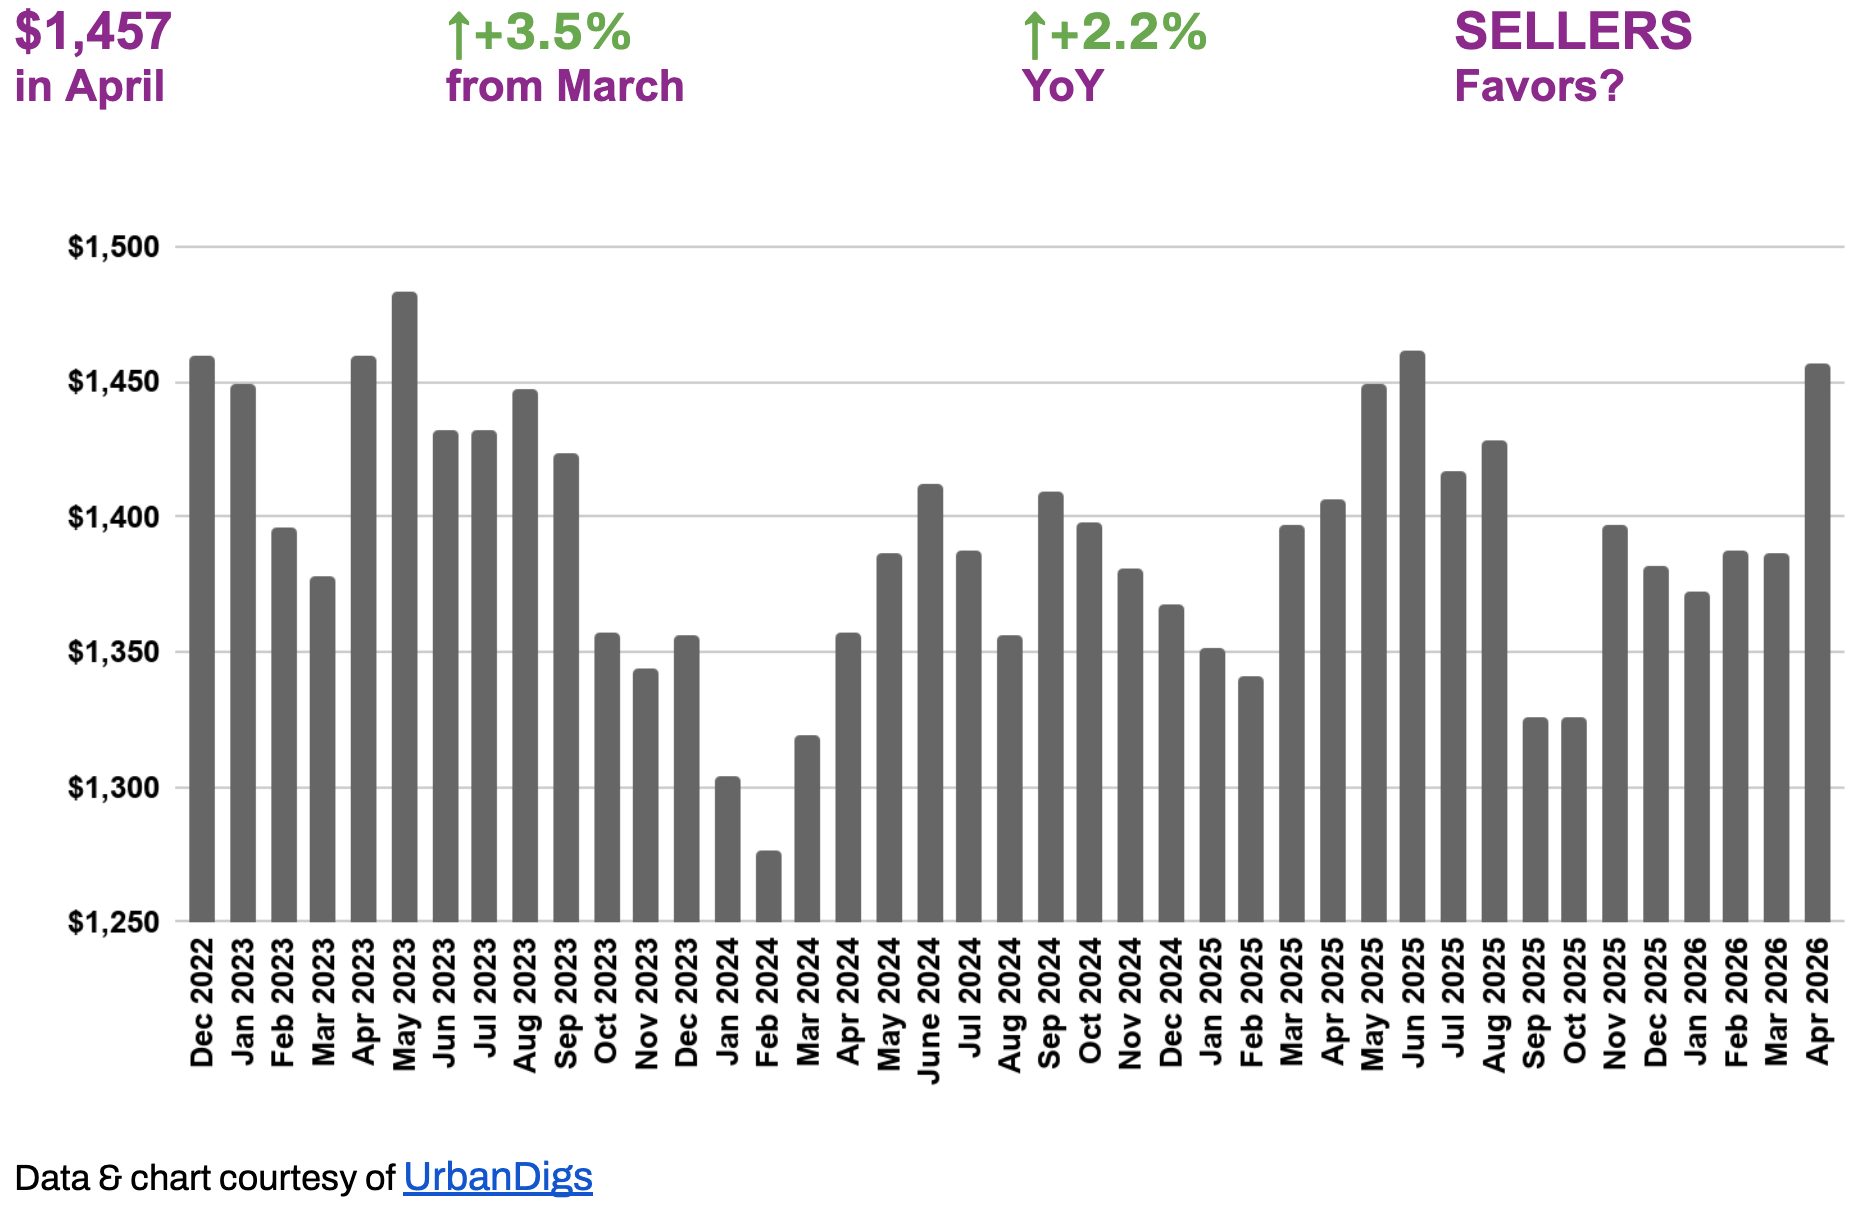
PPSF FIRMS BACK INTO THE $1,400+ RANGE
Median price per square foot registered $1,457 in April, up +3.5% from March and now +2.2% year-over-year. The mix-shift drag that pulled March's reading slightly negative has reversed, and PPSF is back in the upper end of its decade-long range — exactly where last month's outlook said it was likely heading.
The structural takeaway hasn't changed: Manhattan's median PPSF has held in a remarkably tight band for over a decade, a testament to the market's structural price stability and its resistance to the boom-bust volatility seen in other U.S. metros. April's reading reinforces that the floor is real — and that buyers waiting for broad price compression are likely to be disappointed.
🟦 Buyers: With PPSF firming and listing discounts tightening to 4.3%, negotiating leverage is narrowing. Value remains asset-specific — co-ops continue to offer meaningful PPSF advantages over comparable condos.
🟪 Sellers: The pricing floor has firmed further. Market-aligned listings are achieving strong outcomes; properties with premium finishes, light, and desirable layouts continue to trade at or above ask.
Outlook: With PPSF now positive on both axes and demand up +2.6% YoY, conditions favor continued firmness through Q2. A move toward $1,470–$1,480 is plausible if the spring contract pace holds and luxury volume contributes meaningfully.
Manhattan Median Listing Discount
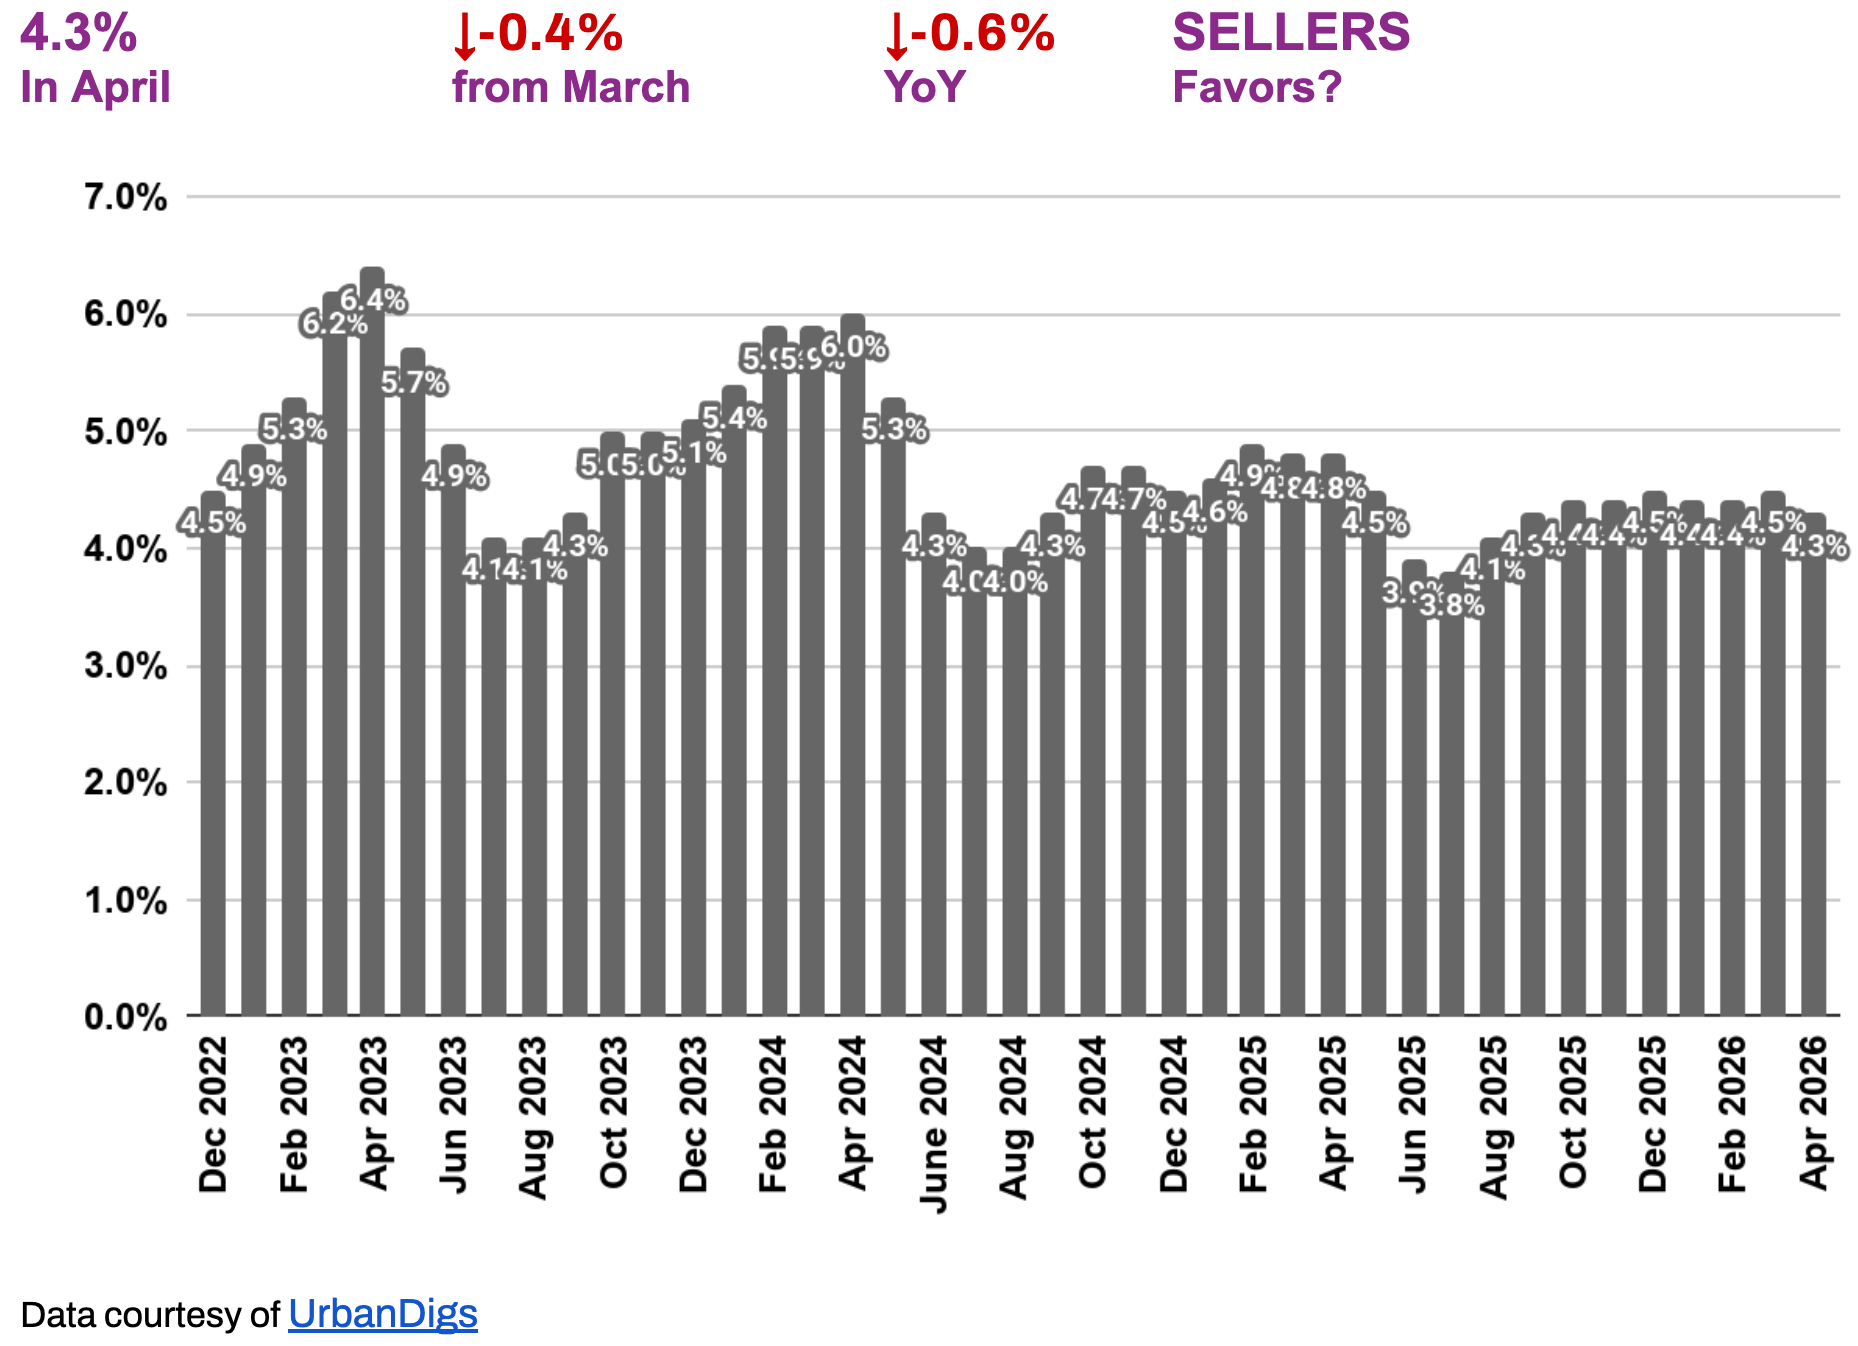
DISCOUNTS COMPRESS FURTHER AS SPRING DEMAND BUILDS
The median listing discount tightened to 4.3% in April — down 0.4% from March and 0.6% lower year-over-year. Negotiation margins have moved from "near multi-year lows" to actively compressing further, confirming what the prior month's outlook anticipated: spring demand is reducing buyer leverage, not expanding it.
In practical terms, buyers should expect even less room to negotiate than a month ago. The era of 8–10% listing discounts that defined the early post-pandemic correction has not returned, and April's tightening makes its near-term return even less likely. Well-structured offers — not aggressive low-balls — remain the path that closes deals.
🟦 Buyers: The window for meaningful concessions is narrowing. Competitive offers with clean financing remain the most effective path; anchoring to a 6–8% discount expectation will leave properties to better-positioned bidders.
🟪 Sellers: Pricing power has firmed further. Realistic pricing from day one continues to win — properties priced accurately are clearing close to ask, with 13.1% of recent sales closing above ask.
Outlook: With demand up +2.6% YoY and supply still 7.4% below last year, listing discounts could compress modestly further into May. A move into the high 3% range is plausible if the spring contract pace holds; meaningful expansion would require a clear shift in rates or buyer confidence — neither visible in current data.
RENTAL REMARKS
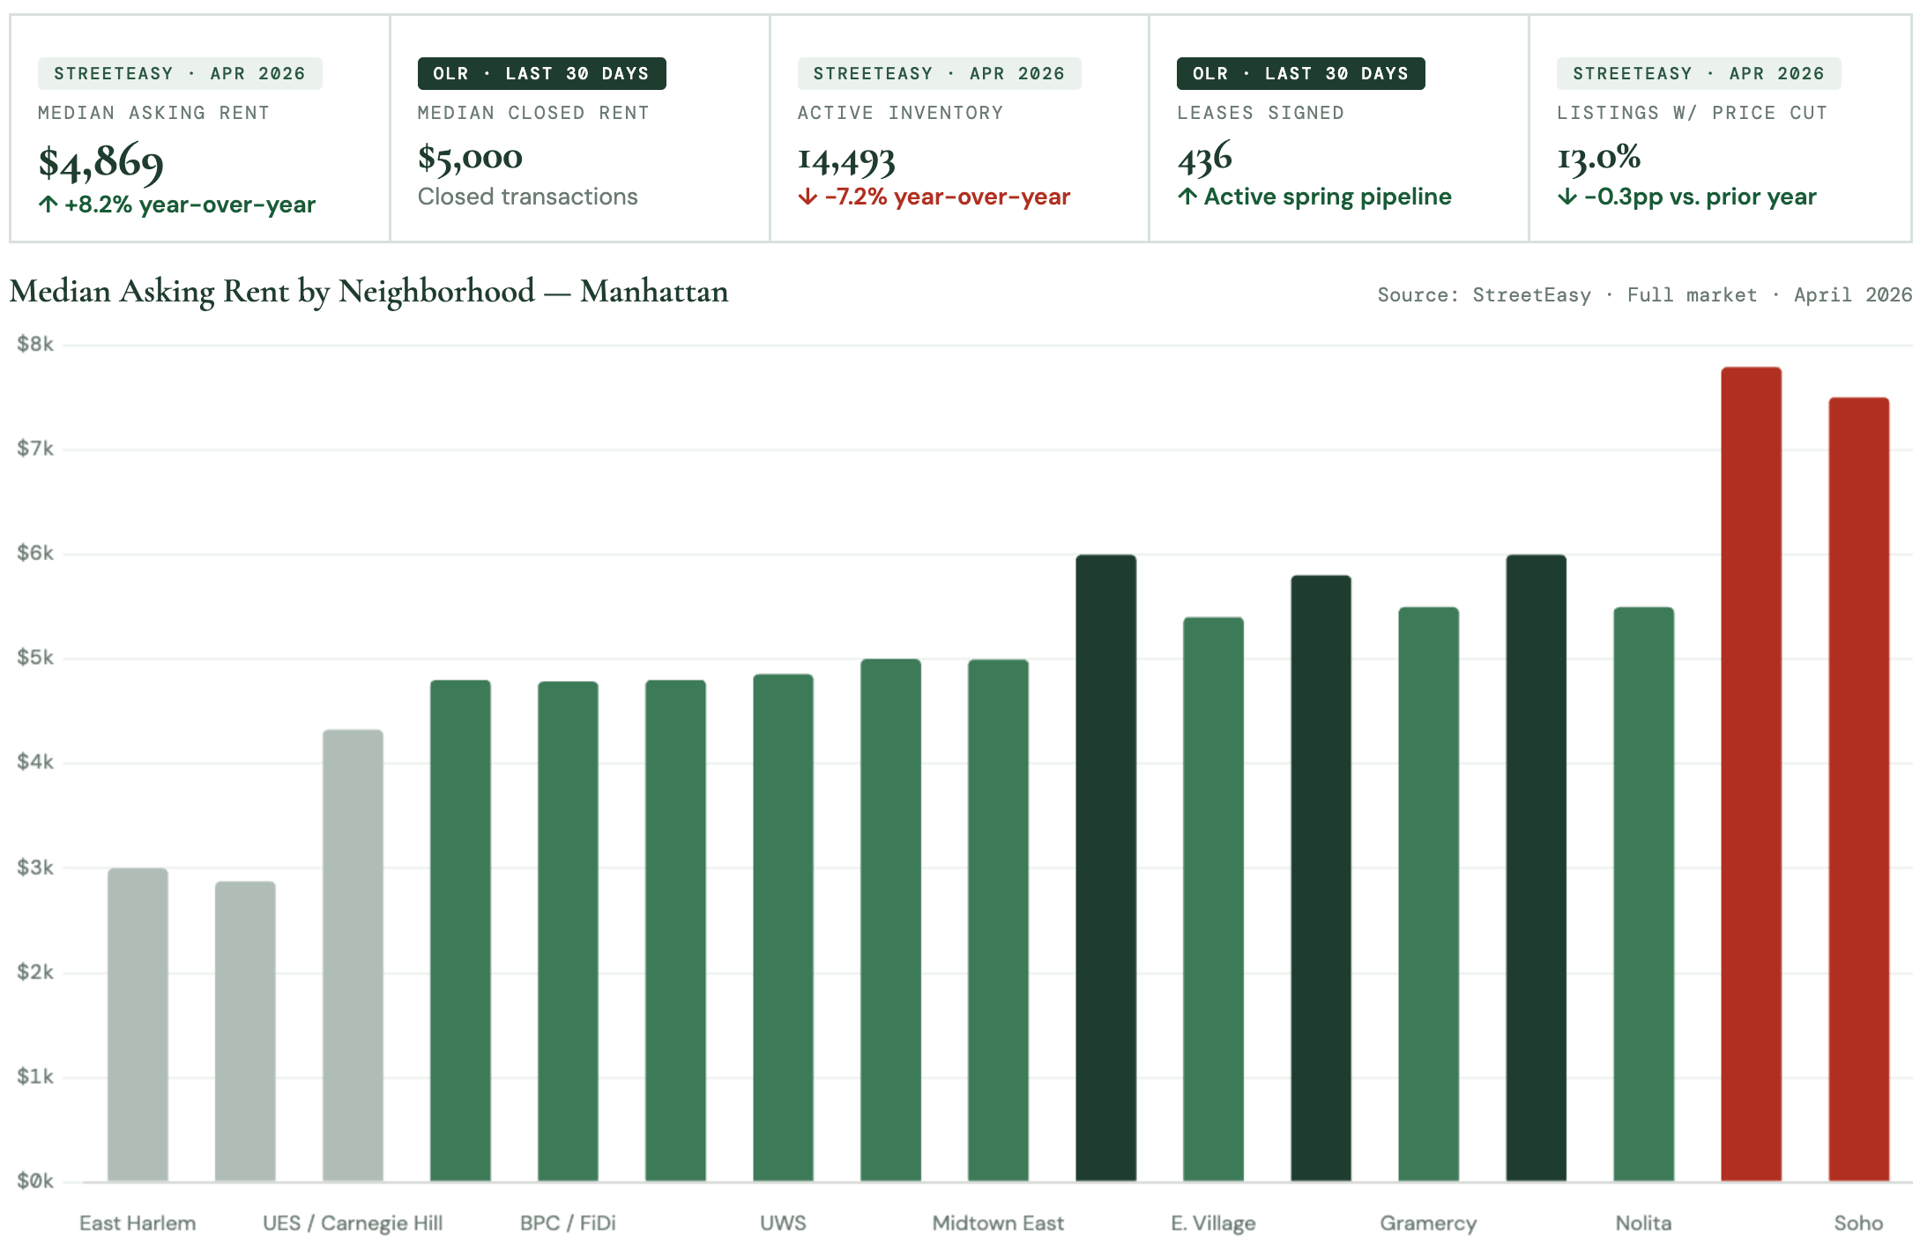
Manhattan's median asking rent reached $4,869 in April — up 8.2% year-over-year, the thirteenth consecutive month of annual increases. Closed rents (OLR) are running at $5,000, above the asking median: the market is transacting above ask. Active inventory fell 7.2% year-over-year to 14,493 units, sustaining the supply constraint that has defined the market since mid-2023. Tribeca ($7,790) and Soho ($7,500) lead on price; Hell's Kitchen leads on volume (26% of all closed deals) at an accessible $4,638.
Upper East Side ($4,325) offers the borough's best value-to-address ratio — with active asking at a premium, there is genuine negotiating room.
-
For Renters: Challenging conditions. Inventory is down 7.2% and only 13% of listings are cutting price — near a multi-year low. Move quickly on well-priced units. Upper East Side is the one area where active asking exceeds recent closed comps, offering genuine negotiating room.
-
For Landlords: Strongly favorable. Closed rents are exceeding asking prices — demand is outpacing supply. With only ~14% of citywide new supply entering Manhattan, no meaningful inventory relief is expected through mid-2026.
-
Outlook: Landlord-favored through summer 2026. The StreetEasy Rental Price Index is up 6.5% YoY with no sign of deceleration. Key risk: any meaningful mortgage rate relief could release pent-up buying demand, reducing renter competition. Absent that, rents remain firm through at least Q3 2026.
Data source:
-
Asking rent data: StreetEasy Master Report · Median Asking Rent, Rental Inventory, Discount Share · April 2026 · Full market (uncapped) · 14,493 active Manhattan listings
-
Closed transaction data: OLR (On-Line Residential) export · Rented status · Last 30 days to May 7, 2026 · 500-listing platform cap · Median closed rent = primary transactional metric
-
Note: StreetEasy and OLR measure different stages of the rental process (asking vs. closed) and should not be directly compared on a single chart axis.³
MORTGAGE REMARKS
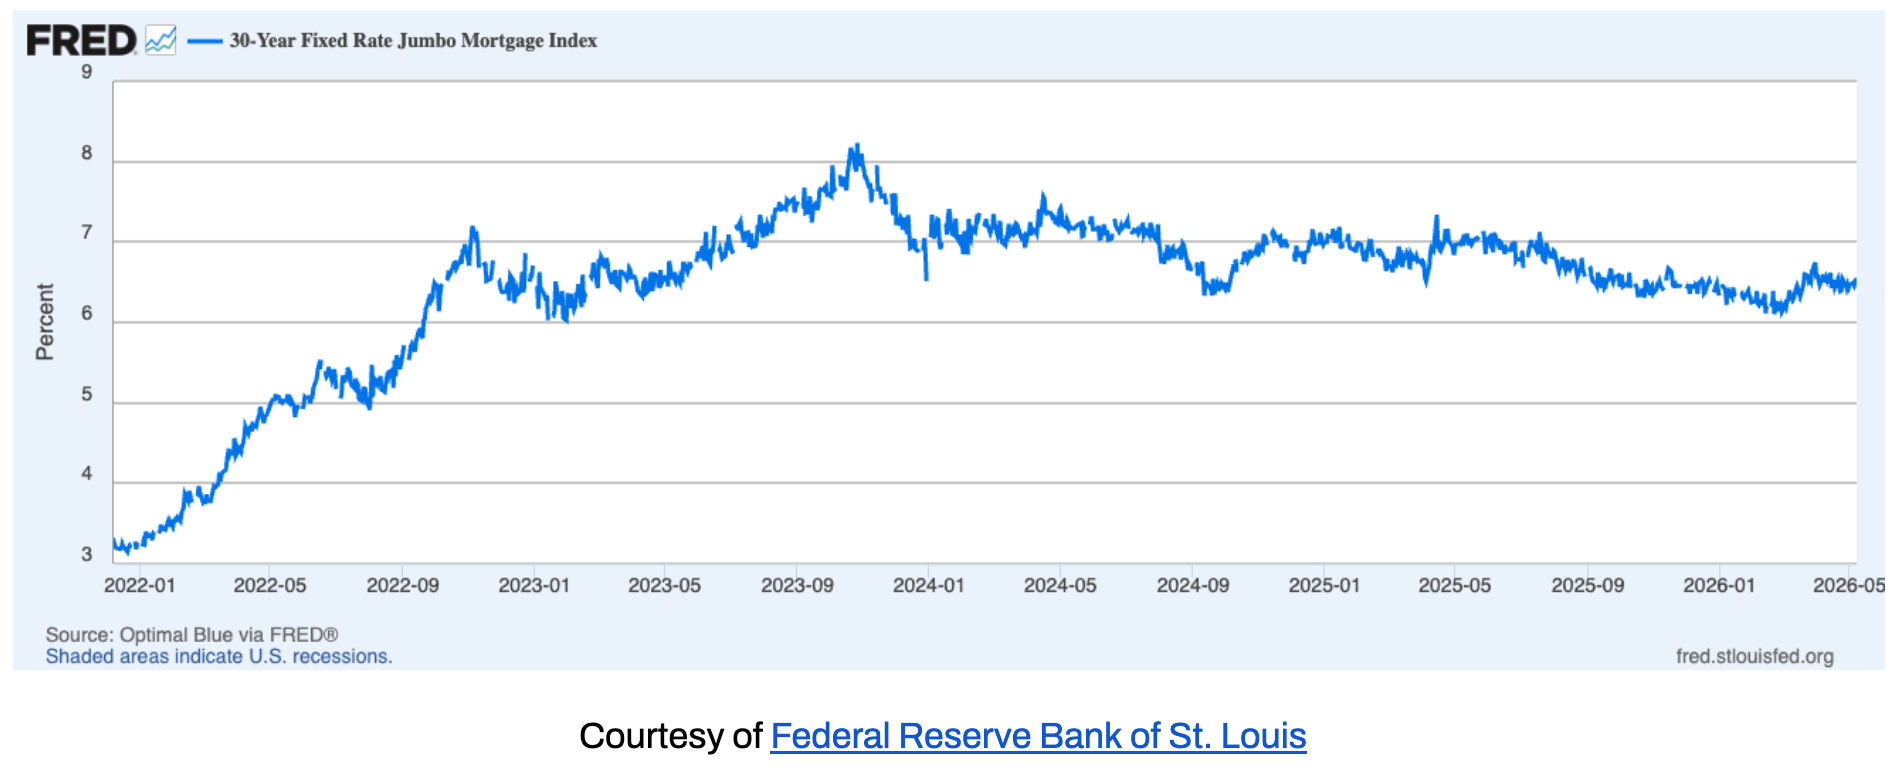
RATES ELEVATED — BUT MANHATTAN BUYERS ARE MORE INSULATED THAN MOST
Average 30-year jumbo rates were hovering around 6.5%⁴ in early April, with effective APRs near 6.4% — roughly 40 basis points above the February low near 6.1%⁵. The brief window of relative stability that had begun to reduce rate-shock hesitation has partially unwound. For buyers, the question is not whether rates will fall to 5% — it is whether waiting for that scenario means missing a spring window that may offer better inventory and less competition than the fall cycle.
Manhattan buyers tend to be more equity-financed and less rate-dependent than the median U.S. homebuyer. This insulates the upper market from rate volatility. At current levels, rates are a friction cost, not a deal-breaker, for buyers operating at Manhattan price points with significant cash contributions.
Outlook: The rate path depends heavily on incoming inflation and labor data. A further move toward 7% is possible if inflation proves sticky; a drift back toward 6% is equally possible if the economy softens. In the absence of clarity, locking early on well-priced properties remains the prudent strategy rather than holding out for a rate environment that may not arrive on schedule.
INVESTOR INSIGHTS
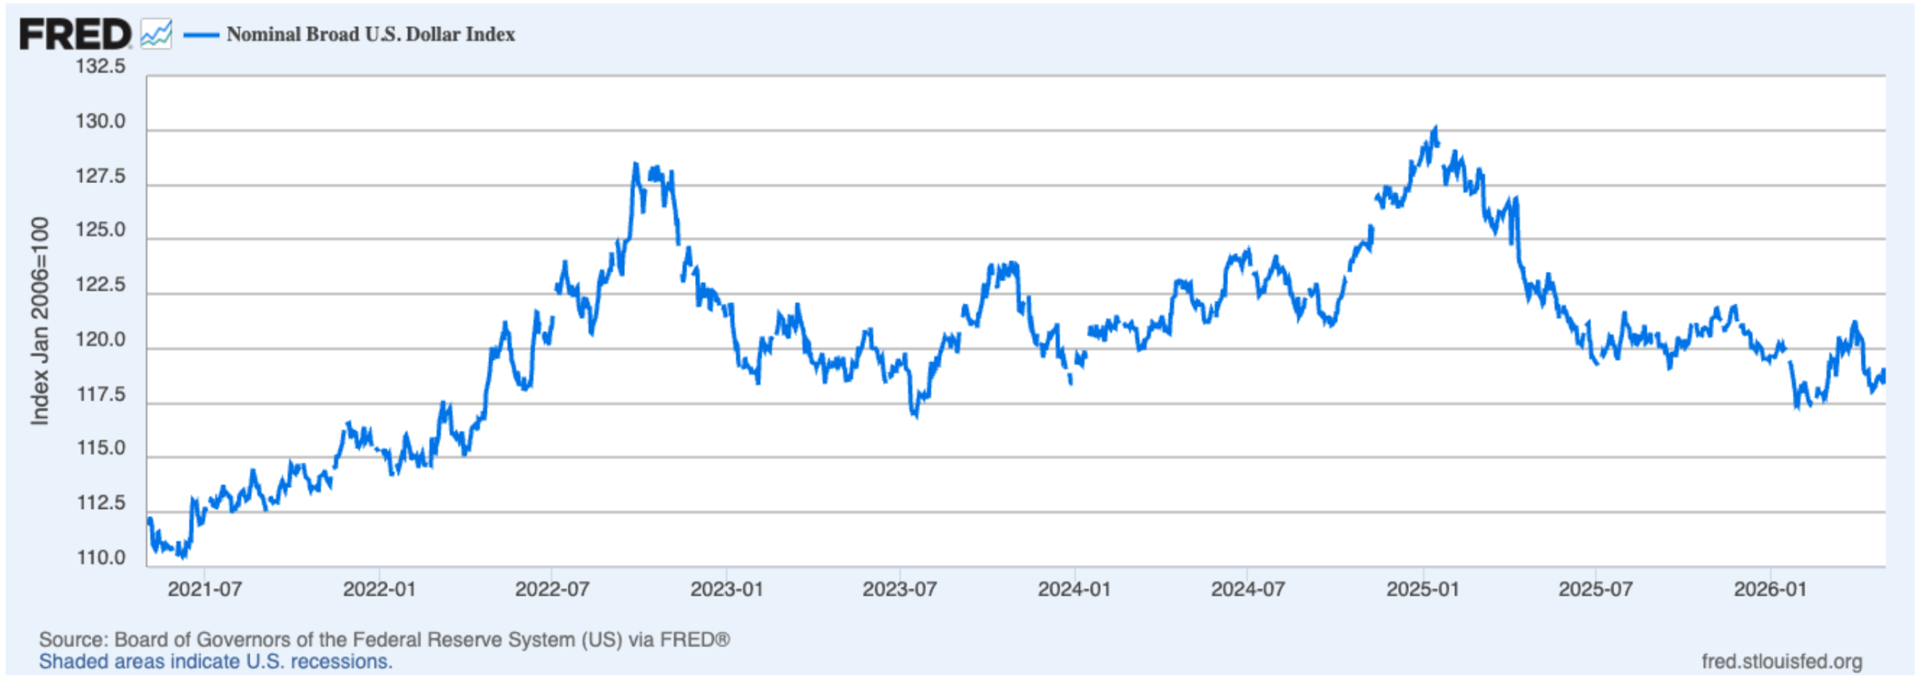
With the US dollar down 10–15% against major currencies over the past year, Manhattan is effectively cheaper for European and Gulf buyers without any change in asking prices. The FX tailwind is real, quantifiable, and underused in listing conversations with international clients. A €1M budget buys meaningfully more Manhattan square footage today than it did twelve months ago.
DOMESTIC INVESTORS
The rent-versus-buy calculation continues shifting. At a $4,869 monthly median asking rent in Manhattan, the carrying cost of owning a well-priced co-op is increasingly competitive for buyers with sufficient capital. For long-term renters who have built savings over three years of rising rents, the conversation is worth having.
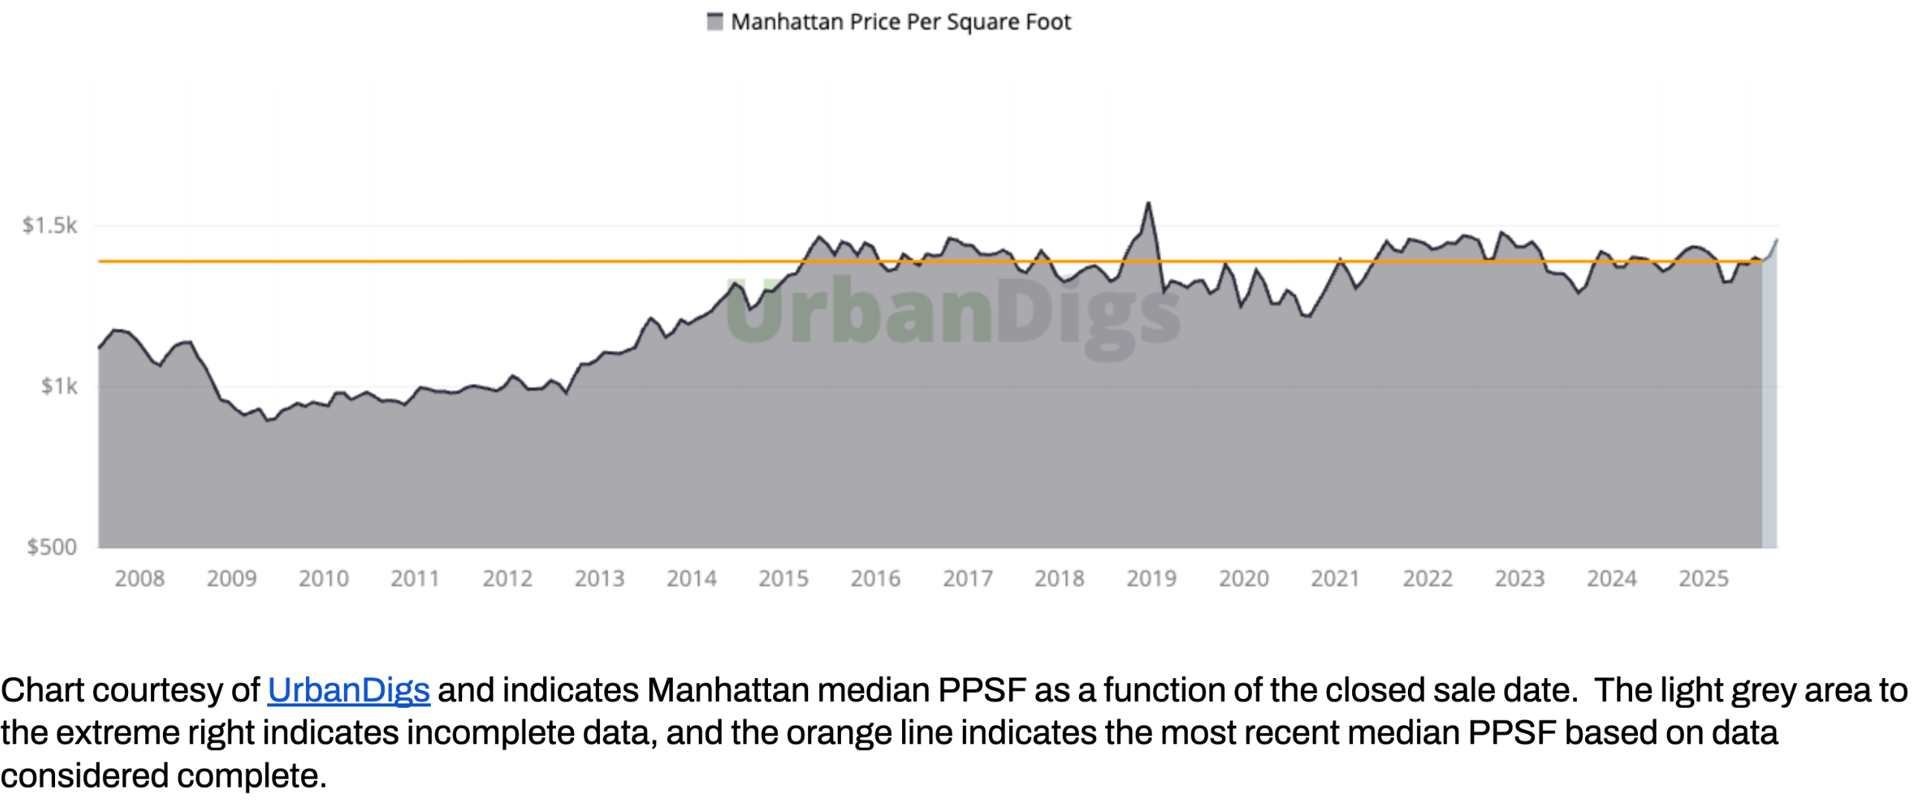
THE MANHATTAN PPSF STORY
After rising from a post-financial-crisis trough near $950/sf to approximately $1,350 by 2015, Manhattan's median PPSF has traded in a remarkably tight range for over a decade — currently at $1,461, near the high end of that range. This is not stagnation. It is one of the defining characteristics of a mature, supply-constrained market that absorbs macro shocks without the dramatic drawdowns seen elsewhere.
For investors, this means Manhattan is not a market to buy for explosive upside. It is a market to buy for capital preservation, rental yield, currency diversification, and quality of asset. In a world of elevated macro uncertainty, those objectives are more relevant than ever.
References
1. Data courtesy of UrbanDigs
2. According to the Howard Hanna NYC Manhattan Leverage Index
3. Data courtesy of StreetEasy · February 2026 NYC Market Report
4. Data courtesy of Federal Reserve Bank of St. Louis
5. JUMBO mortgage rate APR data courtesy of Bank of America, Chase, and Wells Fargo
6. Cover Photo by Rihards Gederts.
If you would like to chat about the most recent market activity,
feel free to contact us at [email protected] or connect with one of our Advisors.
Howard Hanna NYC brings the nation’s largest independent and family-owned brokerage to New York City, uniting the strength of a national network with the insight and sophistication of a local firm. Formed through joining forces with Elegran Real Estate, Howard Hanna NYC delivers a seamless, full-service experience backed by more than 15,000 agents across 500 offices in 14 states. The firm’s forward-thinking, agent-first culture continues to shape the future of real estate across Manhattan and the Tri-State area.Learn more at www.howardhannanyc.com.