
Prices Are Up, Per-Foot Pricing Is Down: What Manhattan's May Data Really Says
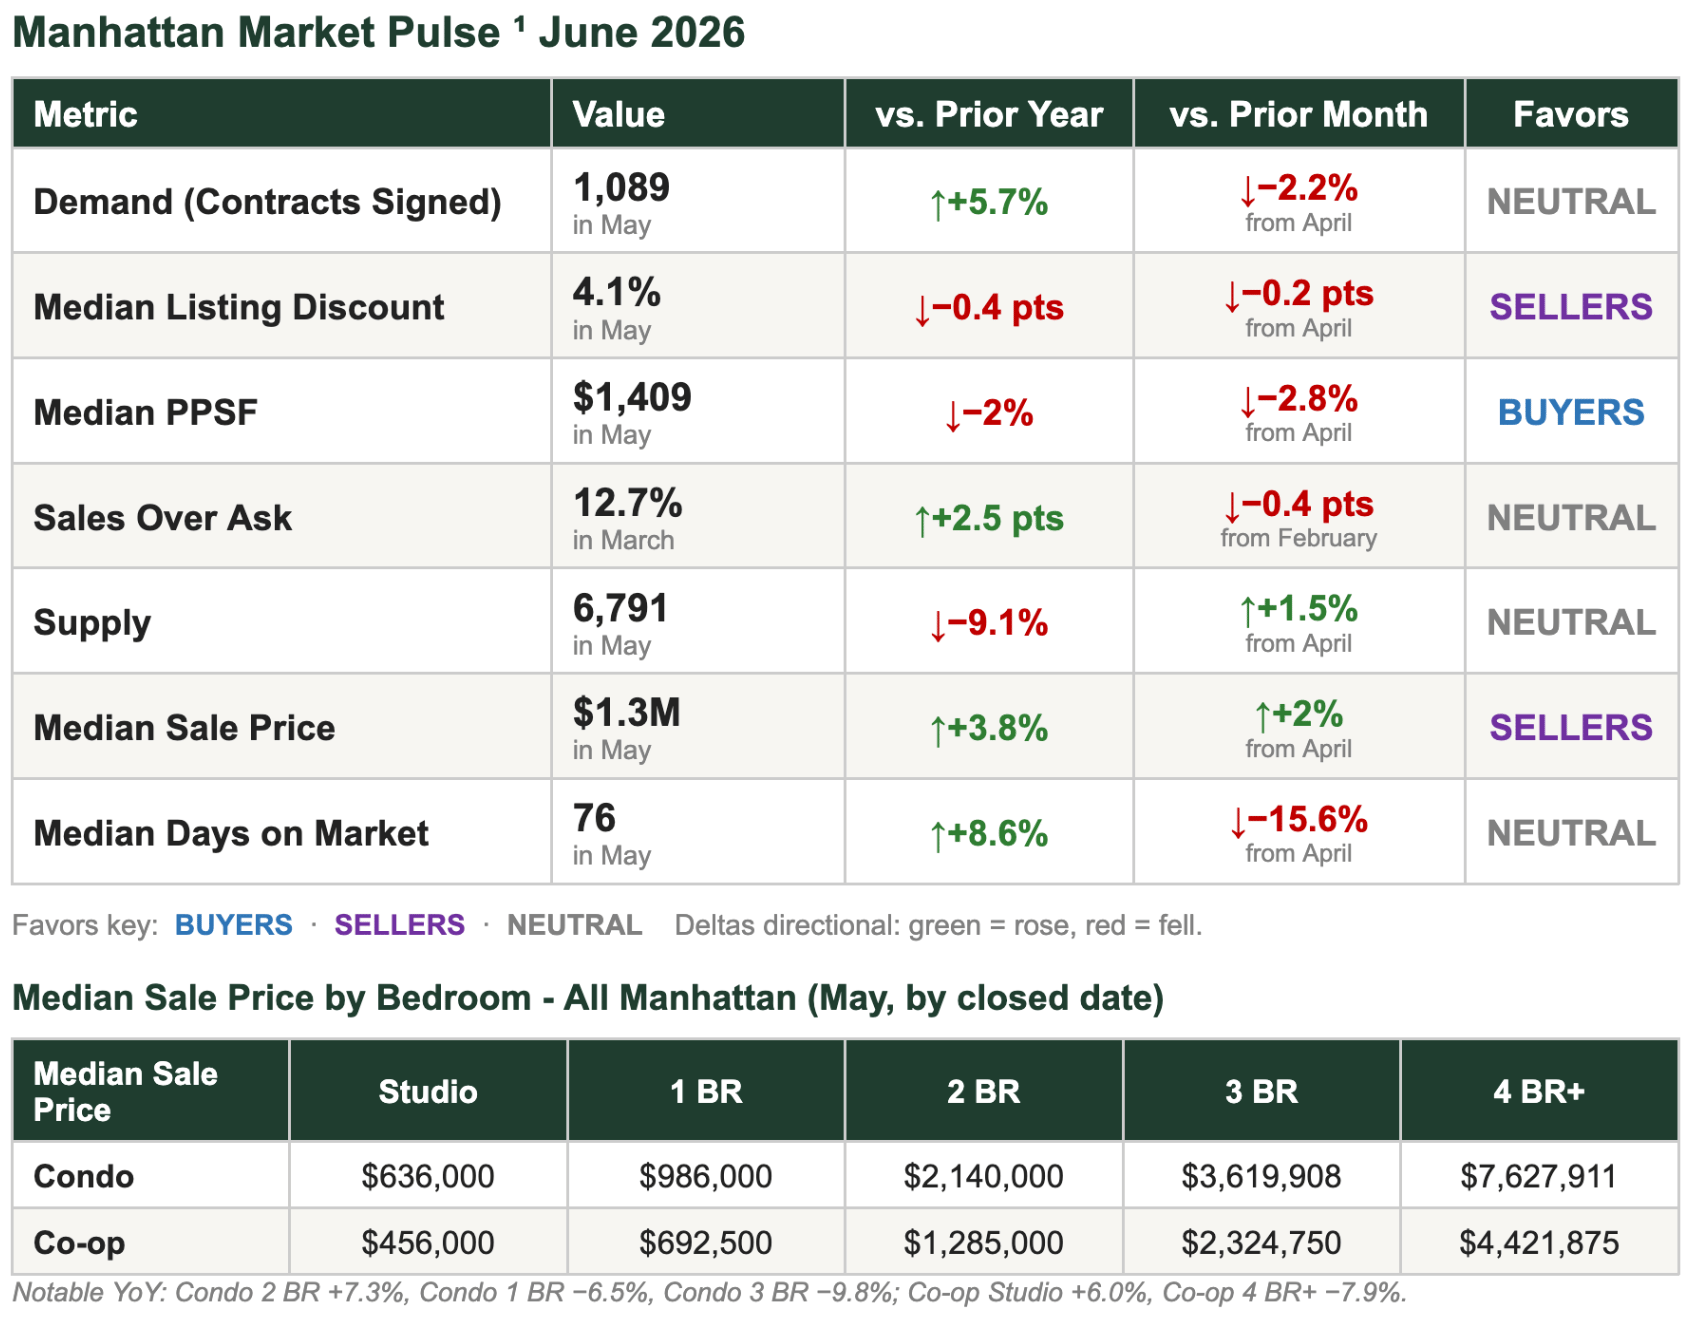
Manhattan's spring market carried positive year-over-year demand into May even as the month-over-month pace cooled off the April peak. The Howard Hanna NYC Manhattan Leverage Index² held in seller-leaning territory — supply still well below 2025, discounts compressing to 4.1%, and median sale price up 3.8% YoY — but median price per square foot slipped on both axes, the season's first clear softening signal. In this market, accurate pricing matters more than timing.
MARKET SNAPSHOT: FIVE NUMBERS THAT MATTER
-
1,089 contracts signed in May — down 2.2% from April but +5.7% year-over-year. Annual demand is strengthening even as the monthly pace eases off the spring high.
-
6,791 active listings — up 1.5% from April, still 9.1% below last year. The structural supply deficit actually widened year-over-year.
-
$1.3M median sale price — up +3.8% YoY and +2% from April. Headline appreciation is holding.
-
$1,409 median price per square foot — down 2.8% from April and 2% YoY.
-
4.1% median listing discount — down 0.2 pts from April and 0.4 pts YoY. Negotiating room keeps compressing, not expanding.
Bottom line: Manhattan stayed seller-leaning in May — demand is running ahead of last year, discounts keep shrinking, and inventory is still scarce. The one shift worth watching: per-square-foot pricing softened even as headline prices rose, a sign the mix of what's selling is changing rather than the market cooling.
KEY TAKEAWAYS
-
Demand is +5.7% YoY at 1,089 contracts — running ahead of last spring — though it dipped 2.2% MoM as the seasonal pace normalized.
-
Pending sales surged to 3,756 (+19.1% MoM, +14% YoY), a strong forward signal that the contract dip is timing, not weakness.
-
Supply at 6,791 is up modestly MoM but the YoY deficit widened to 9.1% — the structural shortage is intact.
-
Median sale price at $1.3M (+3.8% YoY) holds, but median PPSF at $1,409 fell 2% YoY — the two diverge, pointing to a unit-mix shift rather than uniform price movement.
-
Listing discounts compressed to 4.1% — multi-year-low territory. The era of 6–8% negotiating room has not returned.
-
12.7% of sales (March data) closed above ask, up 2.5 pts YoY — competition for well-priced listings remains real.
-
Jumbo rates near ~6.5% keep urgency for rate-sensitive buyers; Manhattan's equity-heavy profile limits the impact.
OUTLOOK
May confirmed a market that is still seller-leaning but no longer uniformly firming. Demand and pricing remain above last year, discounts keep tightening, and supply stays scarce — yet per-foot pricing softened and days-on-market, while down sharply MoM to 76, is still 8.6% above last year. The signal to watch is whether PPSF stabilizes or extends lower; that, more than the headline median, will tell us where true pricing power sits.
For sellers: the window remains favorable, but precise pricing matters more than ever — the market rewards accuracy, not ambition.
For buyers: per-foot value has improved and selection is the best in months, but waiting for broad price relief means competing against a market still tracking ahead of last year.

Photo by Rihards Gederts | Howard Hanna NYC
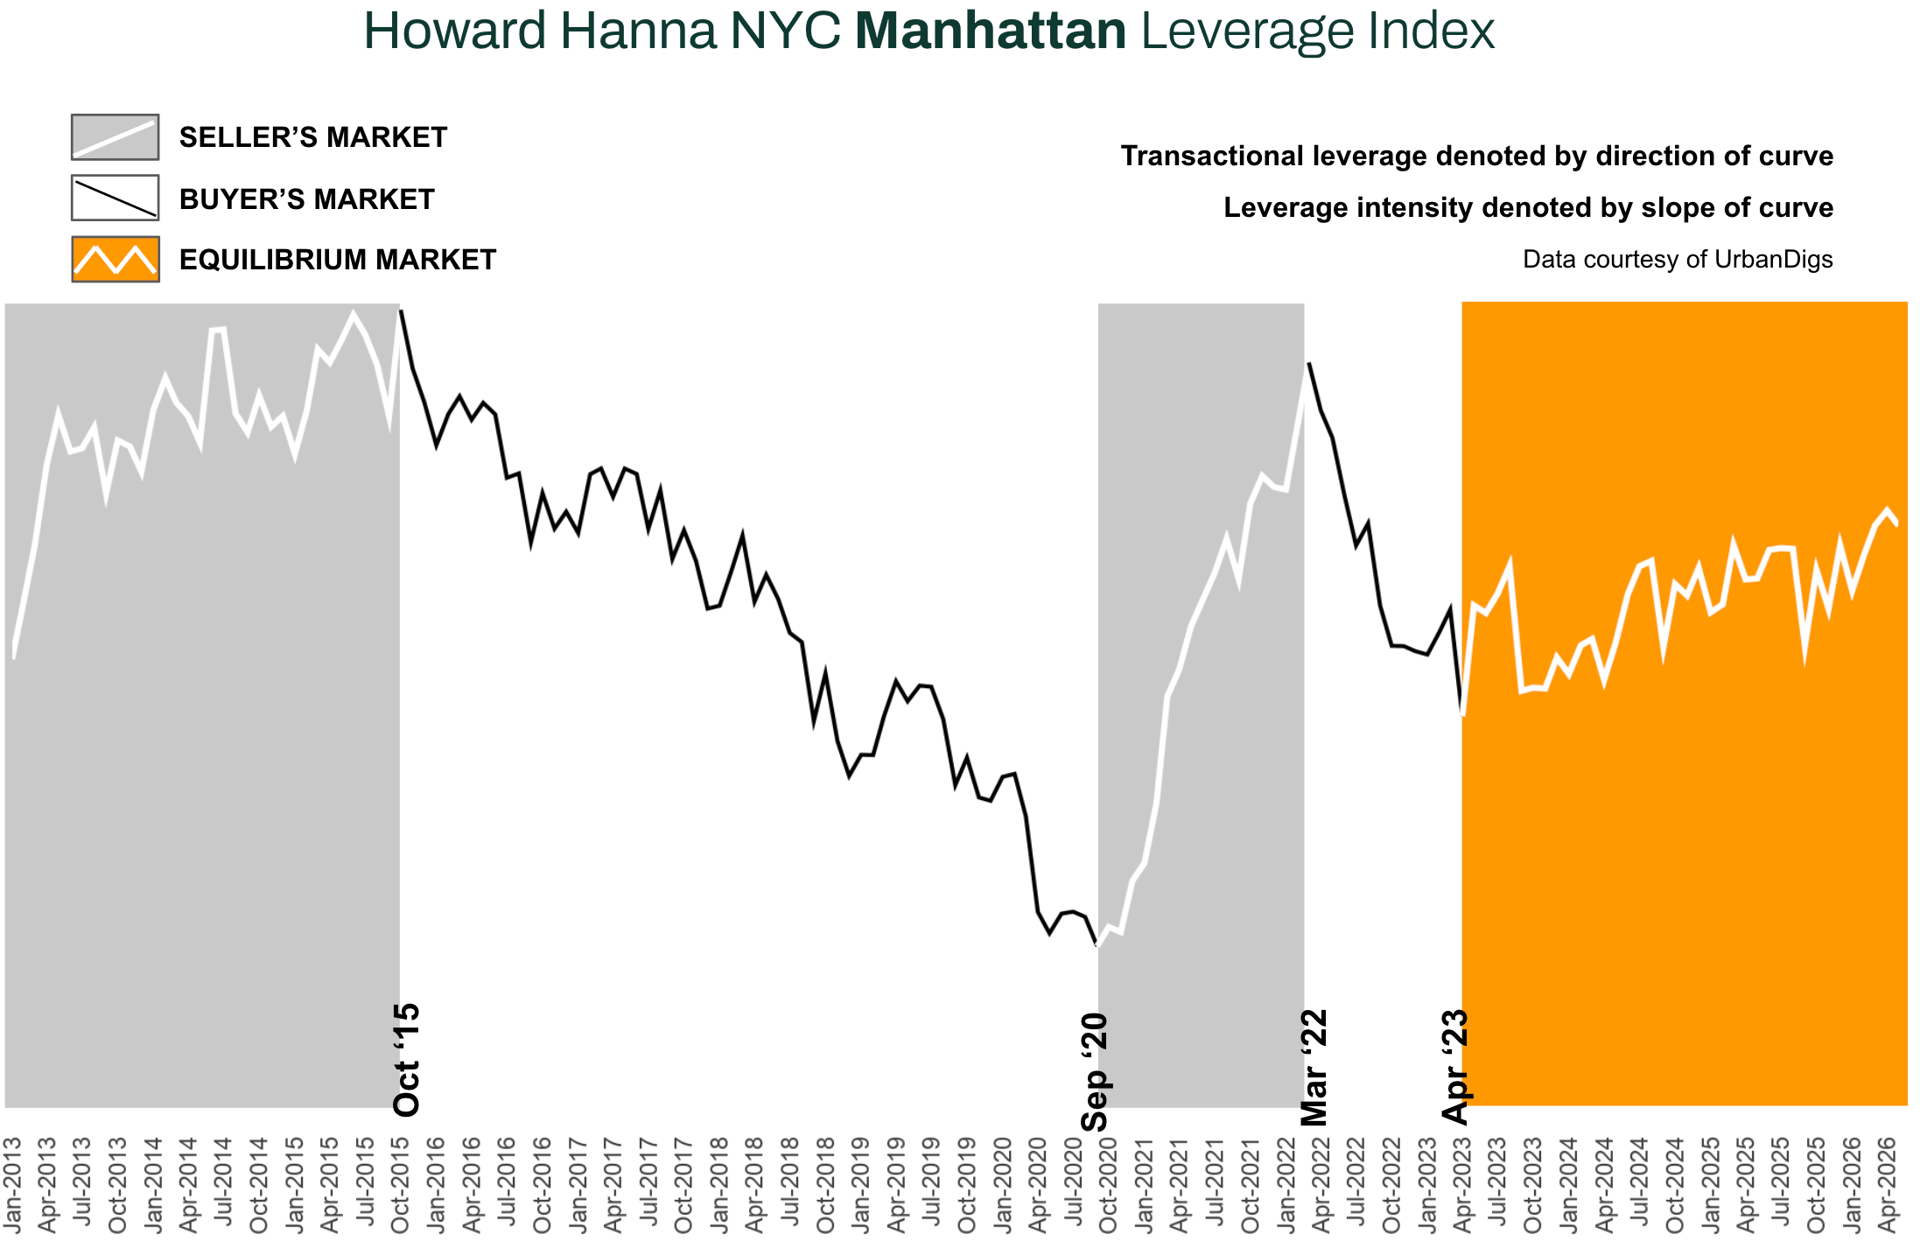
Howard Hanna NYC Manhattan Leverage Index
The Howard Hanna NYC Manhattan Leverage Index blends four key market signals – supply, demand, median PPSF, and median listing discount – to gauge the balance of power between buyers and sellers in Manhattan. It’s a proprietary index that distills these metrics into one indicator of market leverage. Direction Matters:
-
An upward-sloping curve = seller’s market
-
A downward-sloping curve = buyer’s market
The steeper the slope, the stronger the advantage for either side
In May 2026, the index held in seller-leaning territory but flattened at the margin. Demand stayed positive YoY (+5.7%) and the listing discount compressed further (4.1%) — both seller-supportive — while the supply deficit widened to 9.1% below last year. The one counter-signal: median PPSF turned negative on both axes (−2% YoY, −2.8% MoM), easing off the spring high. The net read is still an upward, seller-leaning slope — just a shallower one than April.
Historically, this resembles mid-cycle normalization periods such as 2013–2015 — modest rate pressure coexisting with steady prices and no broad correction. What distinguishes this cycle is structural undersupply: inventory remains well below 2017–2019 averages, limiting the probability of distress-driven repricing.
Manhattan Supply
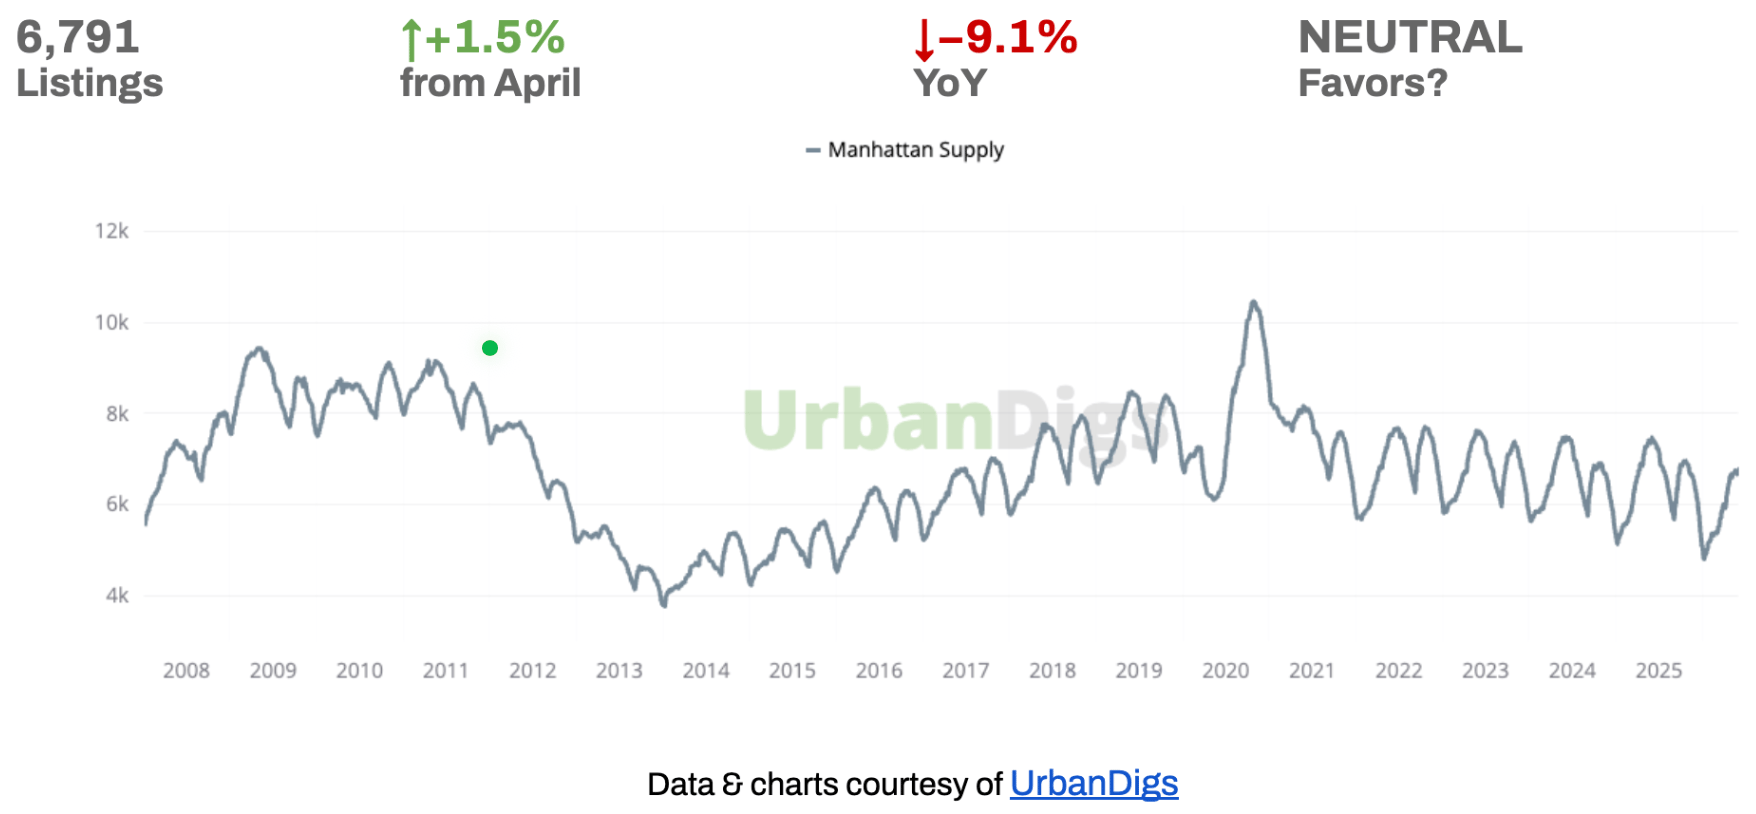
SUPPLY EDGES UP, BUT THE YOY DEFICIT WIDENS
Active listings rose +1.5% from April to 6,791 in May — a modest third monthly gain — yet remain 9.1% below this time in 2025, a deeper annual deficit than April's −7.4%. Because the year-over-year deficit (down) and the month-over-month build (up) point in opposite directions, supply reads NEUTRAL rather than favoring either side.
🟦 Buyers: Selection is improving off the spring lows, but the pool is still well under 2025 — the structural shortage hasn't gone away.
🟪 Sellers: Less competing inventory than a year ago; the widening YoY deficit keeps the structural tilt in your favor. Listing into the summer window keeps you ahead of the curve.
Outlook: Inventory should keep filling through summer, but with the YoY deficit near double digits, a decisive shift toward buyers is unlikely absent a macro shock.
Manhattan Demand
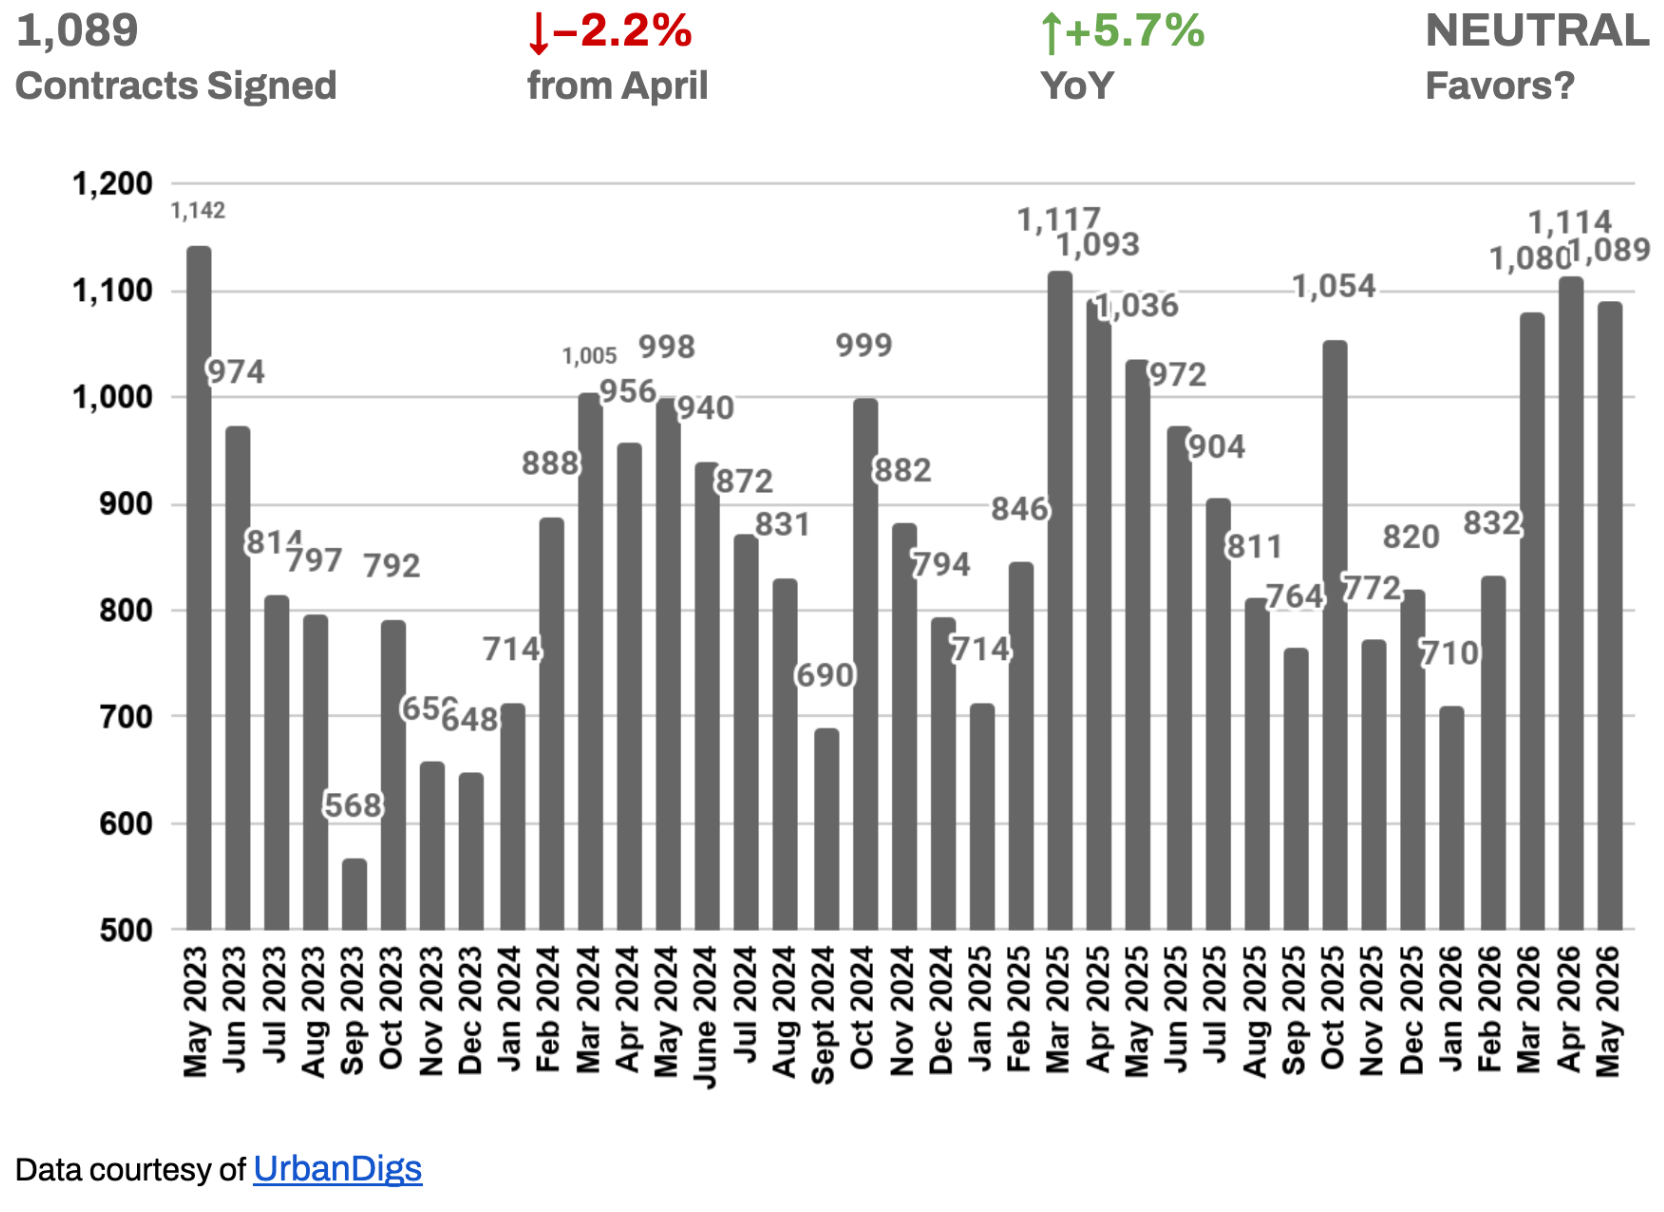
DEMAND HOLDS ABOVE LAST YEAR AS THE MONTHLY PACE COOLS
May brought 1,089 signed contracts — down 2.2% from April but +5.7% YoY, a strong annual gain. The monthly dip reflects normal seasonal cooling off the spring peak, not a loss of momentum.
The forward pipeline is firmer than the contracts dip suggests — pending sales jumped to 3,756 (+19.1% MoM, +14% YoY), pointing to a healthy volume of deals working toward closing. With the annual trend up but the monthly pace eased, demand reads NEUTRAL this month — a step down from April's seller call.
🟦 Buyers: The slight cool-down is a window, not a turn — demand is still ahead of last year. Move on well-priced product before the pending pipeline converts.
🟪 Sellers: Buyer interest remains above 2025 and the pending count is strong — activity is being sustained, not lost. Price to engage it now.
Outlook: With pending sales surging and YoY demand positive, contract volume should stay resilient into early summer.
Manhattan Median PPSF
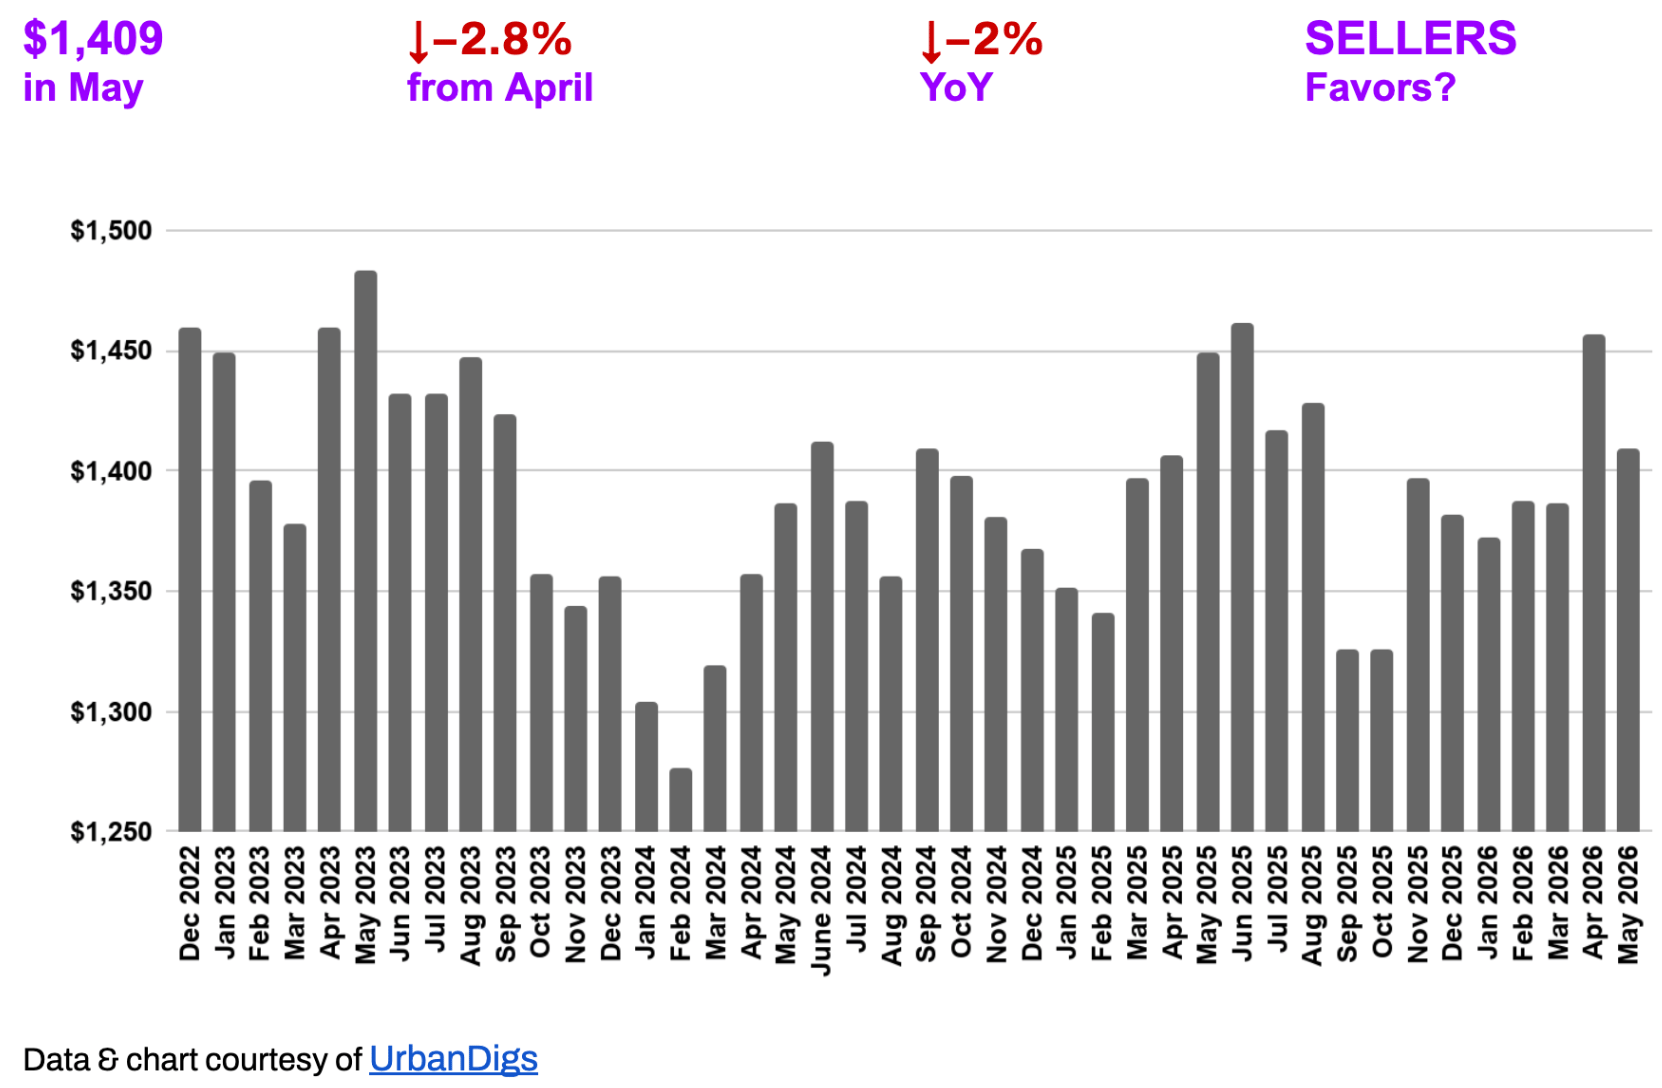
PRICE PER SQUARE FOOT SOFTENS OFF THE SPRING HIGH
Median price per square foot eased to $1,409 in May, down 2.8% from April and 2% YoY — the first reading negative on both axes this season, which flips this single metric to buyer-favorable.
Worth watching: the headline median sale price is still +3.8% YoY even as PPSF is −2% YoY.
Structurally, Manhattan PPSF has held in a tight band for over a decade — a mature, supply-constrained market that absorbs shocks without dramatic drawdowns. A single softer month does not break that band.
🟦 Buyers: Per-foot value has come back to you — the most room to argue $/sq-ft in months. Bring comps; co-ops continue to offer meaningful PPSF advantages over comparable condos.
🟪 Sellers: Anchor on recent like-for-like per-foot comps, not the spring high. Overreaching on $/sq-ft is the fastest way to add days on market.
Outlook: One soft month is not a trend. Watch whether the YoY figure stabilizes or extends lower next month — the clearest read on true pricing power.
Manhattan Median Listing Discount
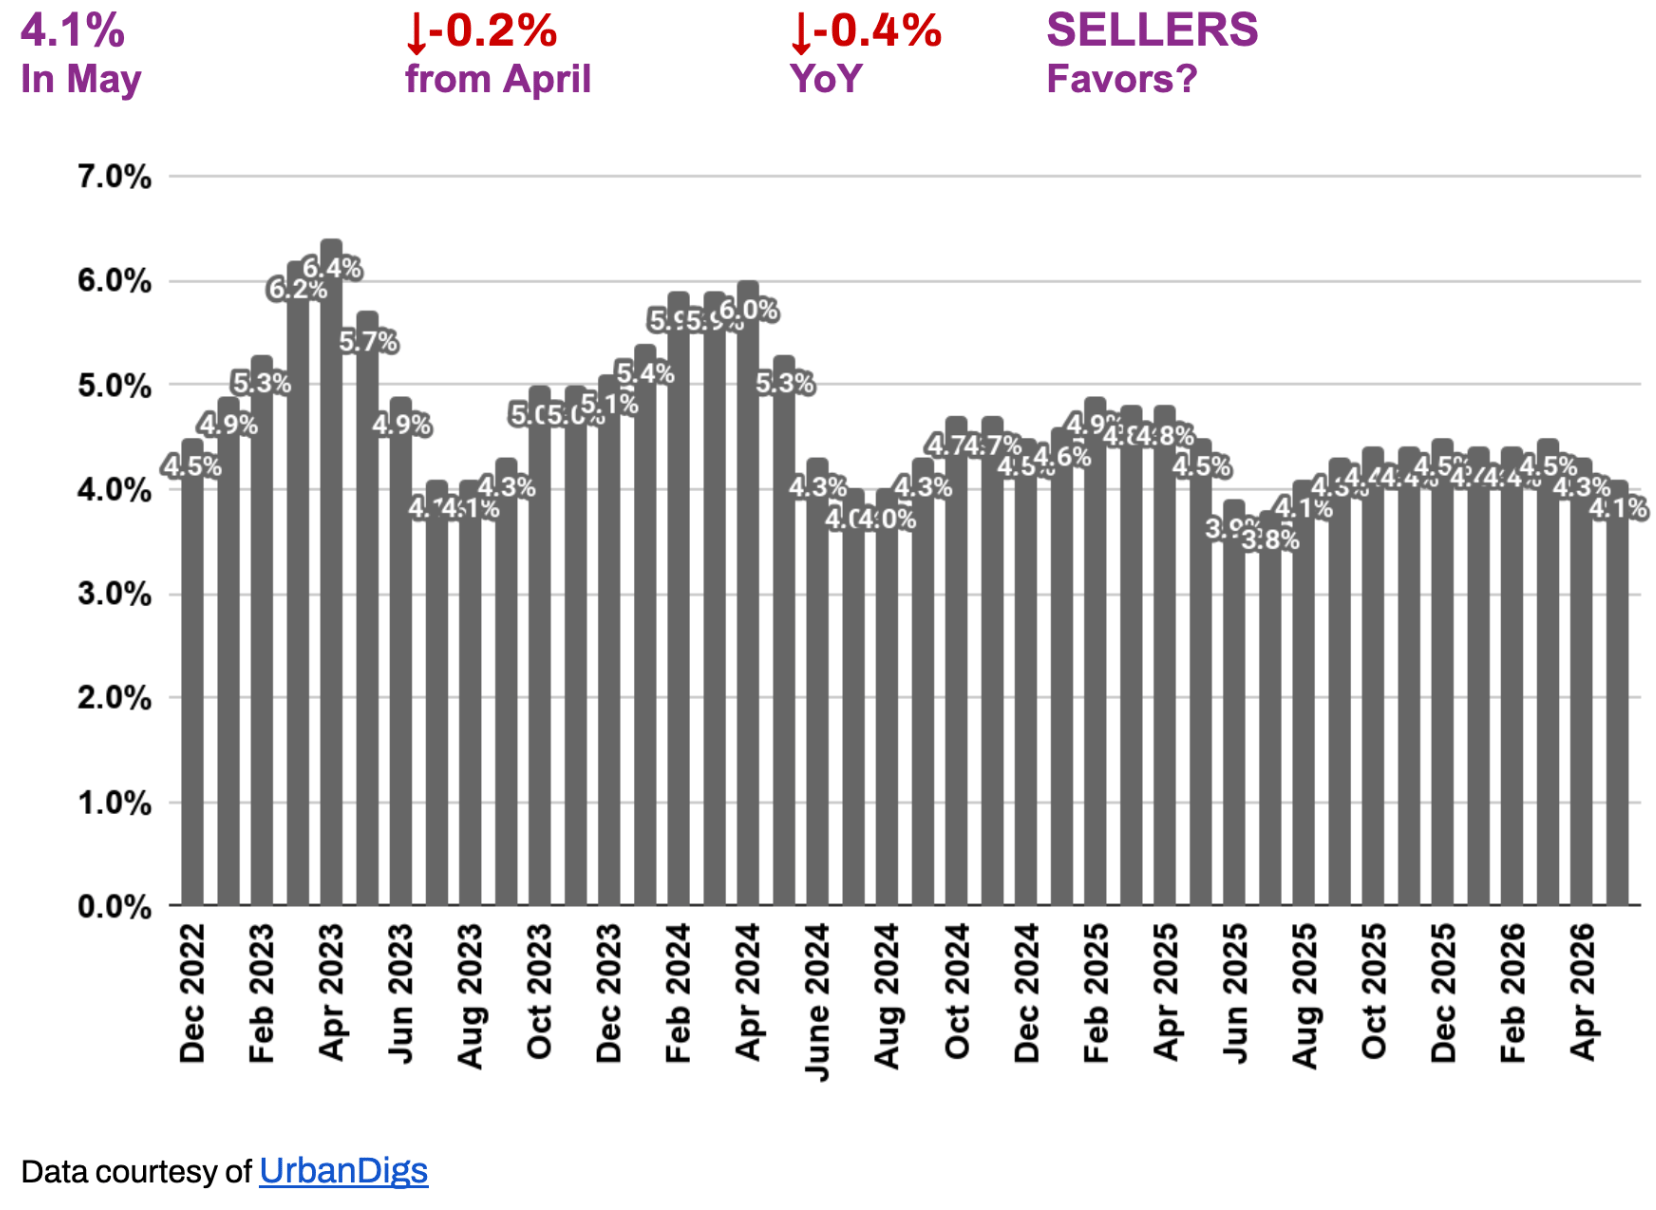
DISCOUNTS KEEP COMPRESSING — NOW 4.1%
The median listing discount tightened to 4.1% in May, down 0.2% from April and 0.4% YoY. Discounts compressing on both axes is a clean SELLERS signal — and it confirms the tightening trajectory flagged last month.
Read alongside the softer PPSF, the message is precision, not aggression: the gap between ask and trade is shrinking even as per-foot value eases — so the reward goes to sellers who price tightly to the market, not above it.
🟦 Buyers: Walking in expecting a 6–8% haircut will lose deals — the market trades close to ask. Lead with a credible offer rather than a deep opening cut.
🟪 Sellers: A sharp, accurate list price is converting near ask — 12.7% of recent sales closed above ask. Resist padding the number for negotiating room; the data says it isn't needed.
Outlook: With supply still tight YoY and discounts grinding lower, expect negotiation room to stay in the low-4% range near term, absent a faster inventory build.
RENTAL REMARKS
RENTS ACCELERATE INTO PEAK SEASON — ASKING UP 8.2% YOY
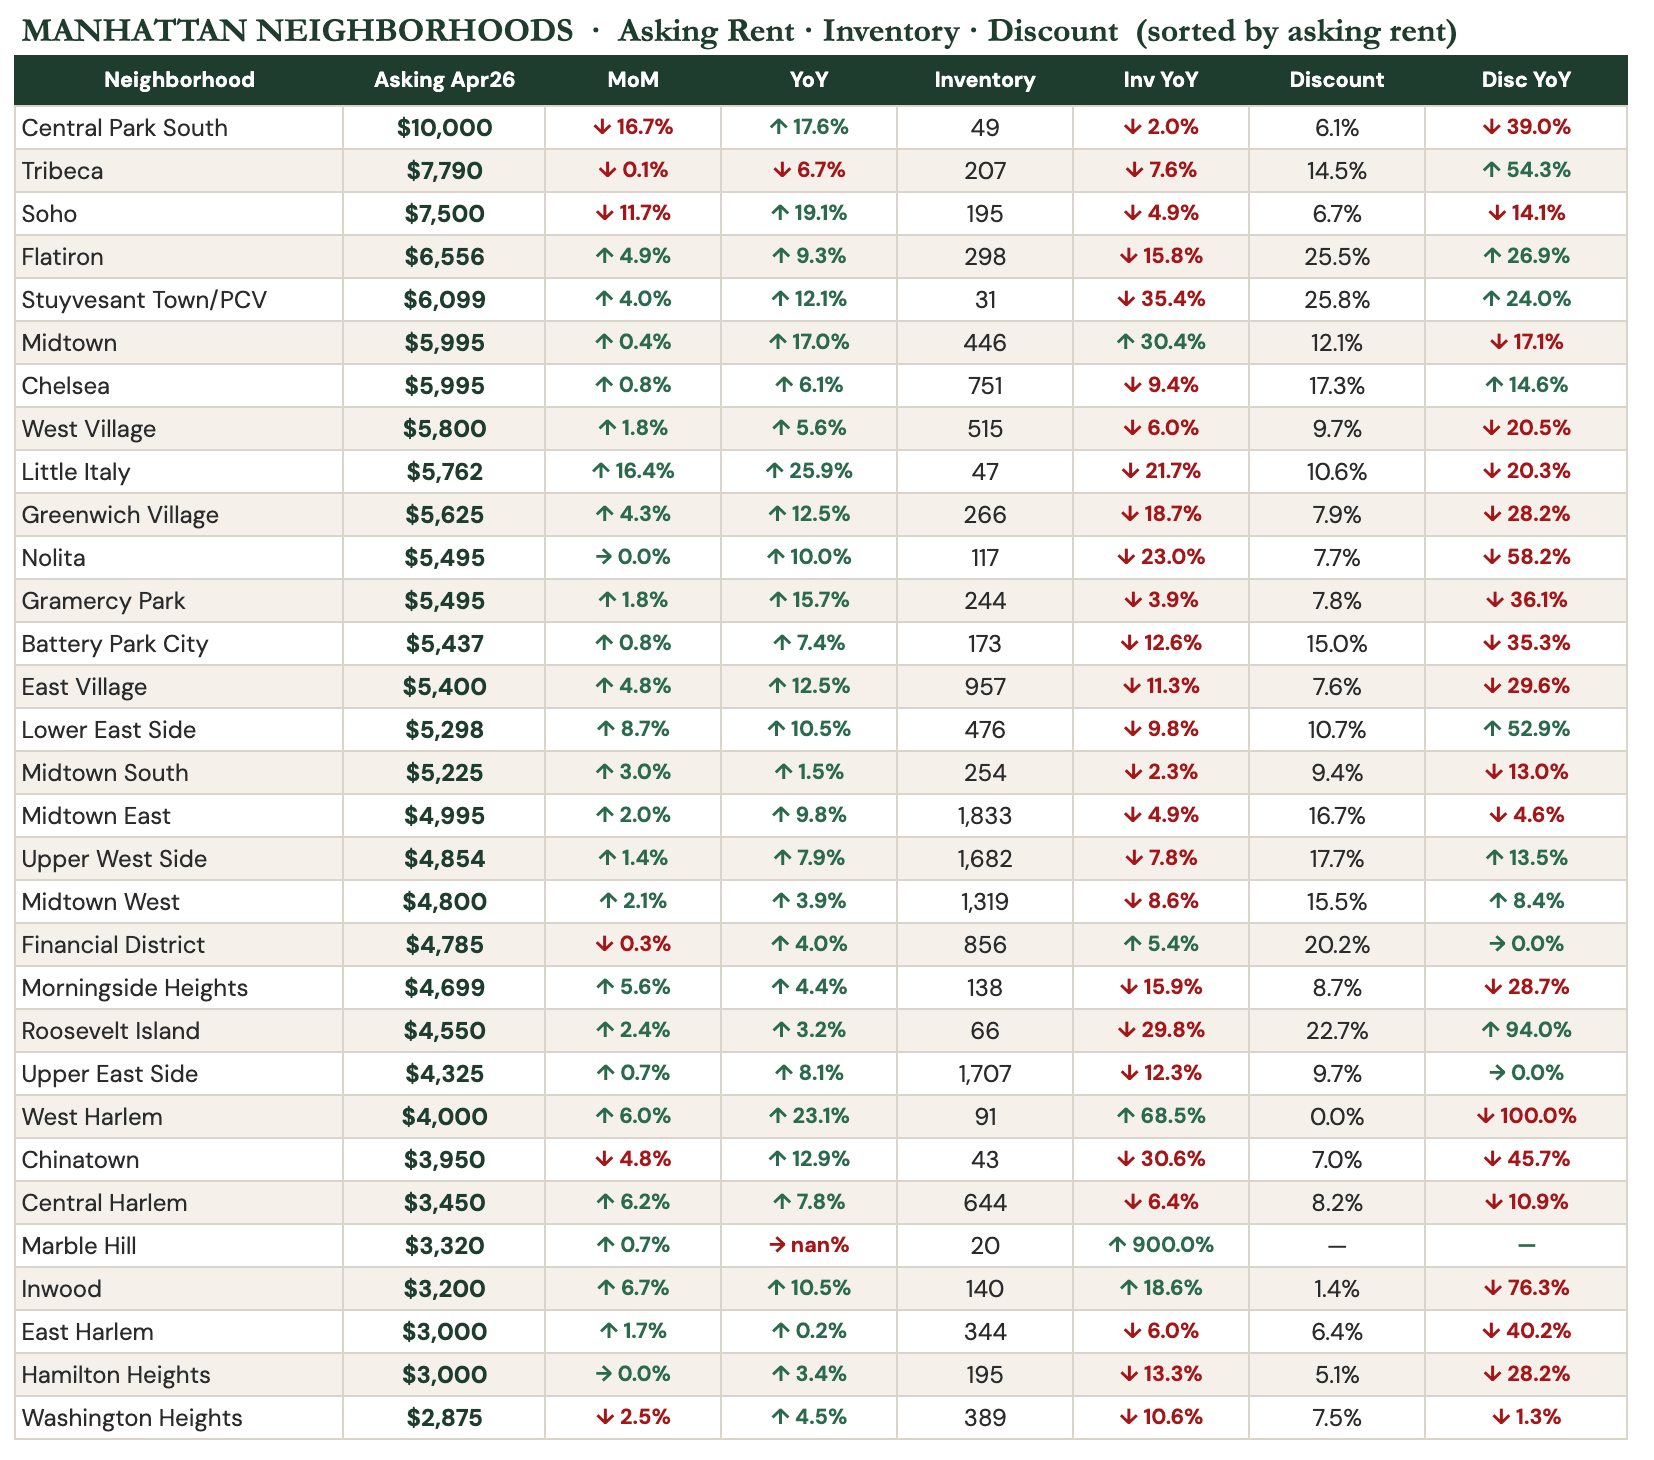
Manhattan’s median asking rent reached $4,869 in April — up 2.5% from March and 8.2% year-over-year. Active rental inventory is down 7.2% year-over-year to 14,493 units (even as it rose 5.0% on the month), and only 13% of listings are cutting price — landlords are discounting less often.
Central Park South ($10,000), Tribeca ($7,790), and Soho ($7,500) lead on price; the most negotiating room sits in the Financial District (20% of listings discounted), the Upper West Side (18%), and Midtown East (17%). The Upper East Side ($4,325, +8.1% YoY) remains the value-to-address standout among prime neighborhoods.³
-
For Renters: Challenging conditions. Inventory is down 7.2% YoY and only 13% of listings are cutting price — move quickly on well-priced units. The most leverage sits in higher-discount pockets — the Financial District, Midtown East, and the Upper West Side — where a meaningful share of landlords are still negotiating.
-
For Landlords: Strongly favorable. Asking rents are up 8.2% YoY, inventory is tightening, and fewer landlords are cutting price — demand is outpacing supply heading into summer.
-
Outlook: Landlord-favored through summer 2026. The StreetEasy Rental Price Index is up 6.6% YoY with the 13-month uptrend intact. Key risk: meaningful mortgage-rate relief could pull renters into buying and ease competition. Absent that, rents stay firm through at least Q3 2026.
MORTGAGE REMARKS
RATES ELEVATED — BUT MANHATTAN BUYERS ARE MORE INSULATED THAN MOST
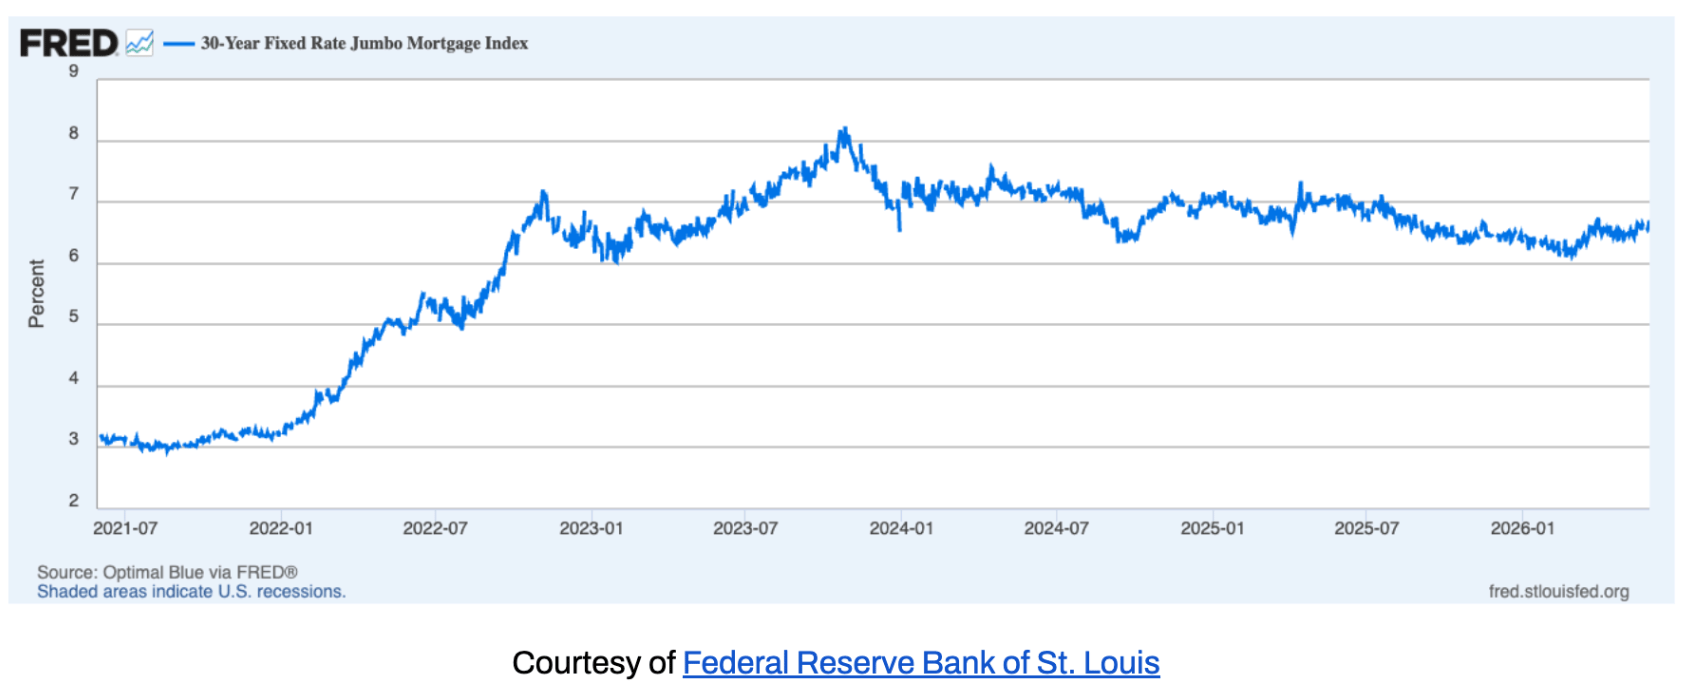
Average 30-year jumbo rates were hovering around 6.6%⁴ as of late May, with effective APRs near 6.6%⁵ — up from May and about 50 basis points above the winter low near 6.1%. The brief window of relative stability has unwound and rates have drifted higher into the spring. For buyers, the question is not whether rates will fall to 5% — it is whether waiting for that scenario means missing a spring window that may offer better inventory and less competition than the fall cycle.
Manhattan buyers tend to be more equity-financed and less rate-dependent than the median U.S. homebuyer. This insulates the upper market from rate volatility. At current levels, rates are a friction cost, not a deal-breaker, for buyers operating at Manhattan price points with significant cash contributions.
Outlook: The rate path depends heavily on incoming inflation and labor data. A further move toward 7% is possible if inflation proves sticky; a drift back toward 6% is equally possible if the economy softens. In the absence of clarity, locking early on well-priced properties remains the prudent strategy rather than holding out for a rate environment that may not arrive on schedule.
INVESTOR INSIGHTS
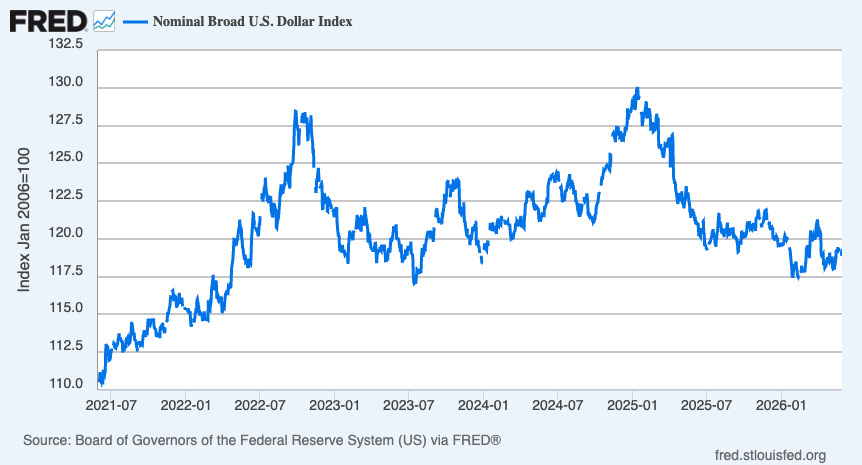
With the US dollar down 10–15% against major currencies over the past year, Manhattan is effectively cheaper for European and Gulf buyers without any change in asking prices. The FX tailwind is real, quantifiable, and underused in listing conversations with international clients. A €1M budget buys meaningfully more Manhattan square footage today than it did twelve months ago.
DOMESTIC INVESTORS
The rent-versus-buy calculation continues shifting. At a $4,869 monthly median asking rent in Manhattan, the carrying cost of owning a well-priced co-op is increasingly competitive for buyers with sufficient capital. For long-term renters who have built savings over three years of rising rents, the conversation is worth having.
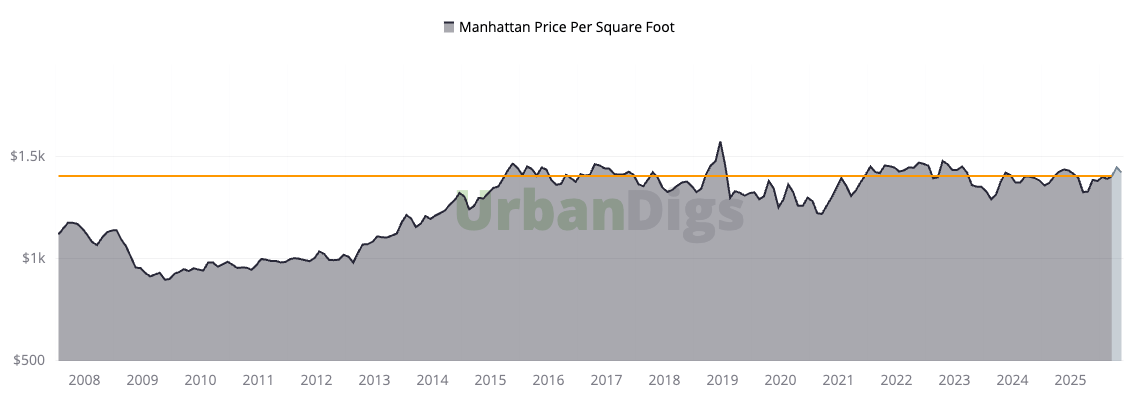
THE MANHATTAN PPSF STORY
After rising from a post-financial-crisis trough near $950/sf to approximately $1,350 by 2015, Manhattan's median PPSF has traded in a remarkably tight range for over a decade — currently at $1,409, easing off the recent high but still well within that long-run range. This is not stagnation. It is one of the defining characteristics of a mature, supply-constrained market that absorbs macro shocks without the dramatic drawdowns seen elsewhere.
For investors, this means Manhattan is not a market to buy for explosive upside. It is a market to buy for capital preservation, rental yield, currency diversification, and quality of asset. In a world of elevated macro uncertainty, those objectives are more relevant than ever.
References
1. Data courtesy of UrbanDigs
2. According to the Howard Hanna NYC Manhattan Leverage Index
3. Data courtesy of StreetEasy Data Dashboard
4. Data courtesy of Federal Reserve Bank of St. Louis
5. JUMBO mortgage rate APR data courtesy of Bank of America, Chase, and Wells Fargo
6. Cover Photo by Rihards Gederts.
If you would like to chat about the most recent market activity,
feel free to contact us at [email protected] or connect with one of our Advisors.
Howard Hanna NYC brings the nation’s largest independent and family-owned brokerage to New York City, uniting the strength of a national network with the insight and sophistication of a local firm. Formed through joining forces with Elegran Real Estate, Howard Hanna NYC delivers a seamless, full-service experience backed by more than 15,000 agents across 500 offices in 14 states. The firm’s forward-thinking, agent-first culture continues to shape the future of real estate across Manhattan and the Tri-State area.Learn more at www.howardhannanyc.com.