Mortgage “Deterrent”
Within the color-coded “Total Weekly Demand” chart below, we’ve placed Mortgage "Deterrent” in quotes. Why? Well, climbing mortgage rates did deter consumerism in 2022. In May, as interest rates breached 5%, demand for NYC residential real estate quickly dialed down from 75% above its pre-pandemic average* to that average. The result was an inversely proportional relationship between mortgage rates and contracts signed, just as Economics 101 would suggest.
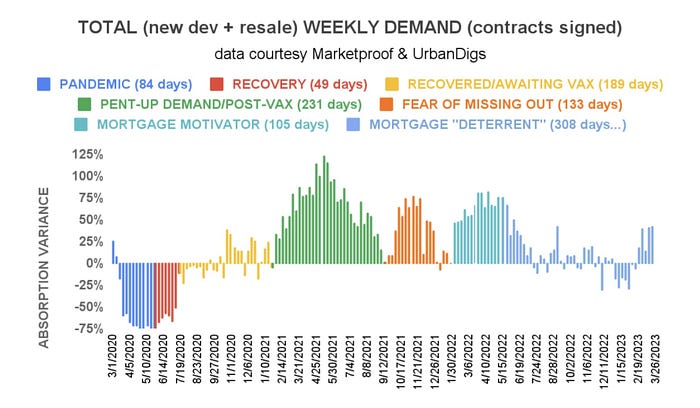
Currently, rates are on the rise again, but so is demand. Rising rates no longer appear to be a deterrent, however, hence the need for quotations.
* the period January 5, 2015, to March 1, 2020
The Collapse of SVB
The fall of Silicon Valley Bank is another big loss within the Wall Street casino. We’ll withhold our opinions on what, if any, ripple effects it will have on the banking industry because that’s not what we do, and, frankly, we don’t know! However, we can say with confidence that investors can’t make a run on brick-and-mortar residences in NYC. Across 9/11, the 2009 financial crisis, and COVID-19, NYC residential real estate lost less than 20% of its value and fully recovered each time.
Manhattan Supply
The chart below serves as an almanac, suggesting what we can expect. Spring’s supply increase is more gradual en route to the June peak, whereas fall’s bounce to the October peak is much more abrupt. Not surprisingly, the metric was up again this week from 6,282 to 6,371 units, including 437 new listings.
Chart Courtesy of UrbanDigs
Brooklyn Supply
Without Manhattan’s depth of historical data to clearly illustrate the trend, it still exhibits a bi-annual supply cycle. As we expected, the metric increased this week from 2,945 to 2,980 units, including 212 new listings.
Chart Courtesy of UrbanDigs
Manhattan Pending Sales
Like the supply “almanac”, the pending sales chart provides us with a very clear picture of what to expect. Any deviation from the large peak in June and the smaller peak in December would certainly qualify as news and be reported. As expected, the metric increased week over week from 2,358 to 2,436 units.
Chart Courtesy of UrbanDigs
Brooklyn Pending Sales
This week’s observation is the same as what we witnessed in Manhattan where, right on cue, the metric reached its seasonal February trough and has reversed direction. We can also “predict” that the first of two peaks this year should occur in June. This week, the metric increased from 1,502 to 1,507 units.
Chart Courtesy of UrbanDigs
Manhattan Contracts Signed
After spending the majority of the past seven months under the historical average (the average weekly number of signed contracts from Jan 5, 2015, to Mar 1, 2020), demand for Manhattan has now remained above that average for the past five weeks. This week, 244 contracts were signed.
Brooklyn Contracts Signed
Brooklyn is peaking for the sixth consecutive time since the pandemic. After briefly touching in mid-January the pre-pandemic average (the average weekly number of signed contracts from Jan 5, 2015, to Mar 1, 2020), which has become the metric’s support level for the past two years, signed contracts have skyrocketed above that average. This week, 136 contracts were signed.
New Development Insights
As reported by Marketproof, 67 new development contracts were reported across 52 buildings this week. The following were the top-selling new developments of the week:
- 300 WEST 30 STREET (Chelsea)
- SELENE (Midtown)
- 450 WASHINGTON (Tribeca)