
As the Manhattan and Brooklyn markets normalize coming out of the pandemic, it’s important to utilize a fair benchmark for the basis of comparison. Just as a fair benchmark would not be the first months of COVID-19, where contracts plummeted, neither would be the atypical 2021 and H1–2022, where we witnessed record buying activity from the one-two punch of pent-up demand followed by the pulled forward future demand as mortgage rates climbed. The COVID-19 pandemic was (hopefully) a once-in-a-generation event, as was the confident demand that ensued. So, we need to extend the look-back period for our comparison in search of a more “normal’’ time frame.
When we use the long-term average (Jan 2015 — Feb 2020) as our benchmark — as we have in our graphs — we still need to practice caution when analyzing. This week, within the new development market for example, the number of contracts signed was 28% lower than that average. Should that be concerning?
No. At least, not yet. Why?
Because a single data point is not a trend. If it was, then we would have looked at the week ending Aug 13th and thought the new development market was en fuego since contracts signed that week were 33% greater than the benchmark.
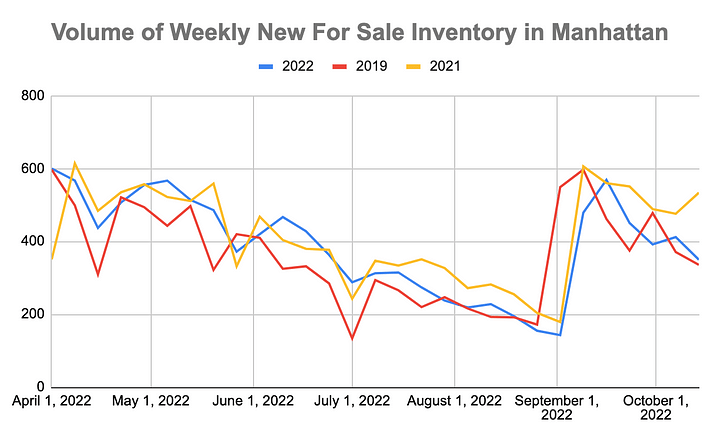
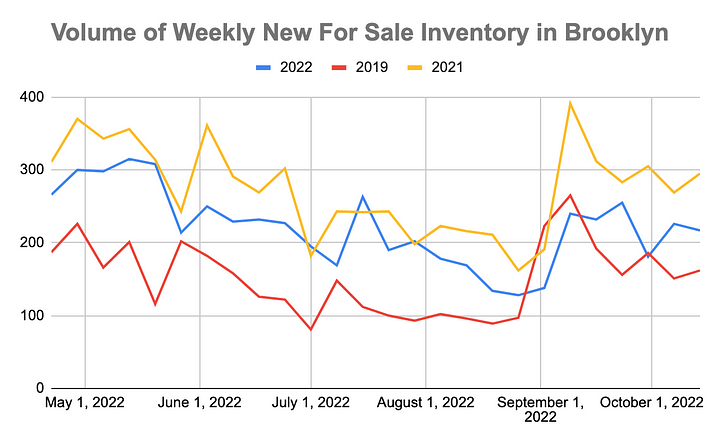
However, if we look at the graph over the past few months — since early May when we noticed that mortgage rates rose to a point where they transitioned from motivator to deterrent (the transition from yellow to blue within the graphs) — 11 weeks have logged contract volume above the benchmark and 11 weeks have recorded contract volume below the benchmark, for an average very near to the long-term average.
So, reviewing this week, did the new development market underperform? Yes. Has it underperformed over the past 6 months? No. As we’ve been reporting, it is behaving normally. And “normal” doesn’t mean that each week mirrors the long-term average. Remember that the benchmark is a very bumpy line made smooth by the average function. And the markets now, both primary and resale, are very much the same — bumping along the benchmark — sometimes above, sometimes below, but along the line nonetheless.
Manhattan Supply
Increased 2% again this week to 7,689 units as 350 new listings came to market, 15% less than last week, but 4% more than the same week in 2019.
Brooklyn Supply
Was slightly higher this week with 3,485 units for sale, 217 of which were new to market. The number of new listings is 4% less than last week but 34% more than the same week in 2019.
Manhattan Pending Sales
Decreased only 2% this week to 2,761 but remained below the 3k level for the third week in a row and only the third time since February 2021.
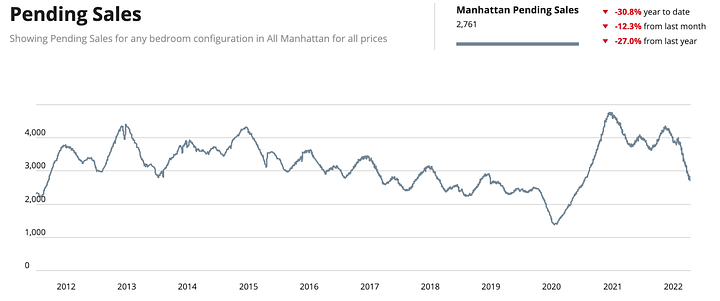
Chart courtesy of UrbanDigs
Brooklyn Pending Sales
2,100, decreased by 2% again this week but are at parity with this time last year.
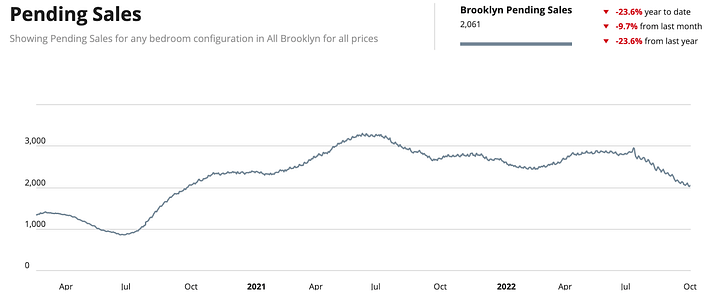
Chart courtesy of UrbanDigs
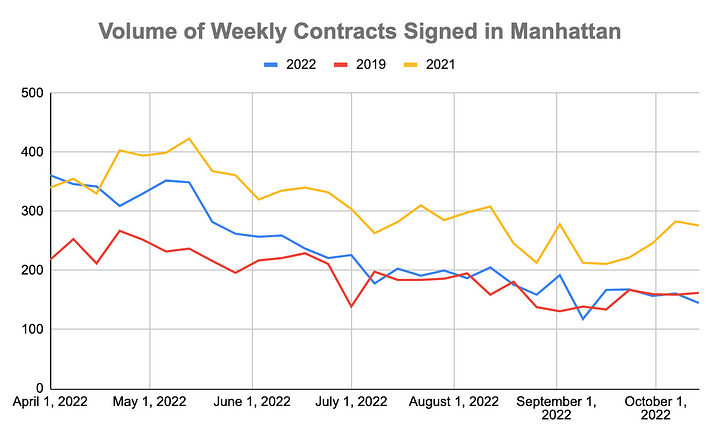
Manhattan Contracts Signed
145 contracts were signed this week, a 10% dip from both last week’s number and the same week in 2019. This is the first week that the contract signed activity has fallen significantly below 2019’s level. We’ll continue to monitor if this is a blip or the start of a new downward trend.
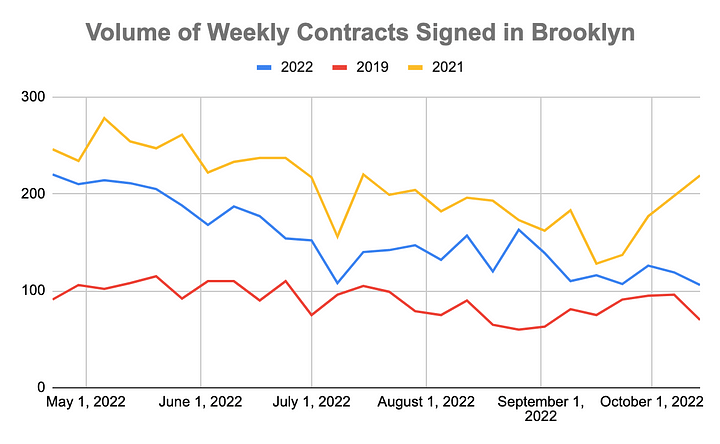
Brooklyn Contracts Signed
106 contracts were signed this week, an 11% pullback from last week but a 51% increase from the same week in 2019.
New Development Insights
As reported by Marketproof, this week, 39 new development contracts were reported across 28 buildings. The following were the top-selling new developments of the week:
- 567 Ocean Avenue in Flatbush
- One Wall Street in FiDi
- Greenwich West in Hudson Square
- 1228 Madison Avenue in Carnegie Hill