A Decline In Demand This Week: Problematic or Expected?
Demand, as measured by the number of contracts signed, was softer this week after last week’s religious holidays. However, after examining the historical data, we find that’s typical for the second week following a major holiday. Why? Because contracts take time to mature. If activity is slow during a holiday week, contract numbers won’t fully reflect this until the following week. In addition to the holidays, it was also spring break for many school systems across the country, and therefore, many would-be buyers were on holiday.
That being said, when we account for both primary (new development) and secondary (resale) activity across Manhattan and Brooklyn, this week’s aggregate is still significantly higher than the pre-pandemic average.*
*The period is January 5, 2015, to March 1, 2020
Manhattan Supply
The chart below serves as an almanac, and this year is shaping up just like years past. This week, supply increased from 6,723 to 6,938 units, and that number should continue to increase en route to the June peak.

Brooklyn Supply
Exhibits a bi-annual cycle, though it’s not as apparent without Manhattan’s depth of historical data to clearly illustrate the trend. This week, supply increased from 3,023 to 3,085 units, and that number should continue to increase as we head toward the June peak.

Chart Courtesy of UrbanDigs
Manhattan Pending Sales
Like the supply “almanac,” the historical pending sales chart provides us with a very clear picture of what to expect. Any deviation from the large peak in June and the smaller peak in December would certainly qualify as “news” and be reported. As expected, the metric increased week over week from 2,812 to 2,825 units as the borough headed towards its first peak.

Chart Courtesy of UrbanDigs
Brooklyn Pending Sales
This week’s observation is the same as what we witnessed in Manhattan where, right on cue, the metric reached its seasonal February trough and then reversed direction. We can also predict that the first of two peaks this year should occur in June and that the metric is about halfway there. This week, pending sales increased marginally from 1,699 to 1,700 units.
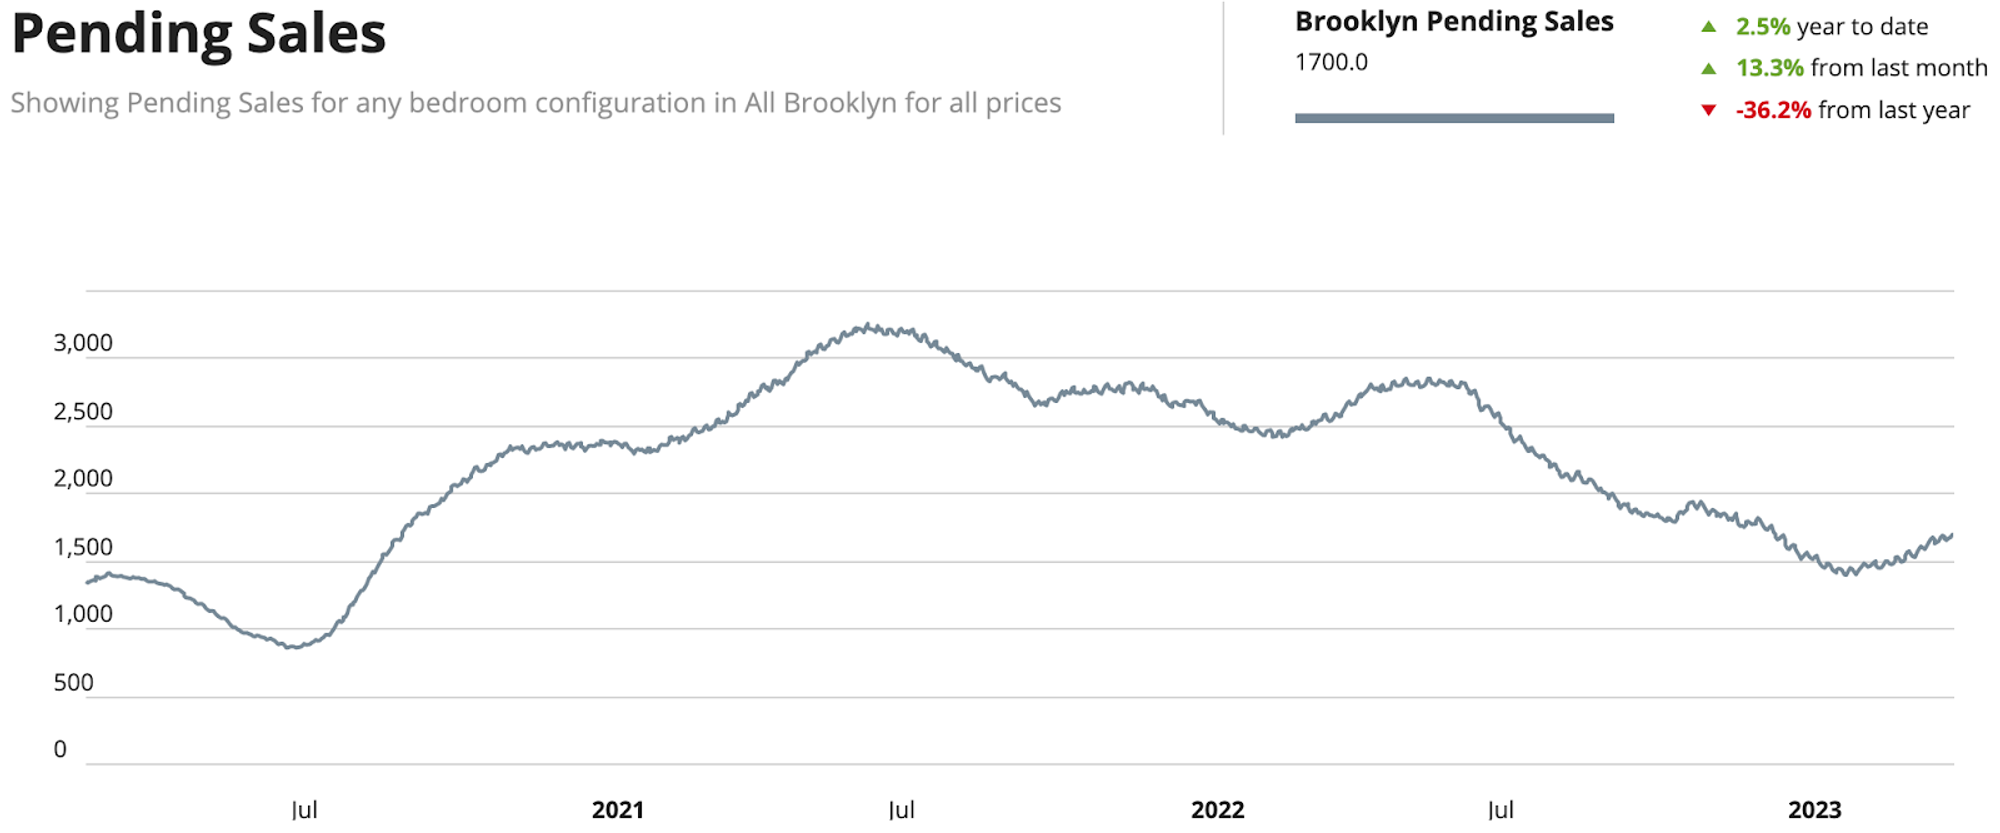
Chart Courtesy of UrbanDigs
Manhattan Contracts Signed
For the first time in ten weeks, the metric dipped below its pre-pandemic average, with 189 contracts signed. We believe that this is a function of last week’s religious and academic holidays and that demand for the borough will recover next week.

Chart Courtesy of UrbanDigs
Brooklyn Contracts Signed
Brooklyn is peaking yet again. After briefly touching the pre-pandemic average (the average weekly number of signed contracts from Jan 5, 2015, to Mar 1, 2020) in mid-January, which has become the metric’s support level for the past two years, signed contracts have skyrocketed above that average. This week, 134 contracts were signed.

Chart Courtesy of UrbanDigs
New Development Insights
As reported by Marketproof, this week, 85 new development contracts were reported across 44 buildings. The following were the top-selling new developments of the week:
- THE GREENE (Long Island City)
- 300 WEST 30 STREET (Chelsea)