Spring Resurgence
Spring demand typically peaks around the end of March or the beginning of April, and this year followed that script. However, another rise in contract activity over the past two weeks nearly matches the peak from a month ago.
Typically, Summer is much slower than Spring, but a resurgence of demand this late into the season suggests the next few months may show higher-than-expected buyer activity.
It’s certainly worth noting that demand – i.e., the number of weekly contracts signed – has remained above its pre-pandemic average* for 14 consecutive weeks.
*The average weekly number of contracts signed during the period January 5, 2015, to March 1, 2020.
Manhattan Supply is still increasing on its way to the anticipated June peak. This week, supply increased from 7,388 to 7,447 units.
So far this year, Manhattan Supply has followed normal patterns and behavior. The chart below depicts the historical trends of Manhattan Supply, and 2023 is shaping up just like the rest.
In many national markets there is currently a low supply, which is asserting upward pressure on pricing. But, with NYC supply at 7,447 units and demand at 247 contracts, supply is not a factor in increasing the pricing needle.
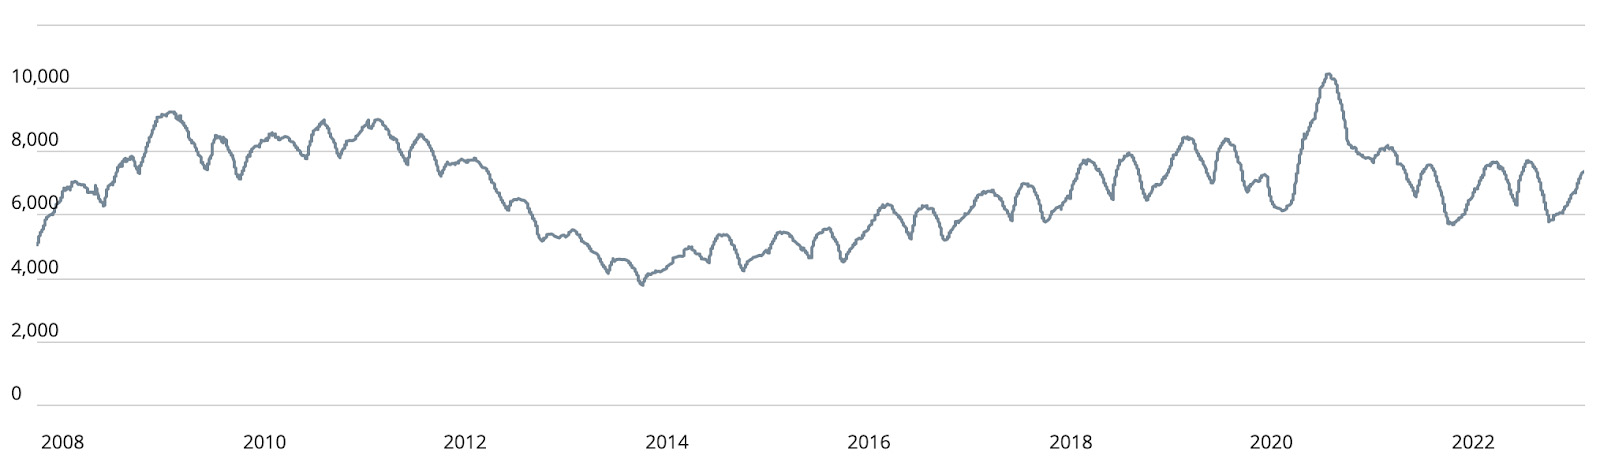
Chart courtesy of UrbanDigs
Brooklyn Supply increased from 3,222 to 3,262 units this week. That number should also grow as the June peak moves closer.
As with Manhattan, the supply and demand ratio alone won’t raise prices, since there are far more units available than the 153 units needed to satisfy this week’s demand.
This week’s data has been added to the chart below and stays on track with Brooklyn’s typical bi-annual cycle. Manhattan’s data set shows a more pronounced cycle than Brooklyn's because it has more historical data to illustrate the trend.
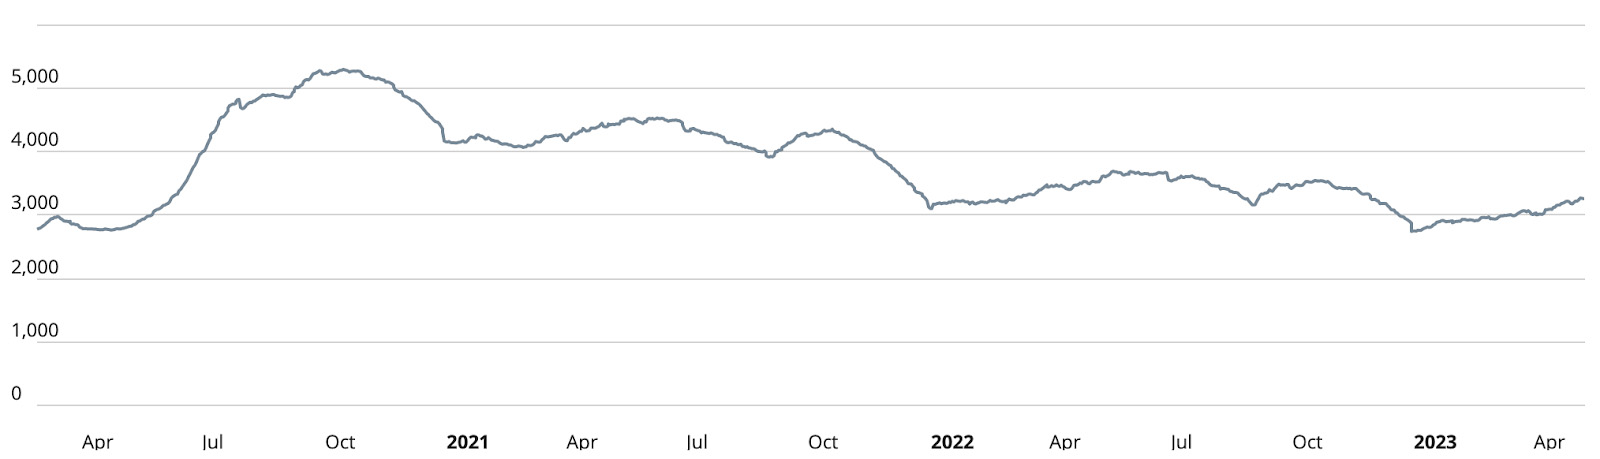
Chart courtesy of UrbanDigs
Manhattan Pending Sales
Like the supply “almanac,” the historical pending sales chart provides us with a very clear picture of what to expect. And as expected, the metric increased week-over-week from 3,011 to 3,059 units. The first and largest peak in June is almost here and if the trend continues, we can expect a smaller peak in December.
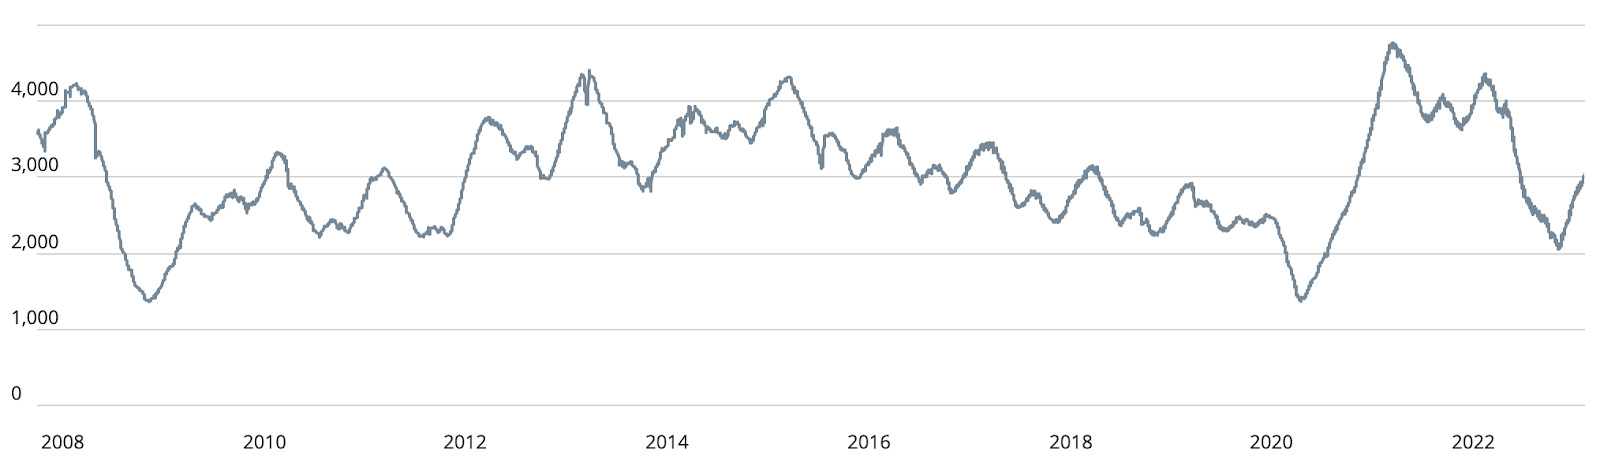
Chart courtesy of UrbanDigs
Brooklyn Pending Sales
The metric reached its seasonal trough in February just like Manhattan, and right on cue, it reversed direction. This week, pending sales increased from 1,908 to 1,921 units, showing that Brooklyn is about to hit its first peak of the year in June — just as expected.
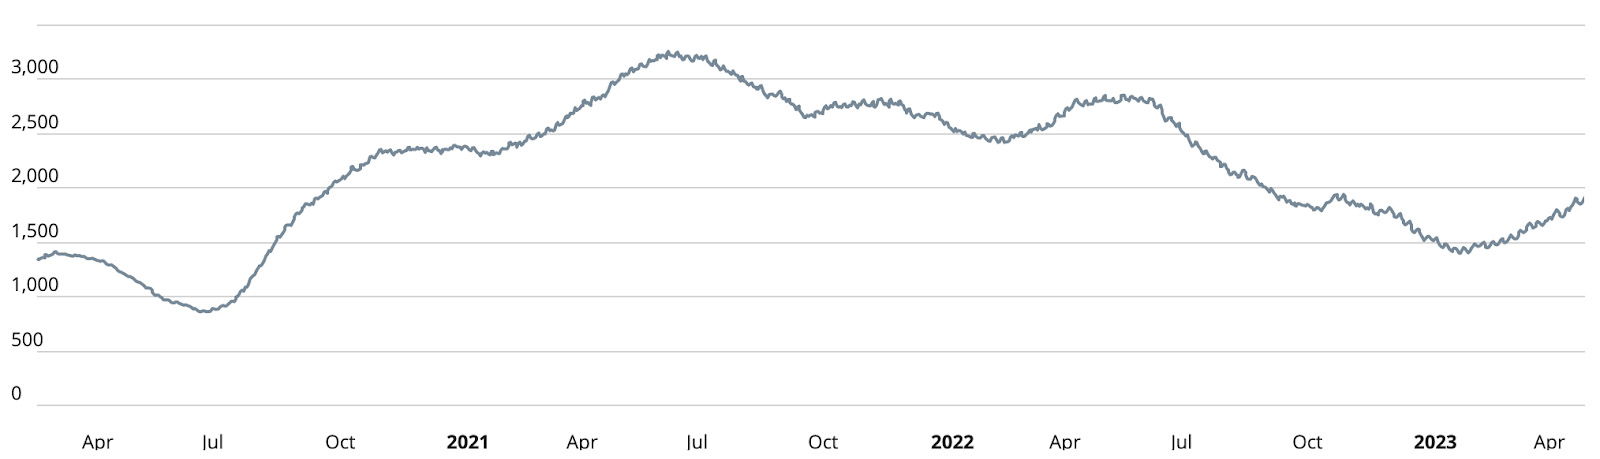
Chart courtesy of UrbanDigs
Manhattan Contracts Signed
At 247 contracts, the metric was once again well above its pre-pandemic average.
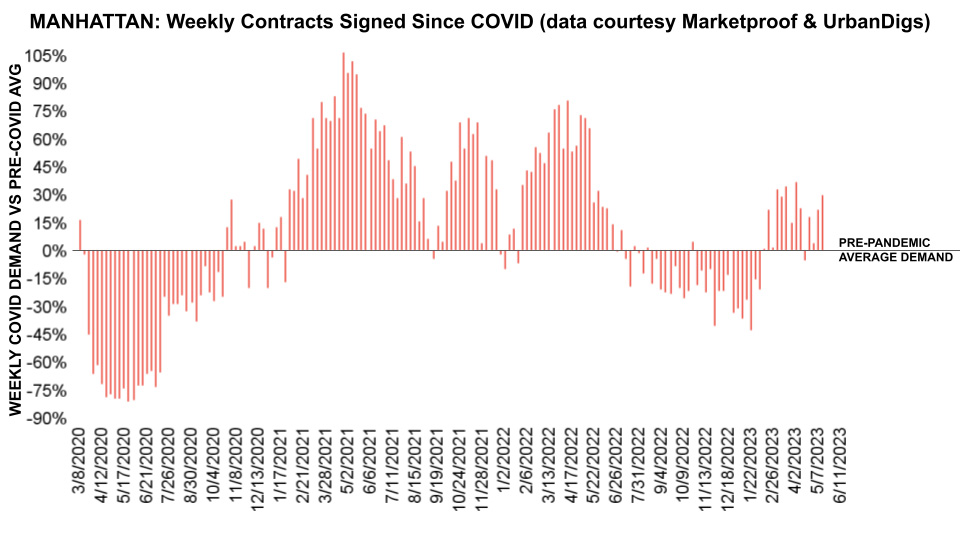
Chart courtesy of UrbanDigs
Brooklyn Contracts Signed
Brooklyn is peaking for the 6th consecutive time since the pandemic. In mid-January, the metric briefly touched the pre-pandemic average, which has become the metric’s support level for more than 2 years. Signed contracts have skyrocketed since then. This week, 153 contracts were signed.
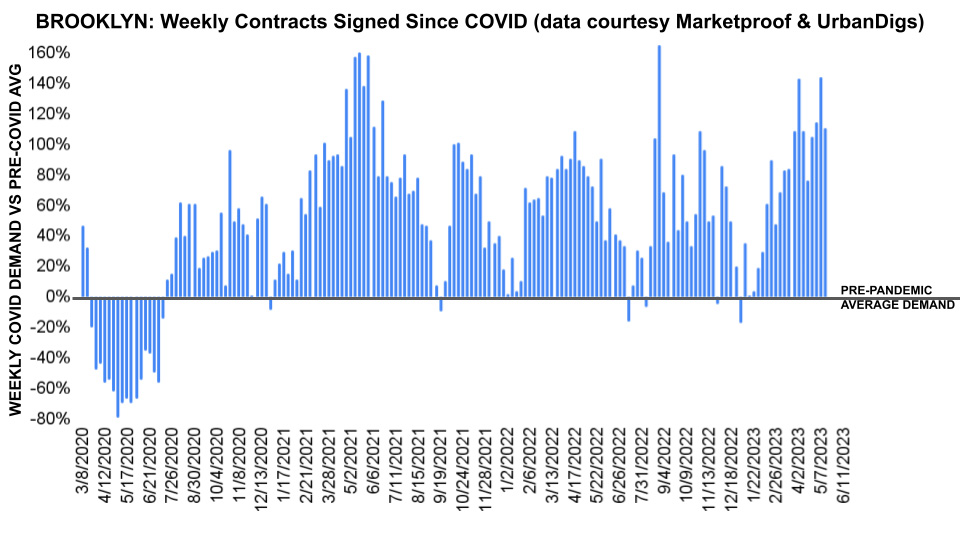
Chart courtesy of UrbanDigs
New Development Insights
As reported by Marketproof, this week, 78 new development contracts were reported across 51 buildings. The following were the top-selling new developments of the week:
- 150 BARROW STREET (West Village) reported 8 contracts.
- ONE HIGH LINE (West Chelsea) reported 5 contracts.