More Gas in the Spring Tank
After watching spring demand wind down following the late March and early April peak, NYC contract volume recorded strong numbers again this week.
Last week, Elegran’s Leverage Indicator suggested that despite a temporary reversal to a seller’s market in March — driven by the strong uptick in demand — both Manhattan and Brooklyn are still buyer’s markets.
Demand is one of the four determinants of our indicator, and a week-over-week increase such as what we see this week certainly pauses some of the transactional leverage that buyers currently hold, at least temporarily.
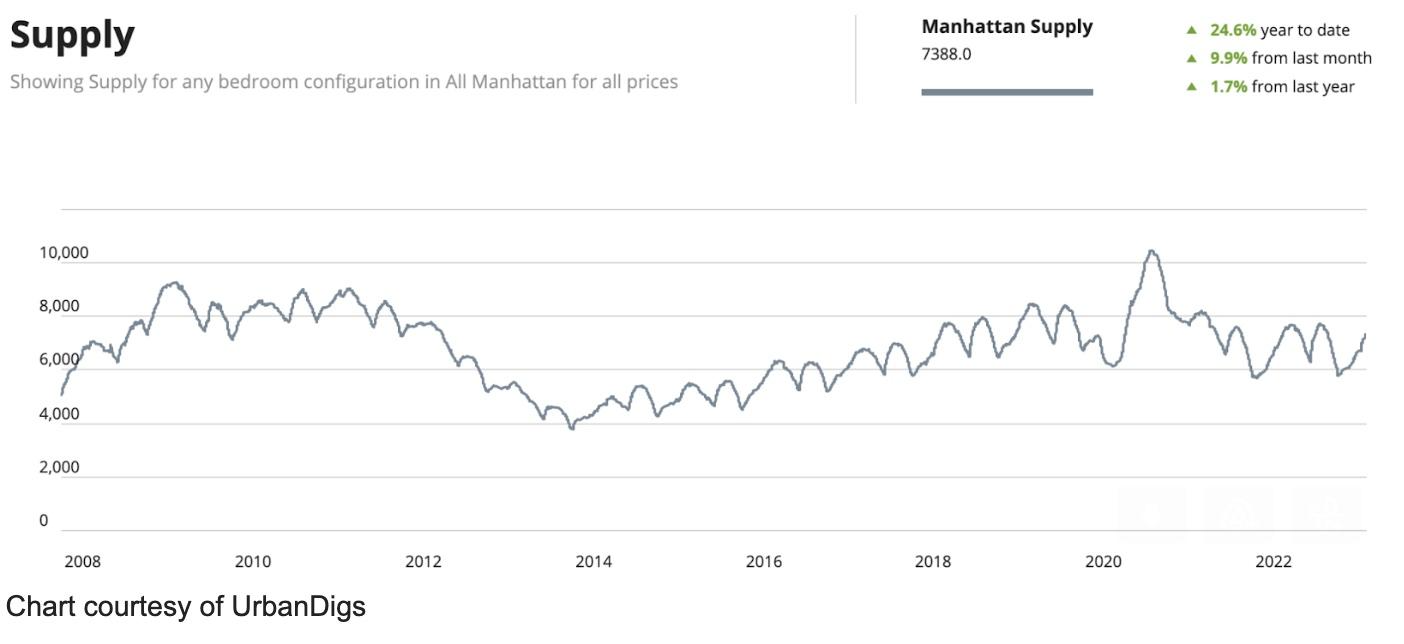
Manhattan Supply
The chart below serves as an almanac, and this year is shaping up like years past. This week, supply increased from 7,273 to 7,388 units, and that number should continue to increase en route to the June peak.
Why is the supply count important? Because low supply, which is currently the case with many national markets, can apply upward pressure on pricing. But, with NYC supply at 7,388 units and demand at 427 contracts, supply is not a factor in increasing the pricing needle.
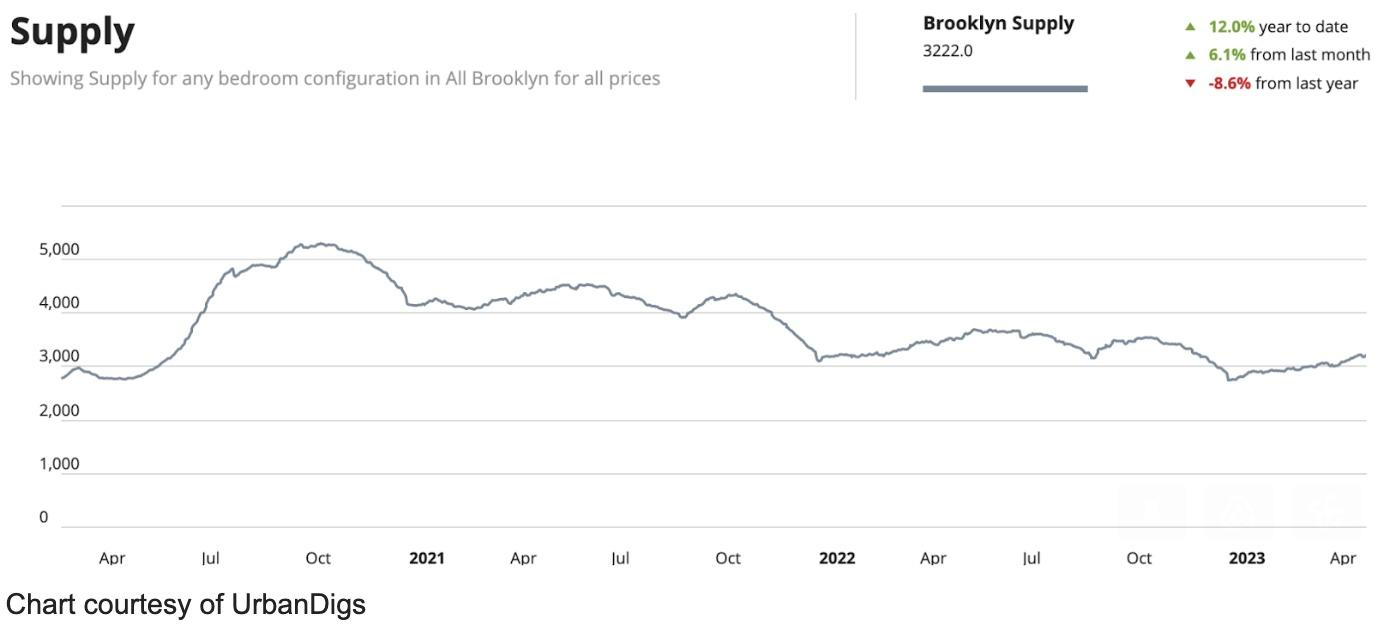
Brooklyn Supply
Brooklyn’s supply also exhibits a bi-annual cycle, though it’s not as apparent without Manhattan’s depth of historical data to illustrate the trend. This week, supply increased to 3,222 units, and that number should continue to increase as we head toward the June peak.
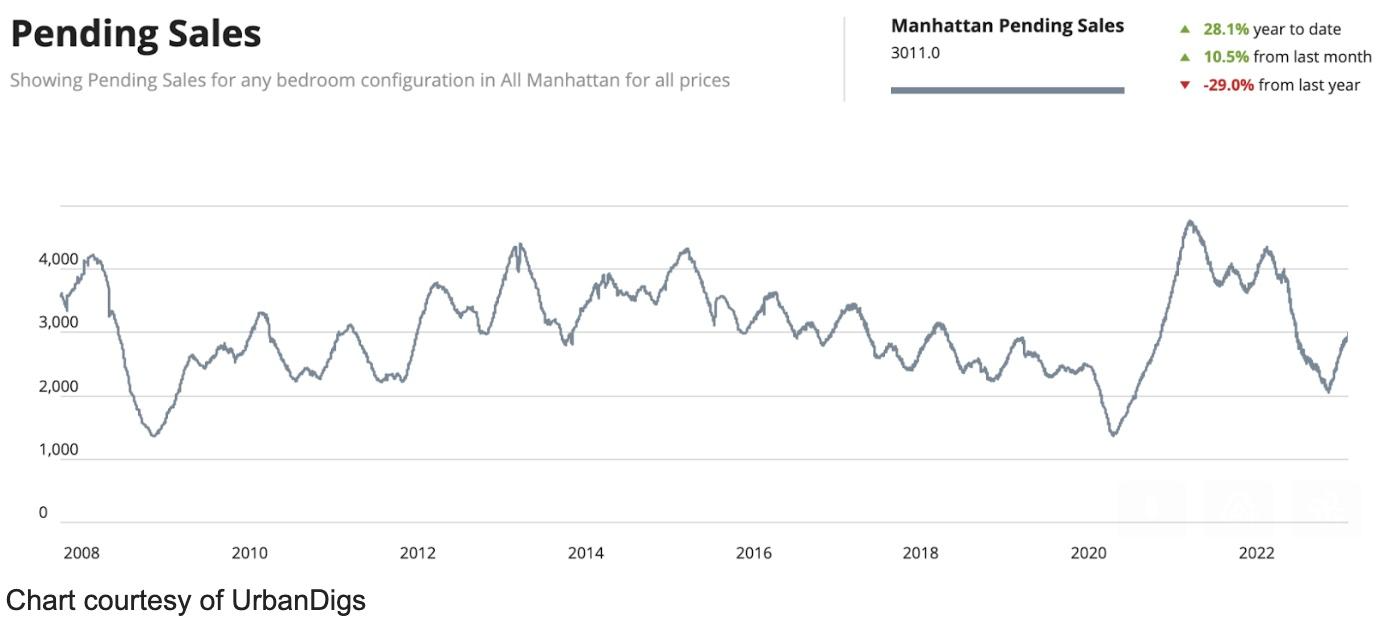
Manhattan Pending Sales
Like the supply “almanac,” the historical pending sales chart gives us a very clear picture of what to expect. Any deviation from the large peak in June and the smaller peak in December would certainly qualify as “news” and be reported. As expected, the metric increased week over week from 2,932 units to 3,011 as the borough headed toward its first peak.
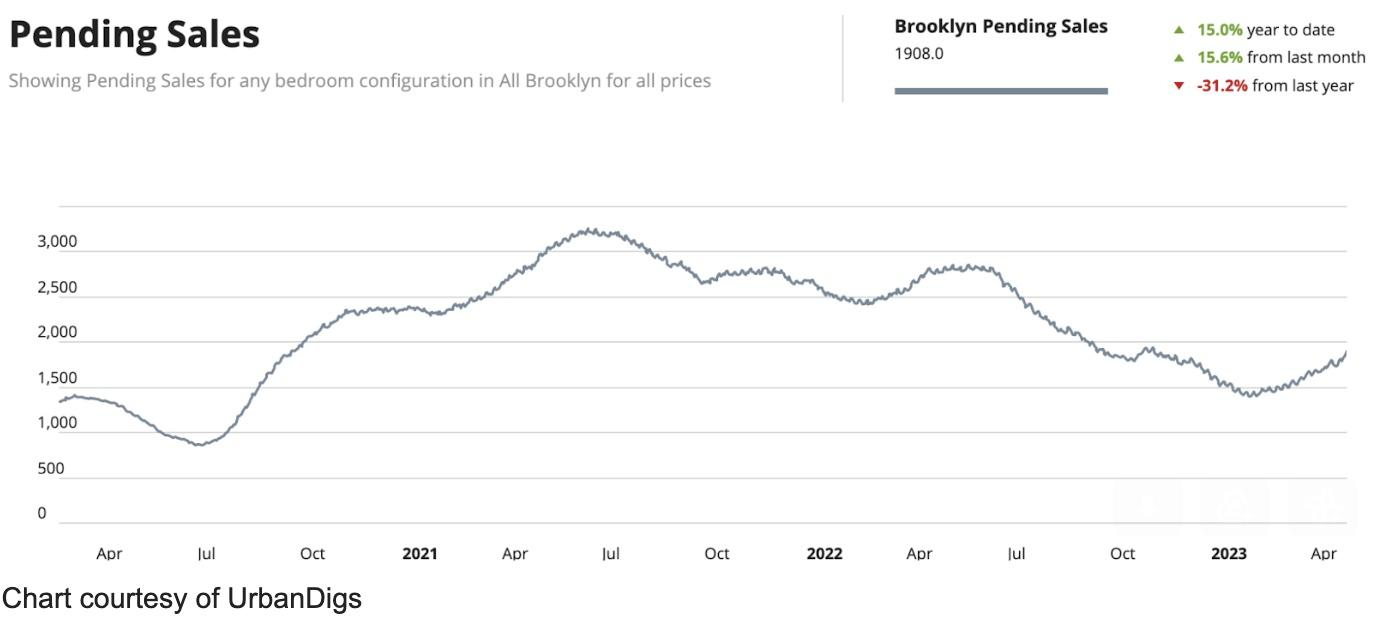
Brooklyn Pending Sales
This week’s observation is the same as what we witnessed in Manhattan where, right on cue, the metric reached its seasonal February trough and then reversed direction. We can also predict that the first of two peaks this year should occur in June. This week, pending sales increased from 1,802 to 1,908 units.
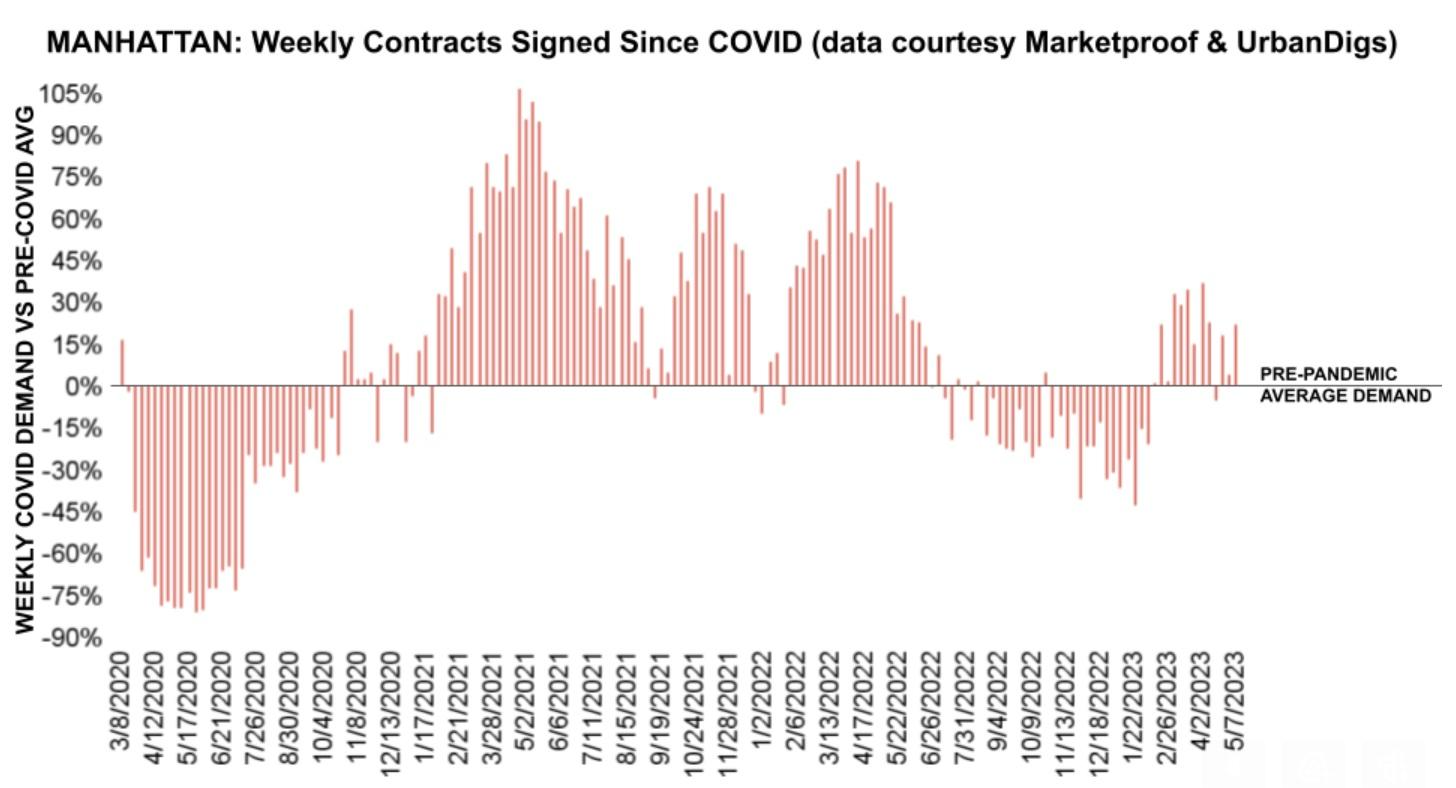
Manhattan Contracts Signed
At 245 contracts, the metric was once again well above its *pre-pandemic benchmark.
* (The average weekly number of signed contracts from Jan 5, 2015, to Mar 1, 2020)
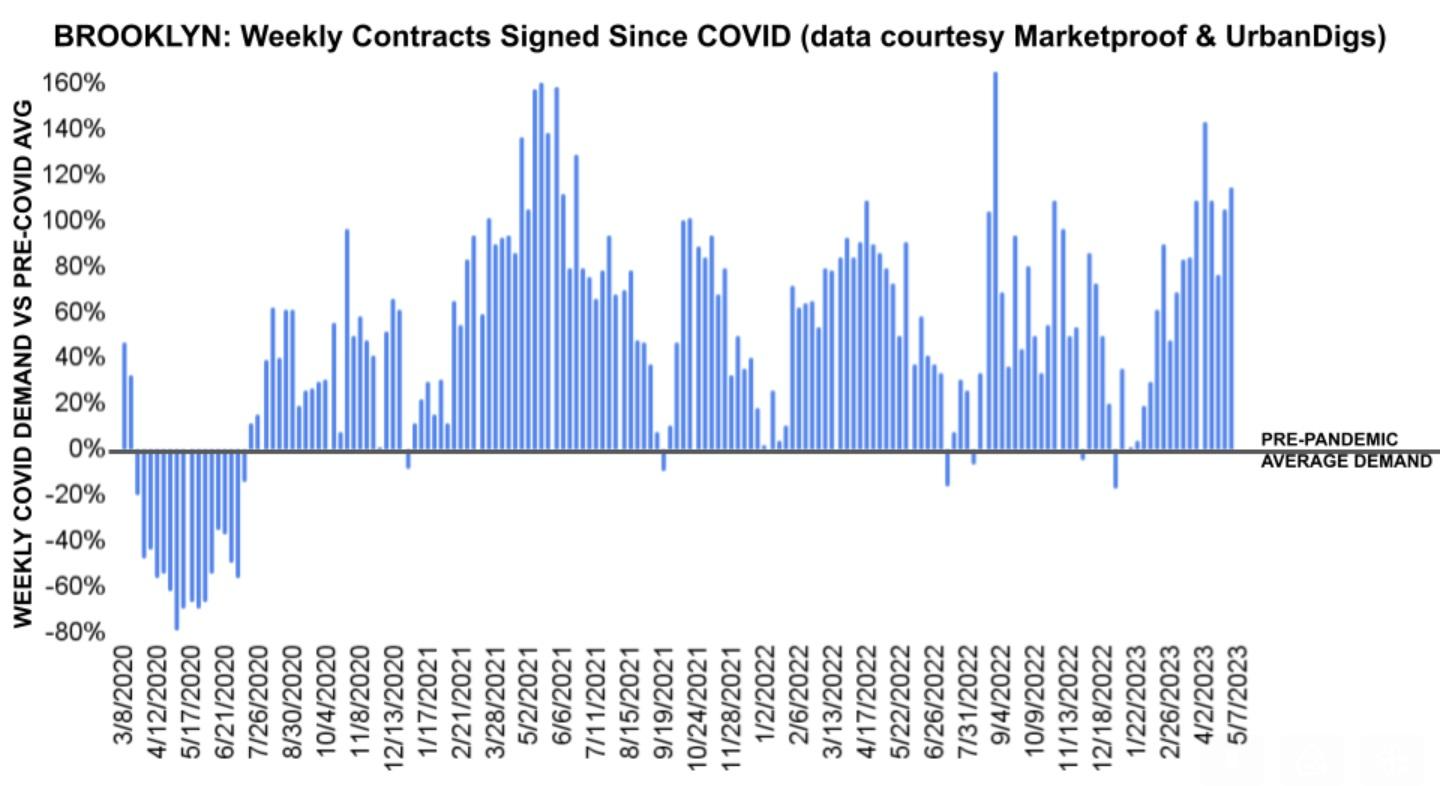
Brooklyn Contracts Signed
Brooklyn is peaking once again since the pandemic. In mid-January, the metric briefly touched the *pre-pandemic average, which has become the metric’s support level for more than two years. Since then, however, signed contracts have skyrocketed. This week, 182 contracts were signed.
* (The average weekly number of signed contracts from Jan 5, 2015, to Mar 1, 2020)
New Development Insights
As reported by Marketproof, this week, 68 new development contracts were reported across 47 buildings. The following were the top-selling new developments of the week:
- THE NEWKIRK (Flatbush)
- 200 AMSTERDAM AVENUE (Lincoln Square)