
Mortgage Rate Hits 21-Year High, Yet Consumer Sentiment Rises
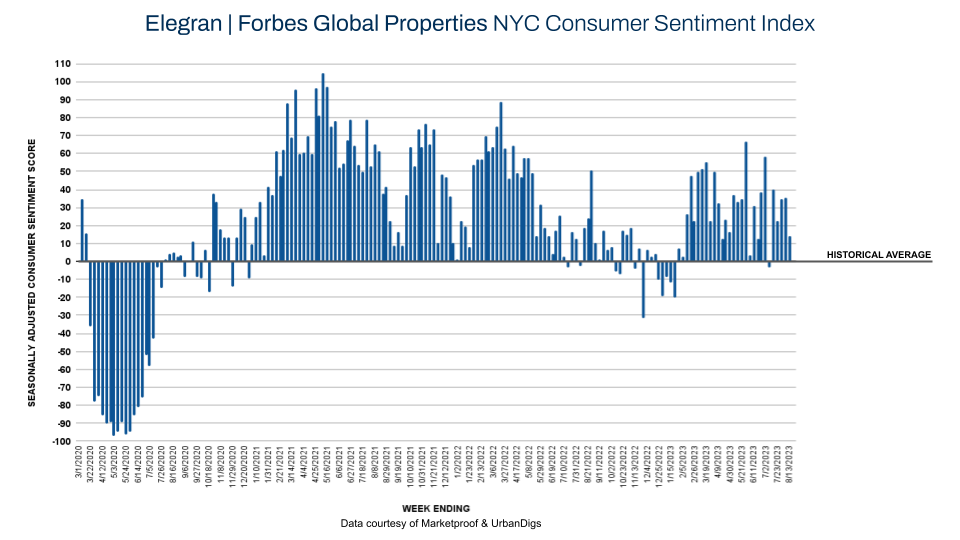
We’re 33 weeks into 2023, and for 29 of them, the Elegran | Forbes Global Properties NYC Consumer Sentiment Index (below) has been positive, increasing from +14 last week to +23 this week. This means that the attitude toward NYC residential real estate is 23% stronger than during the pre-pandemic period.
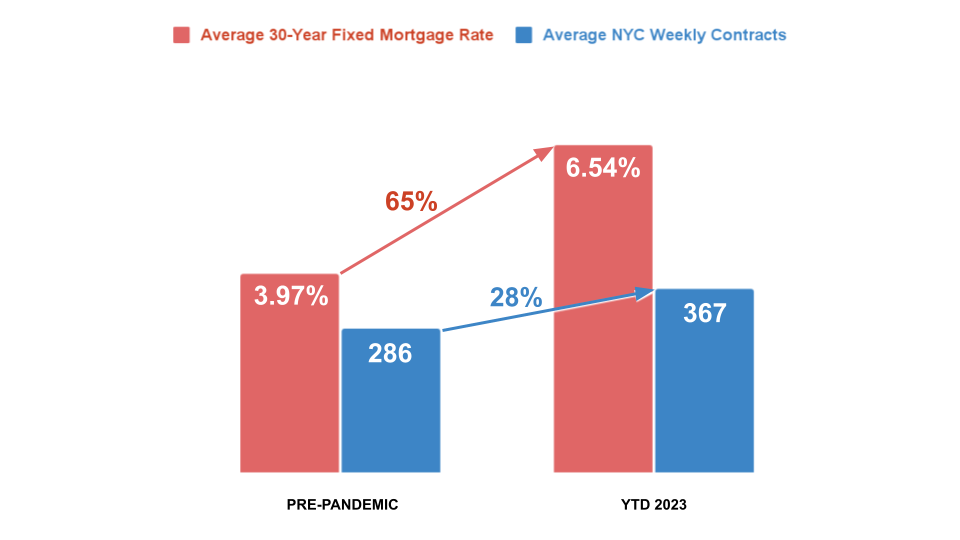
During that same historical period, the 30-year fixed mortgage rate national average was 3.97% but has since increased by 65% to an average of 6.54% this year. But under the pressure of rising rates, demand for NYC has increased 28%, from an average of 286 weekly contracts to 367, defying economics. HERE to read a just-published standalone Elegran Insights piece]
Manhattan Supply
This week, as expected, supply decreased from 6,427 to 6,312 units, on its way toward a low point next month. Why is the supply count important? Because low supply – such as is currently the case with many national markets – can assert upward pricing pressure. But with supply at 6,312 units and a maximum weekly demand of 400 contracts, supply should not be a factor in increasing the pricing needle.
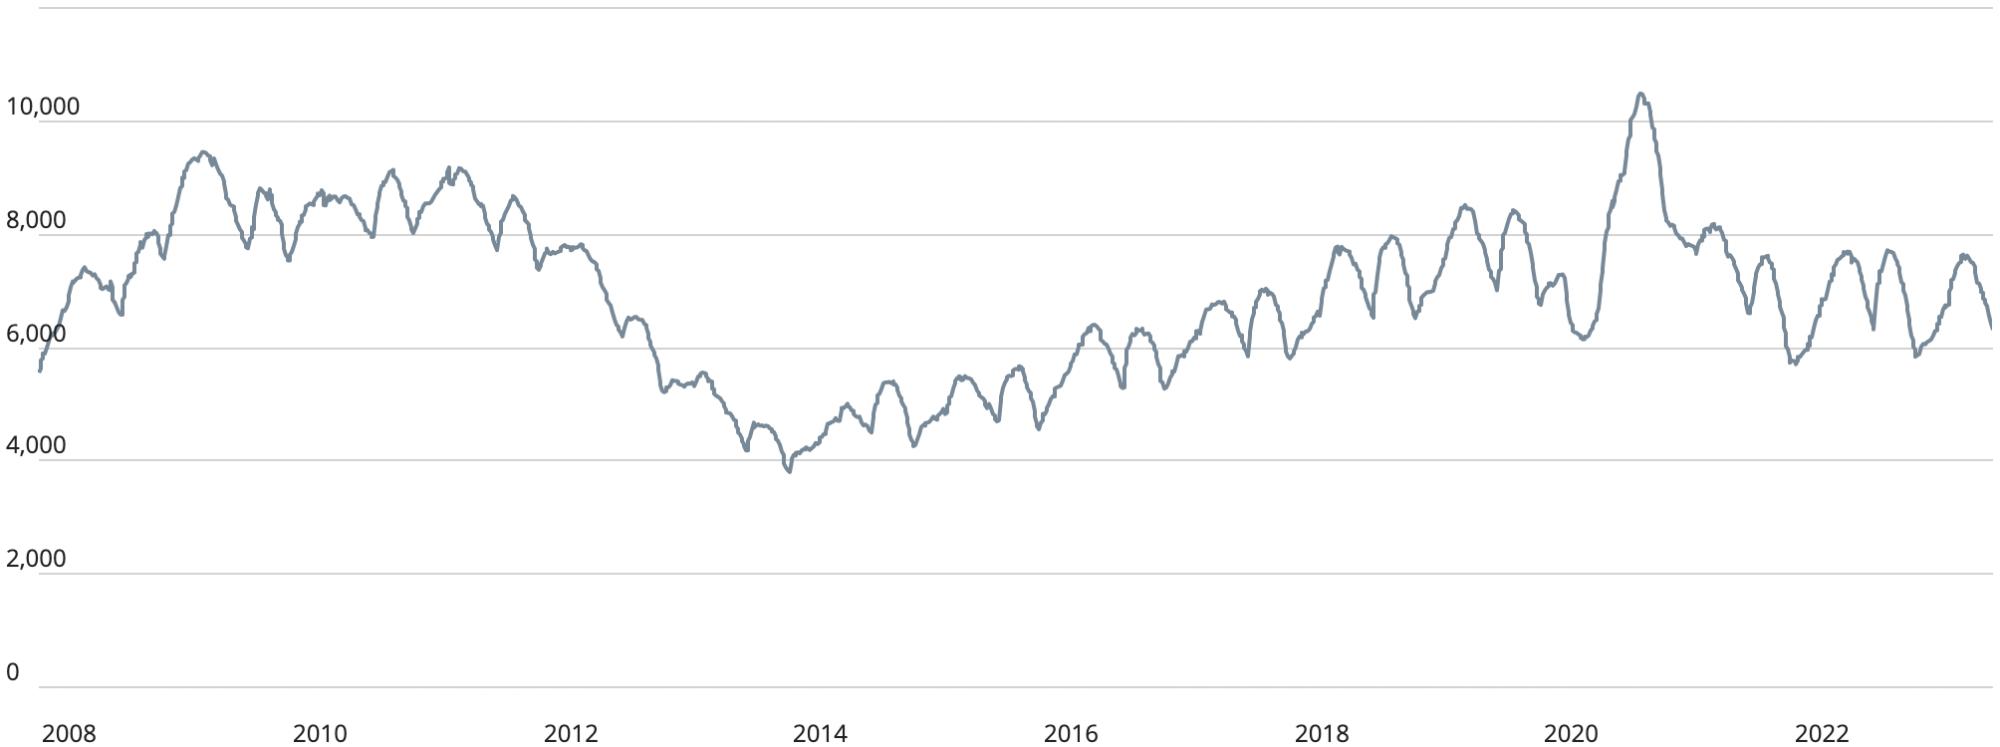
Manhattan Supply | Chart courtesy of UrbanDigs
Brooklyn Supply
The supply in this borough also exhibits a bi-annual cycle, although it is not as apparent without Manhattan’s depth of historical data to illustrate the trend. This week, supply decreased from 3,145 to 3,087 units as it heads toward a trough next month. The supply-demand ratio alone should not raise prices since there are far more units available than what’s needed to satisfy a maximum weekly demand of 200 units.
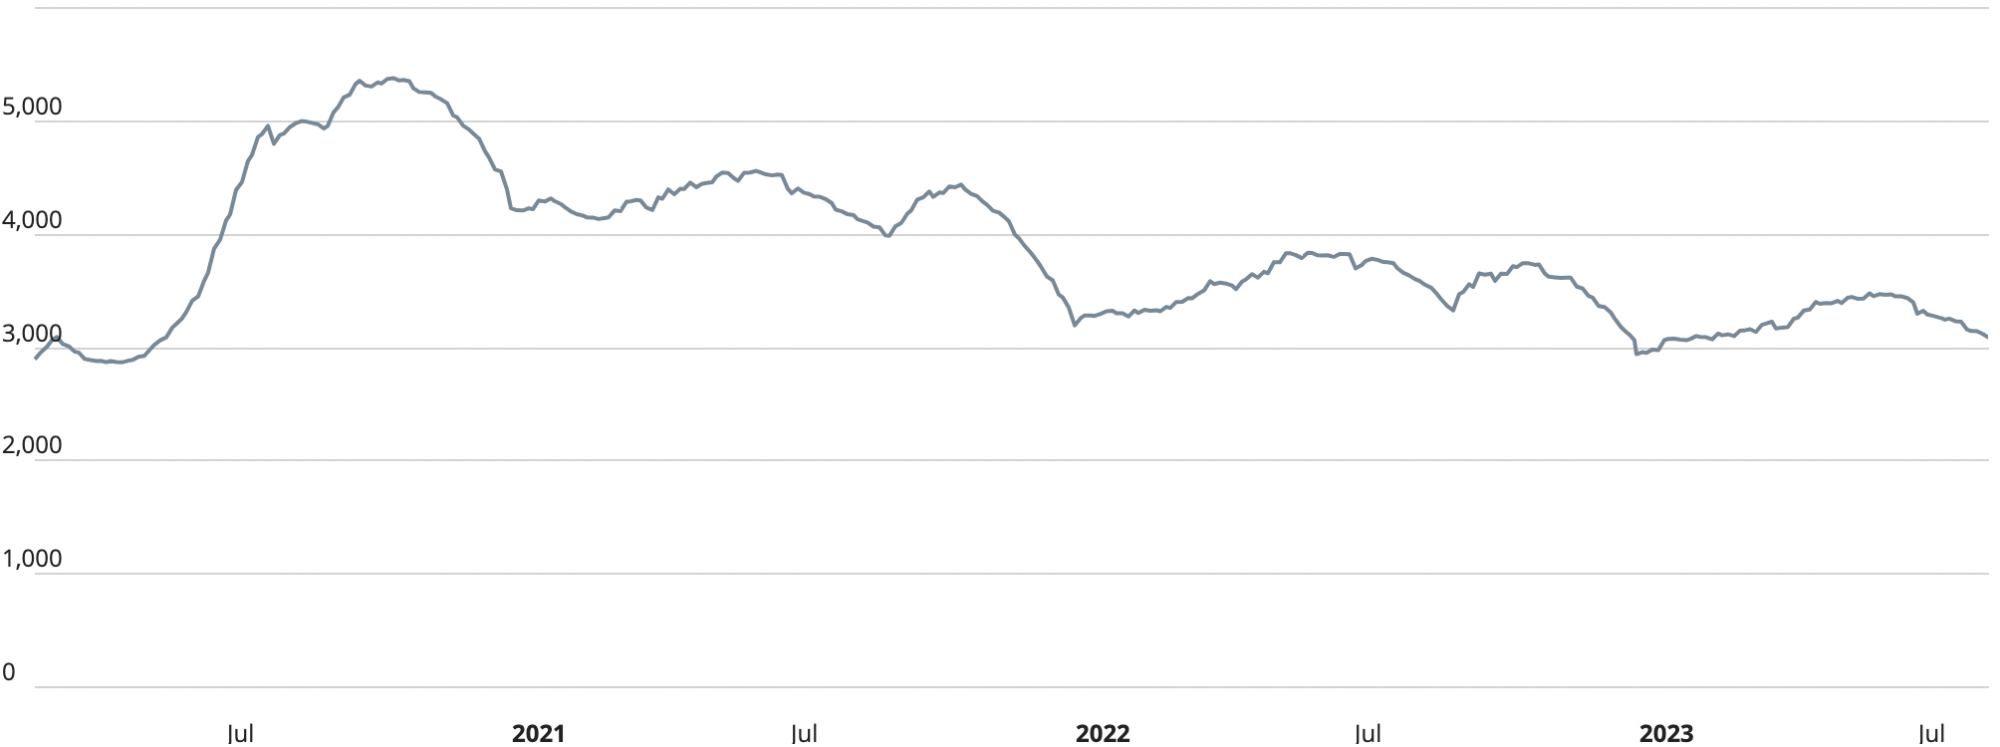
Brooklyn Supply | Chart courtesy of UrbanDigs
Manhattan Pending Sales
Like the supply “almanac,” the historical pending sales chart provides a clear picture of what to expect, with the first of two annual peaks typically occurring in June. Although the metric increased slightly this week from 2,979 to 2,989 units, it has been trending down and should trough in October.
Brooklyn Pending Sales
Like Manhattan, pending sales in Brooklyn recently reached the first of two annual peaks. Although the metric increased slightly from 2,032 to 2,059 units this week, it has been trending lower and should decline through October.
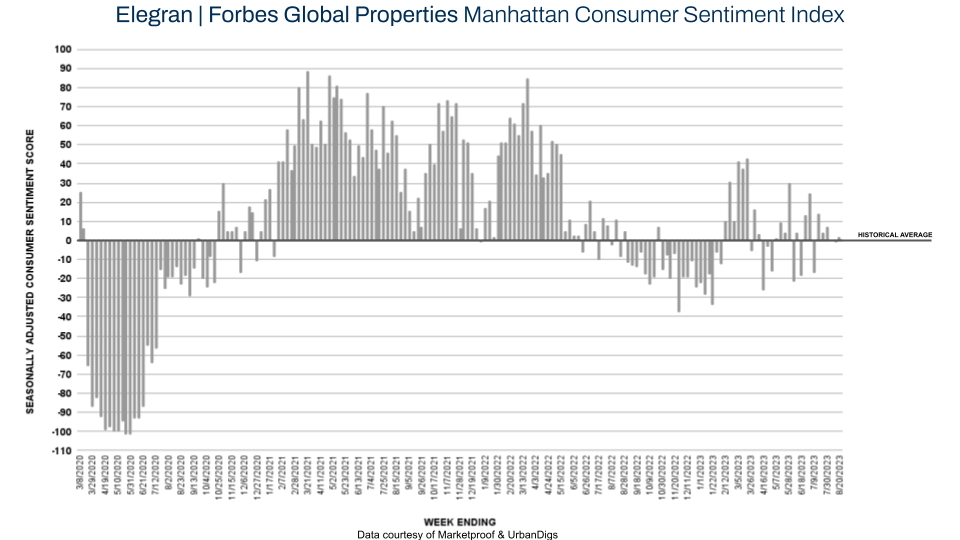
Manhattan Consumer Sentiment
This week, the Elegran | Forbes Global Properties Manhattan Consumer Sentiment Index (below) registered a Consumer Sentiment Score of +2, slightly higher than last week’s score of -1. The score, a measurement of the attitude toward Manhattan residential real estate, has been mixed all year and, lately, has been at or near parity with its seasonally adjusted pre-pandemic average. 185 contracts were signed this week compared to 181 last week.
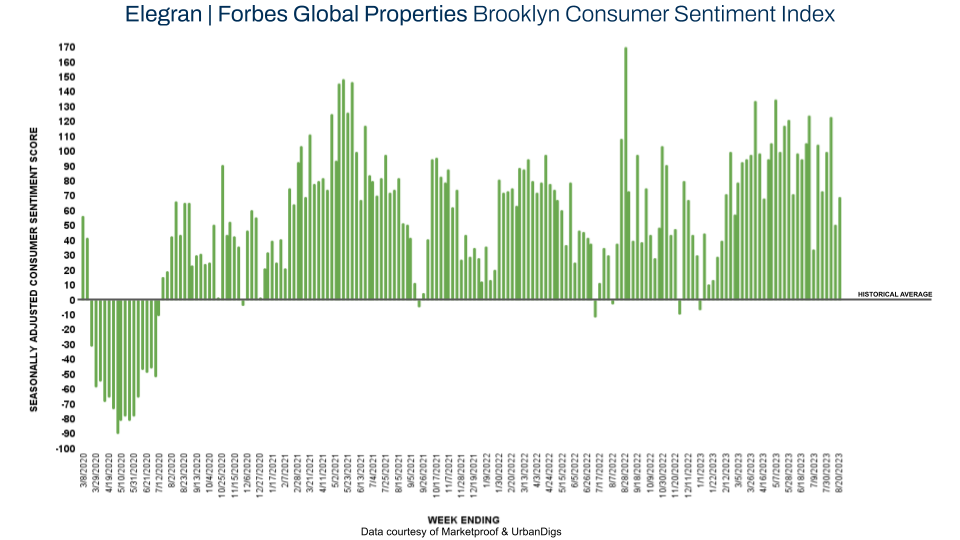
Brooklyn Consumer Sentiment
This week, the Elegran | Forbes Global Properties Brooklyn Consumer Sentiment Index (below) registered a Consumer Sentiment Score of +69, up from +51 last week. This means consumer sentiment is currently 69% greater than its seasonally adjusted pre-pandemic average and has been stronger than that historical average since July 2020. 126 contracts were signed this week versus 117 contracts last week.
New Development Insights
As reported by Marketproof, this week, 58 new development contracts were reported across 41 buildings. The following was the top-selling new developments of the week:
- THE GREENE (Long Island City) and 50-07 5TH STREET (Hunter’s Point) both reported 4 contracts.