Brooklyn Market Pulse ¹ August 2026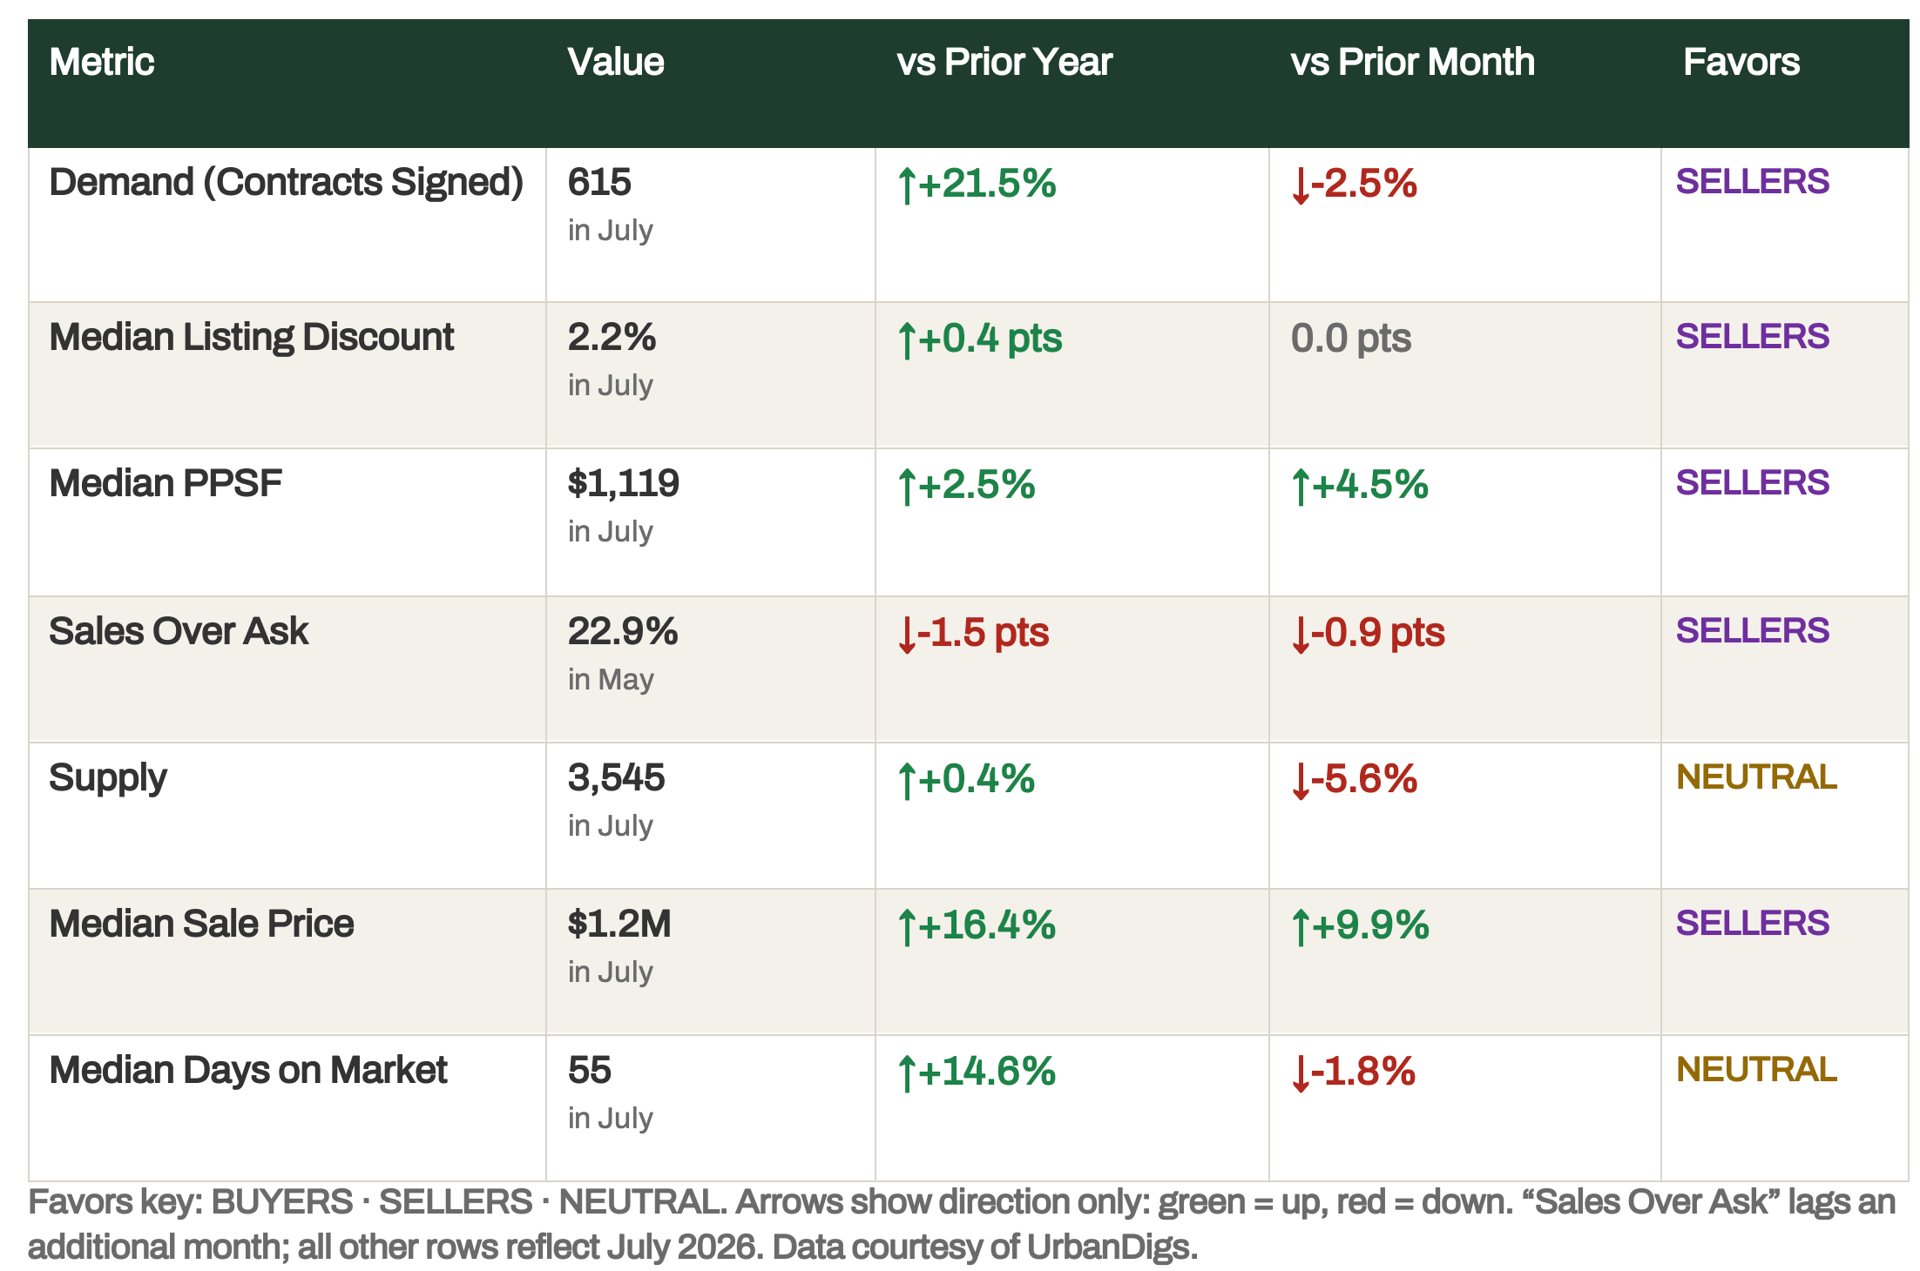
Demand Runs 21.5% Ahead as the Median Jumps to $1.2M
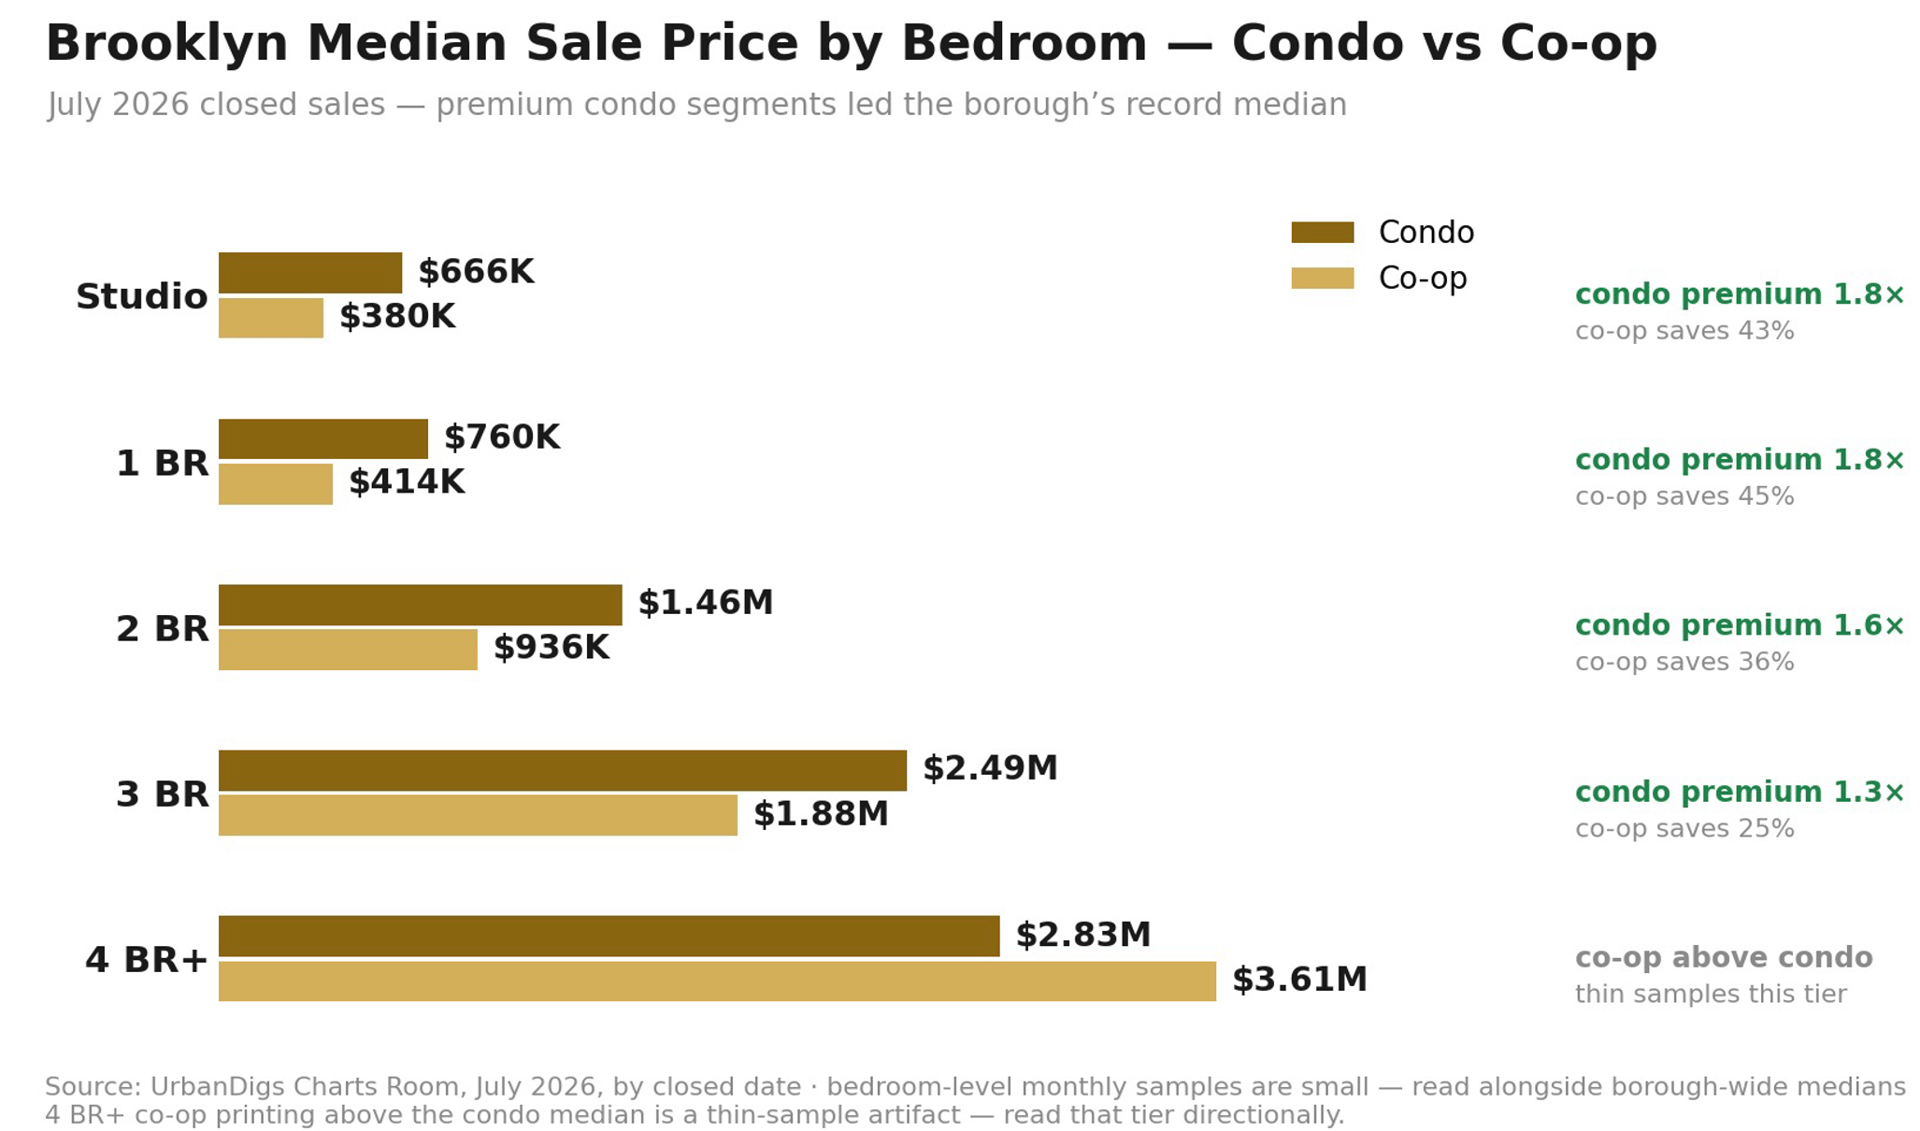
Brooklyn’s July was the opposite of quiet. Signed contracts reached 615, down just 2.5% from June in a month that usually fades, and 21.5% above last July, the strongest annual demand reading of 2026 in either borough. Pricing followed: the median sale price jumped 9.9% from June to $1.2M, up 16.4% year-over-year, with median PPSF setting a 2026 high at $1,119 (+4.5% MoM). A heavier mix of premium closings did part of that work, condo 2BR and 3BR medians printed +21% and +24% YoY, so read the headline median as strength with a mix assist rather than pure like-for-like appreciation.
Bottom line: Brooklyn enters late summer with demand running well ahead of the seasonal script, supply back to flat versus last year, and the listing discount at 2.2%. The buyer opening that rising inventory created this spring has nearly closed.
Market Snapshot: Five Numbers That Matter
• 615 contracts signed in July, down just 2.5% from June and up 21.5% year-over-year. The summer slowdown largely skipped Brooklyn.
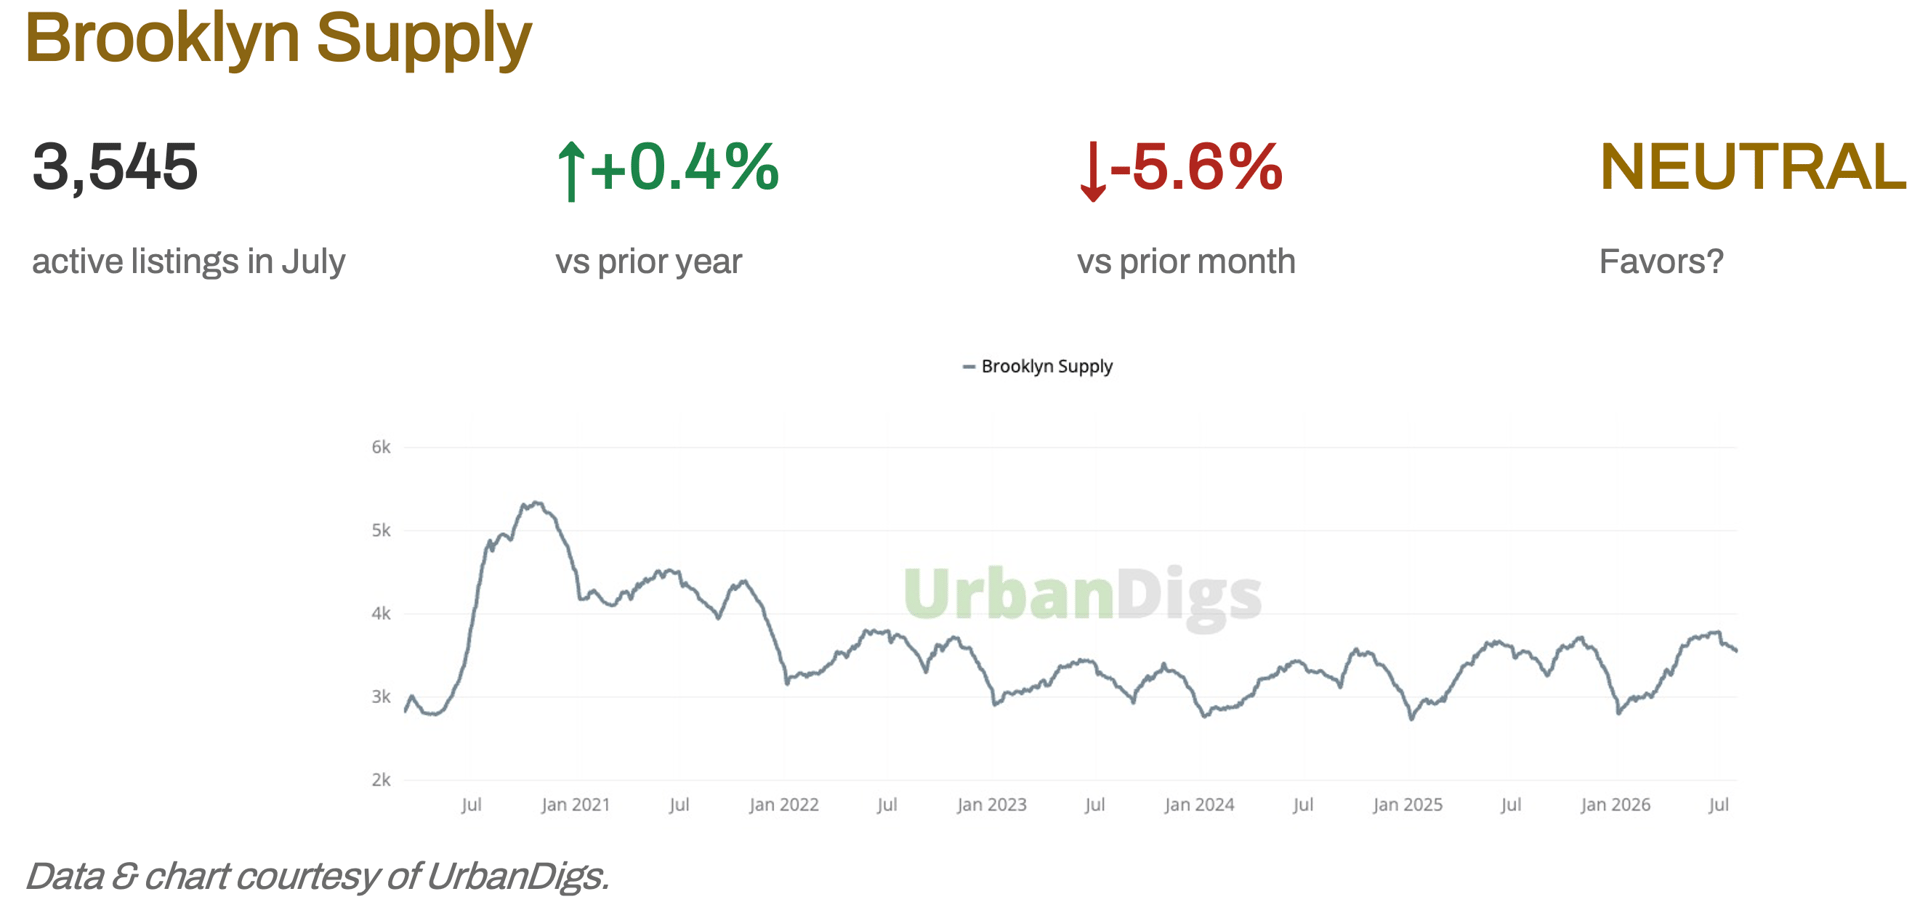
• 3,545 active listings, down 5.6% from June and now just 0.4% above last year: the spring inventory opening has nearly closed.
• $1,119 median price per square foot, up 4.5% from June and 2.5% year-over-year, a fresh 2026 high.
• 2.2% median listing discount, flat from June and still the tightest reading tracked in either borough this year.
• $1.2M median sale price, up 9.9% from June and 16.4% year-over-year, the largest annual gain of this report’s 2026 run, flattered by a premium-heavy mix.
Key Takeaways
• Demand defied the season: 615 contracts, up 21.5% YoY against a 2.5% monthly dip, while pending sales rose 8.2% to 2,427 (+18% YoY) and the liquidity pace runs 26.4% ahead of last year.
• The supply divergence from Manhattan is closing: 3,545 listings, down 5.6% MoM and just +0.4% YoY, Brooklyn’s inventory advantage for buyers has thinned to a rounding error.
• Median sale price jumped to $1.2M (+16.4% YoY), the strongest print of the year, flattered by premium mix (condo 2BR +21%, 3BR +24% YoY). PPSF at +2.5% YoY is the cleaner appreciation read.
• The listing discount held at 2.2%, flat from June and a tenth of a point wider than an unusually tight July 2025; 22.9% of May sales closed above ask.
• Months of inventory fell to 3.9, demand is absorbing what supply there is faster than a year ago.
• Days on market at 55 improved 1.8% from June but sits 14.6% above last July, the annual comparison still shows a slower market than last summer.
• A data caveat worth flagging: recorded closed-sale counts (189, –76.8% MoM) reflect public-record recording lag on the most recent month, not a genuine activity collapse.
Outlook
Brooklyn’s two-sided spring has resolved toward sellers: demand is running a fifth ahead of last year, inventory is back to flat, and the discount sits at cycle lows. The next test is September supply, Brooklyn buyers need a listing wave to regain meaningful leverage.
■ For Sellers: This is the strongest combined signal of 2026: demand +21.5% YoY, a 2.2% discount, and per-foot pricing at a high. Well-priced listings are clearing fast, and premium product is driving headline prices.
■ For Buyers: The inventory edge Brooklyn offered in spring has largely closed. Negotiating room now concentrates in listings sitting 45+ days and in the larger co-op segment; elsewhere, expect to compete near ask.

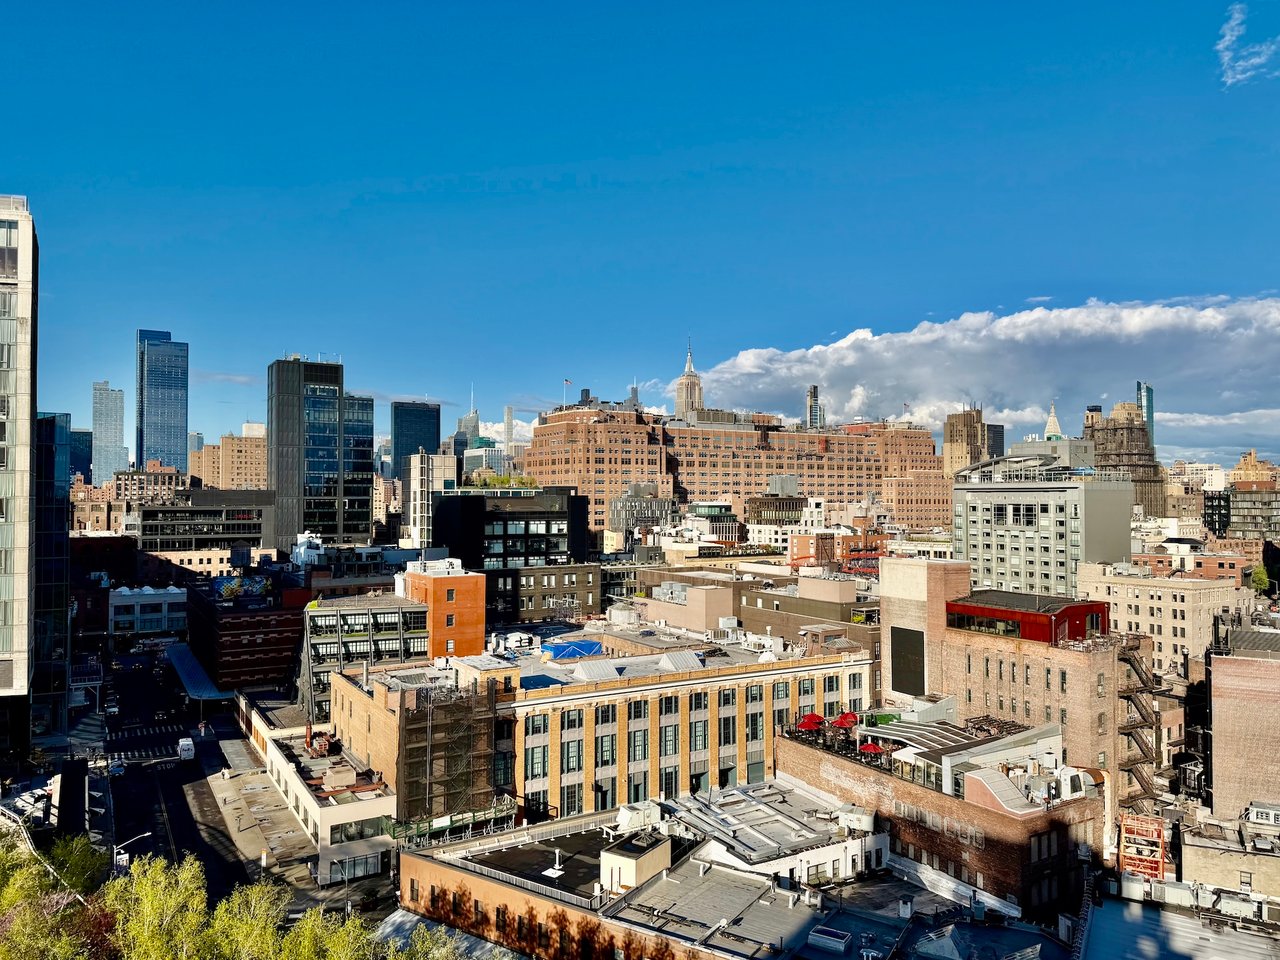
Photo by Rihards Gederts | Howard Hanna NYC
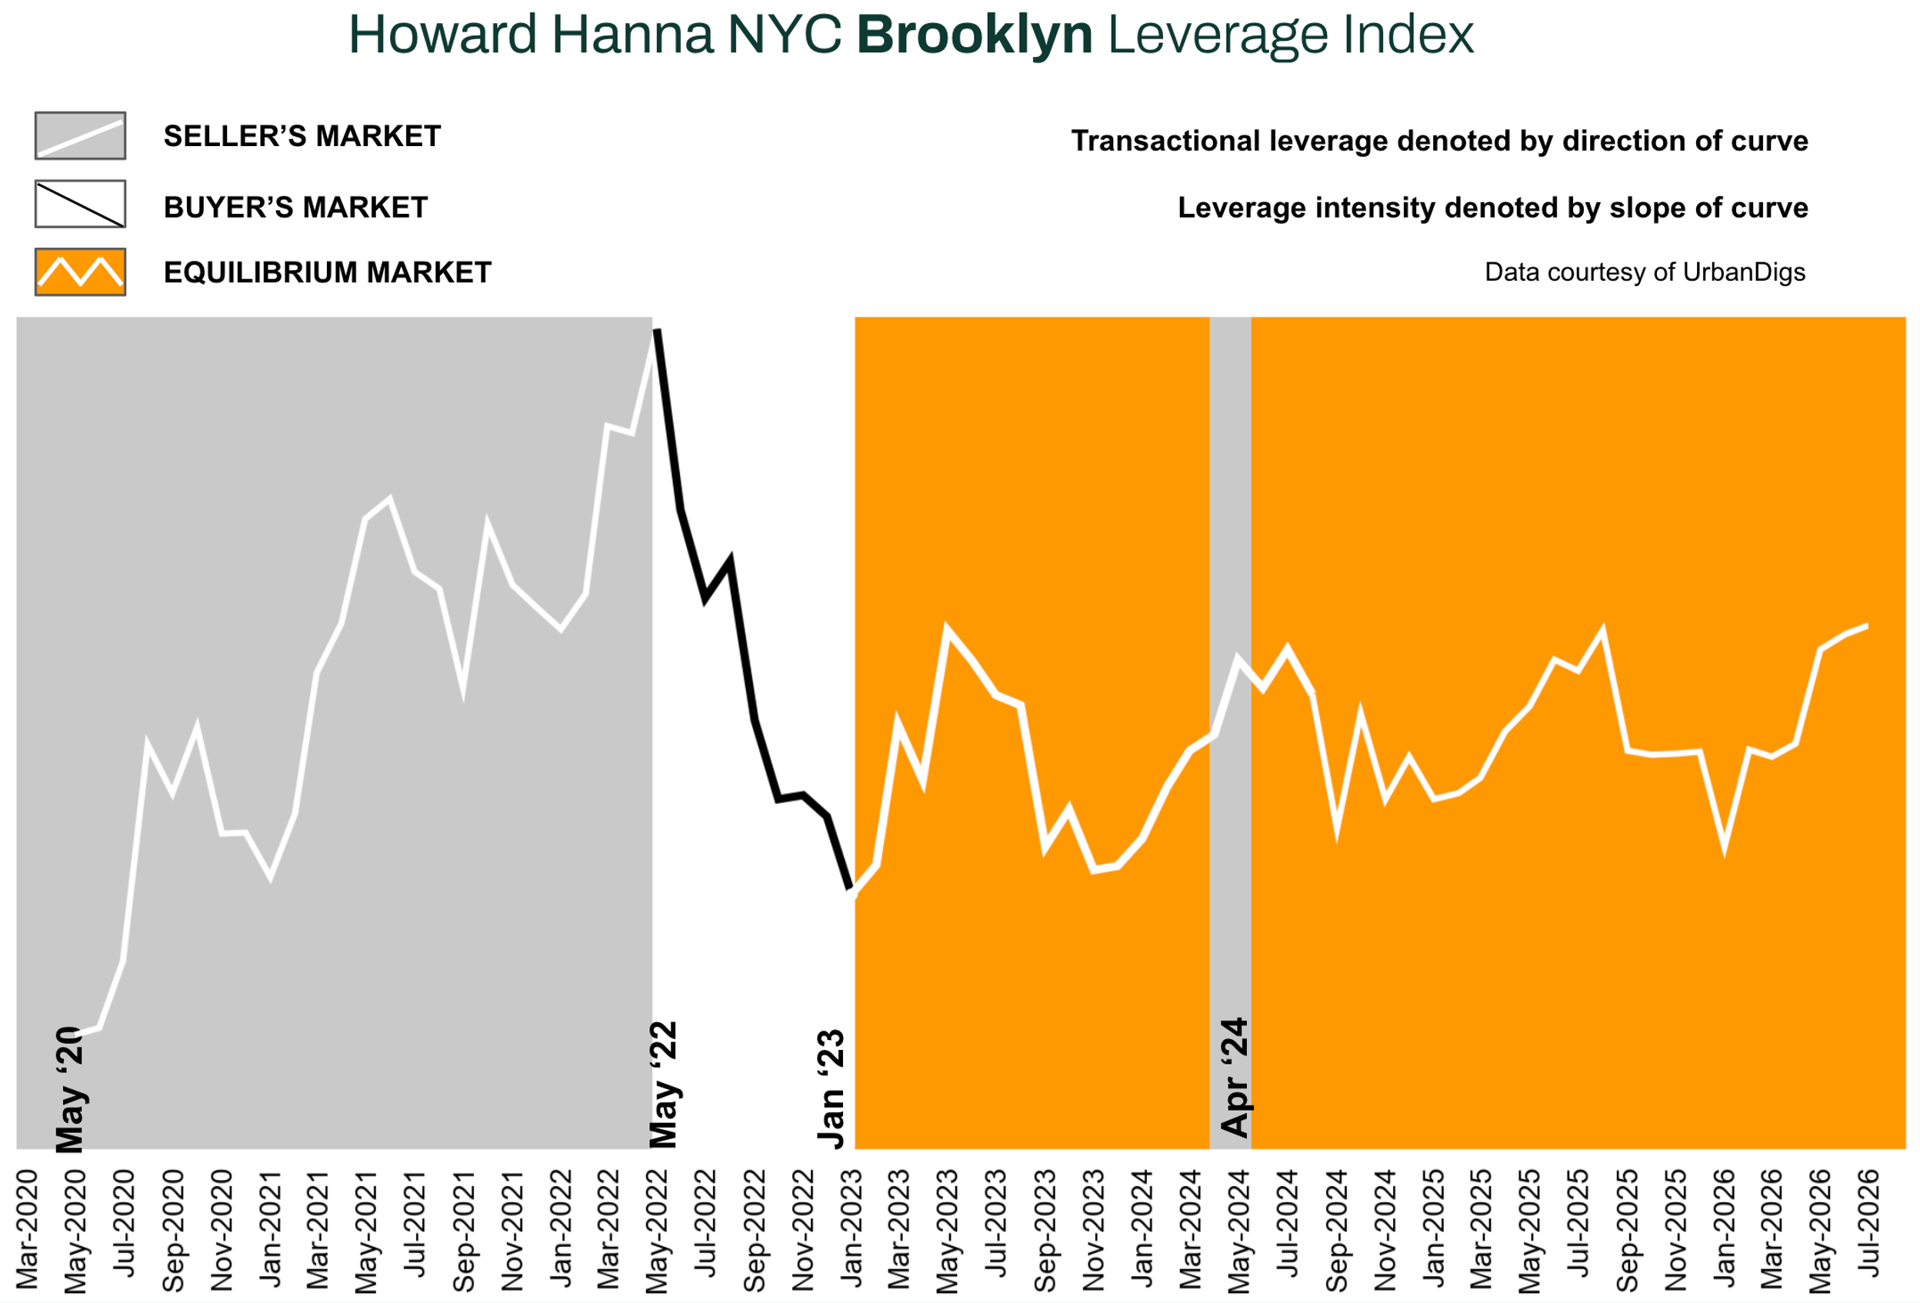
Howard Hanna NYC Brooklyn Leverage Index
The Howard Hanna NYC Brooklyn Leverage Index tracks four market signals, supply, demand, median PPSF, and median listing discount, to gauge the balance of power between buyers and sellers. Tightening supply, accelerating demand, firming PPSF, and compressing discounts all point toward sellers; the reverse combination points toward buyers.
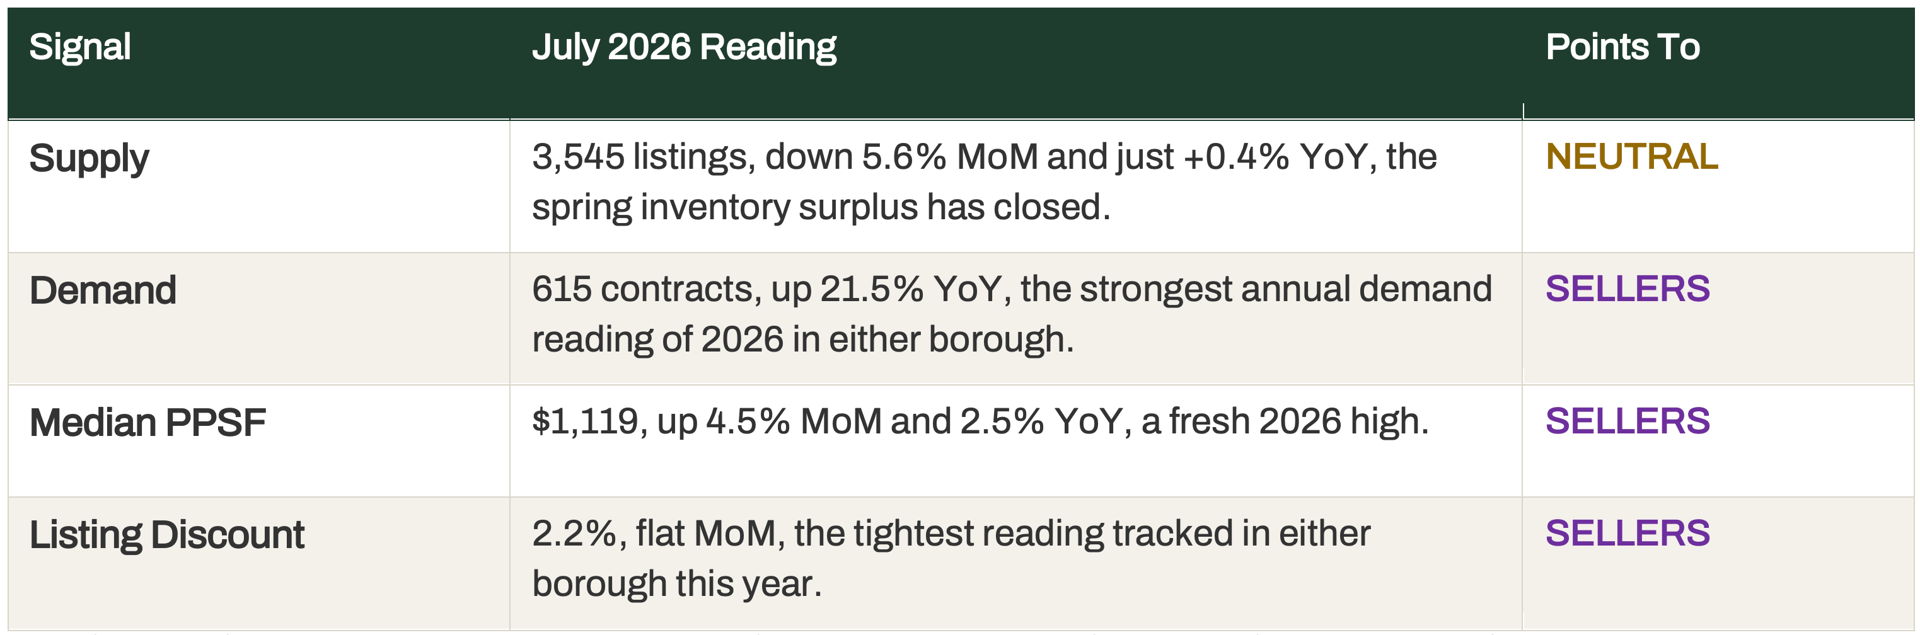
Three of Brooklyn’s four inputs point to sellers in July, and supply has faded to neutral. The index itself eased to 0.26 from June’s 0.34, still far above last winter’s near-zero readings and inside the equilibrium band that has held since early 2023. The trend since January is upward; July’s dip reads as a pause, not a turn. Source: Howard Hanna NYC Leverage Index 2026, data courtesy of UrbanDigs.
Brooklyn Supply
THE INVENTORY OPENING NARROWS TO FLAT
Active Brooklyn listings fell 5.6% from June to 3,545, cutting the year-over-year surplus from +4.2% to just +0.4%. Brooklyn spent the spring as the borough with genuinely more choice than a year ago; that distinction is now effectively gone. The borough recorded a net loss of 297 homes in July as new listings dropped 17.6% from June.
■ Buyers: Still more selection than Manhattan in relative terms, but the absolute edge has thinned. Listings that have sat are where the leverage lives.
■ Sellers: The competitive backdrop just improved, fewer rival listings, and demand running a fifth ahead of last year.
Outlook: If the September wave lands light here as well, Brooklyn heads into fall with supply flat-to-negative year-over-year for the first time since early spring.
Brooklyn Demand
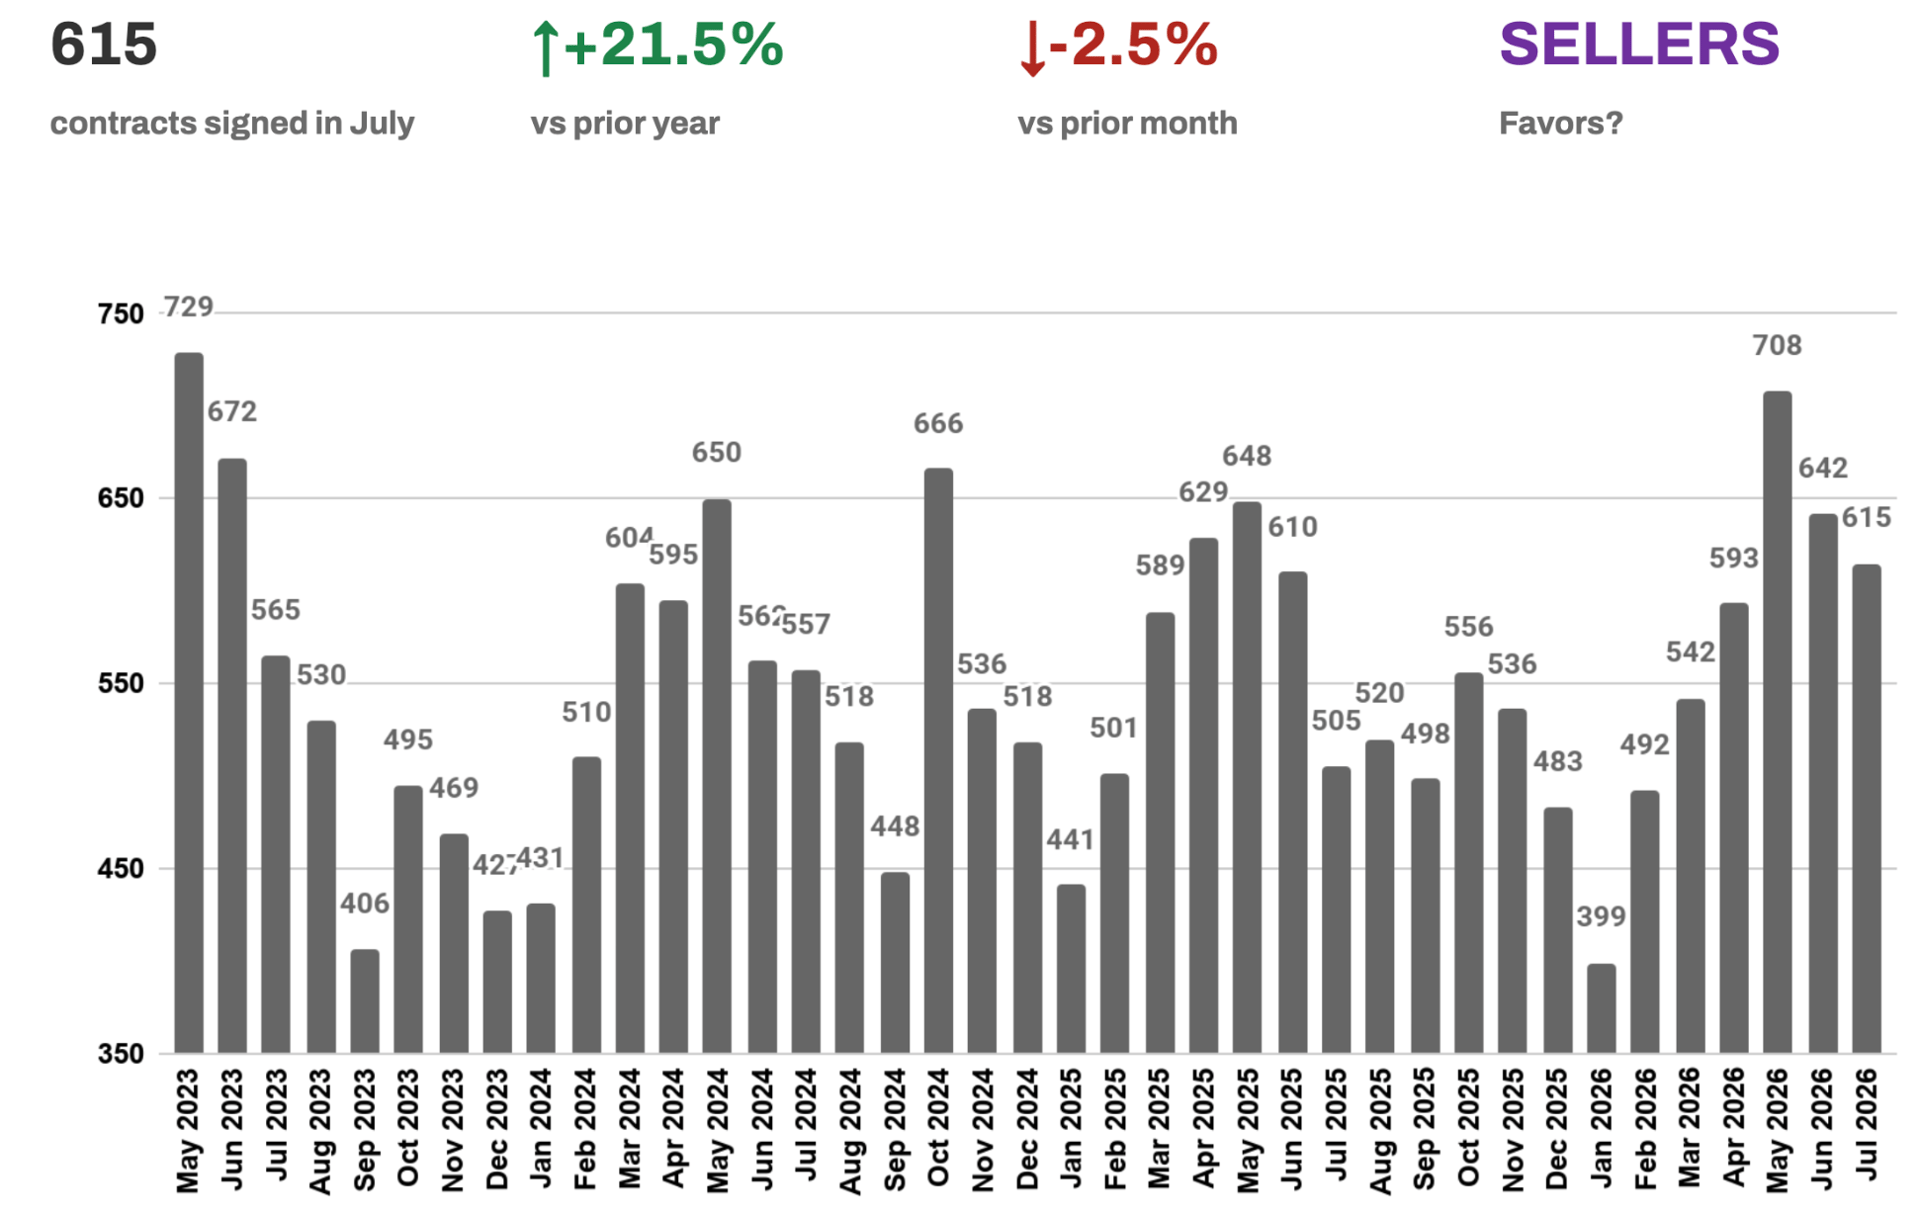
DEMAND SHRUGS OFF THE SUMMER SLOWDOWN, UP 21.5% ON LAST YEAR
July brought 615 signed contracts, essentially holding June’s pace (–2.5%) in a month that usually fades, and up 21.5% on last July, the strongest annual demand reading of 2026 in either borough. Pending sales rose 8.2% to 2,427 (+18% YoY), and the market’s liquidity pace runs 26.4% ahead of last year. June’s pullback is now clearly readable as noise.
■ Buyers: Competition did not take a summer holiday. Move-in-ready product in prime neighborhoods is clearing quickly, and the discount data says lowballs are not landing.
■ Sellers: Demand this far above the seasonal norm is rare. An August listing meets less competition from rival sellers and a still-active buyer pool.
Outlook: The July reading removes June’s ambiguity, expect Brooklyn to keep outperforming its seasonal pattern through Q3 while the pending pipeline converts.
Brooklyn Median PPSF
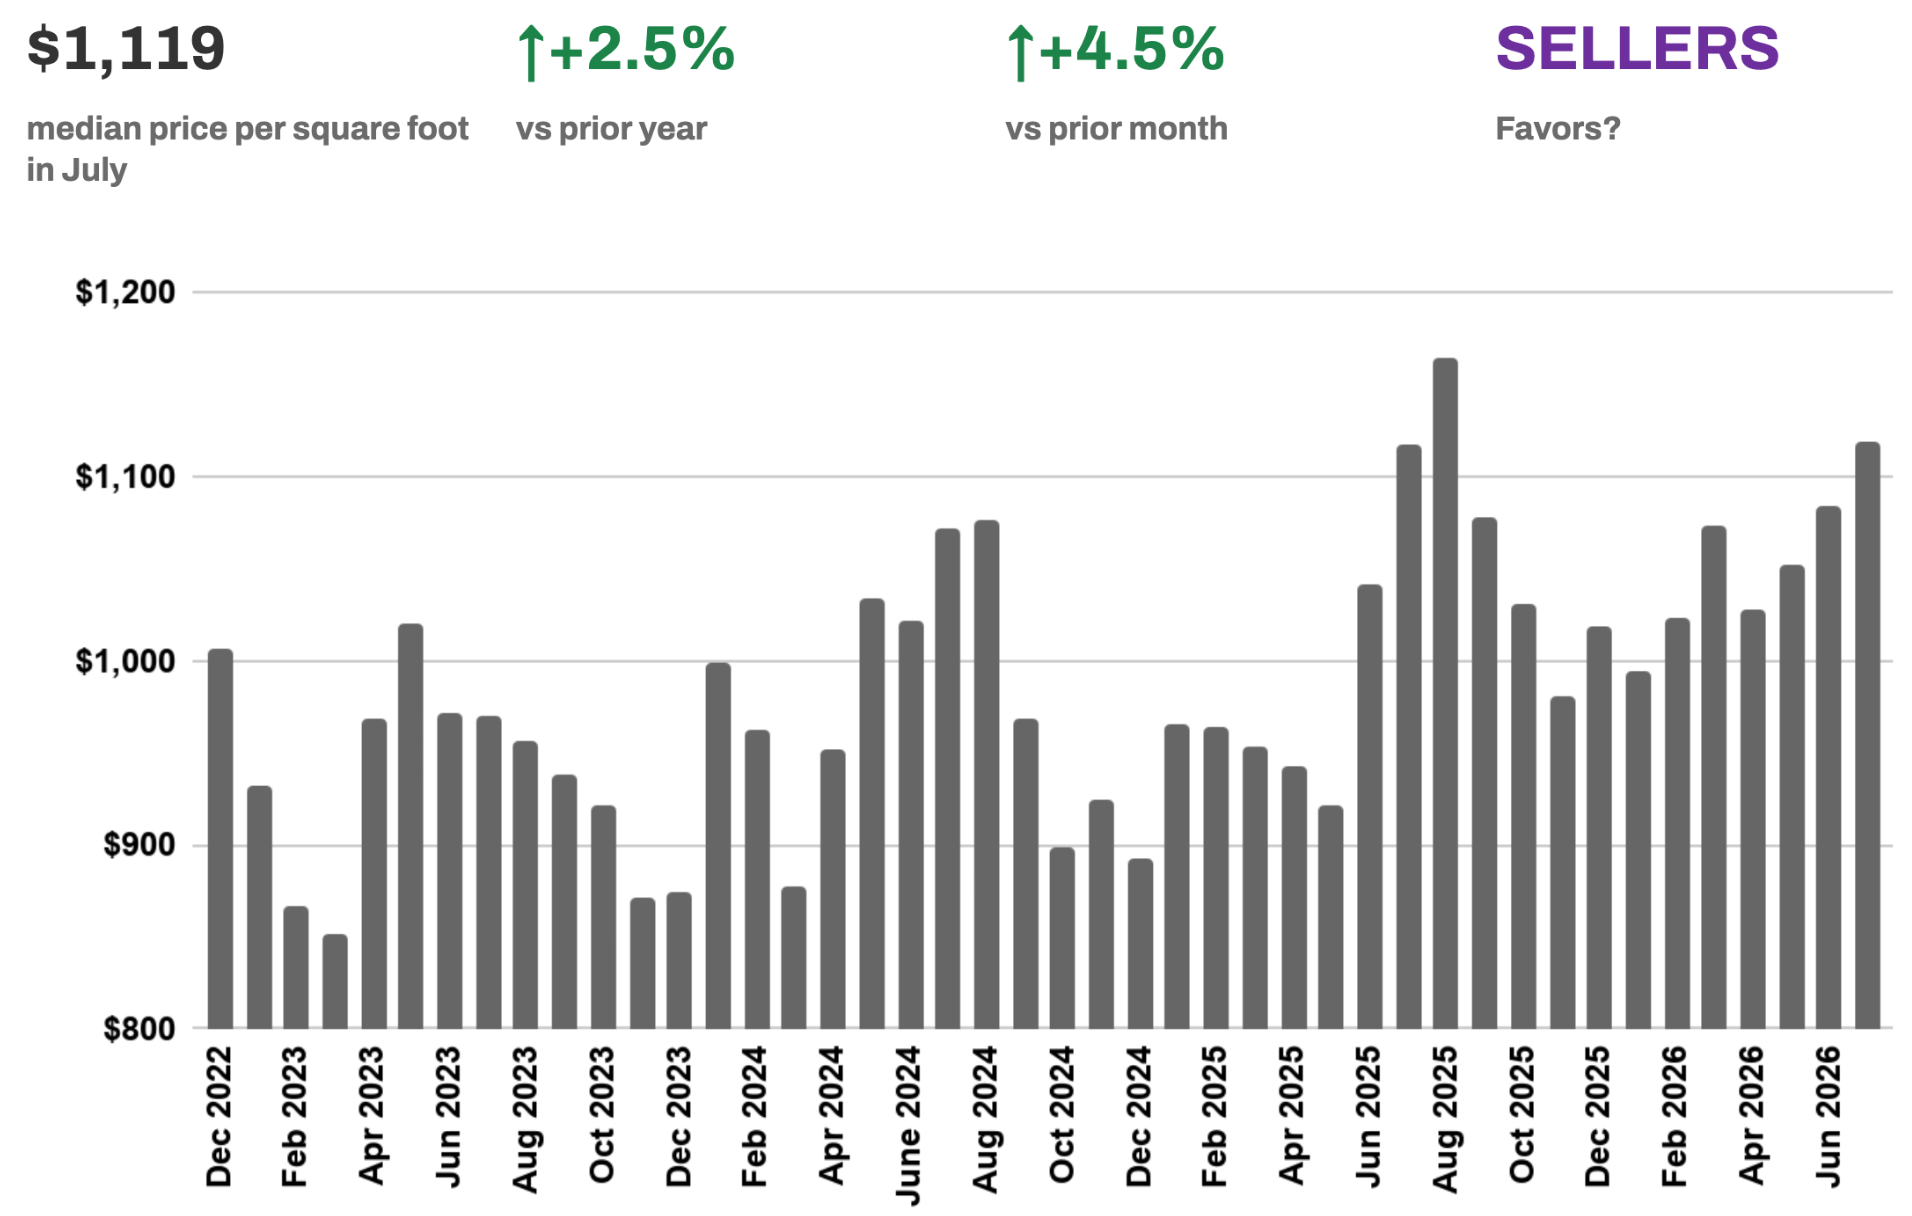
PER-FOOT PRICING SETS A FRESH 2026 HIGH
Median PPSF reached $1,119 in July, up 4.5% from June and 2.5% year-over-year, a fresh 2026 high. The annual growth rate moderated from June’s +6.7% because last July was itself strong, not because pricing weakened: the level keeps rising. Combined with the $1.2M median sale price (+16.4% YoY, mix-assisted), the picture is firm pricing led by the premium end.
■ Buyers: Per-foot leverage remains limited. Focus on asset quality and the segments still repricing, larger units and listings with real time on market.
■ Sellers: Pricing power is the strongest Brooklyn has shown in 2026. Accurately priced listings are converting at or above ask.
Outlook: With demand at +21.5% and supply flat, per-foot pricing has support through Q3. The moderating YoY rate is a base effect, not weakening.
Brooklyn Median Listing Discount
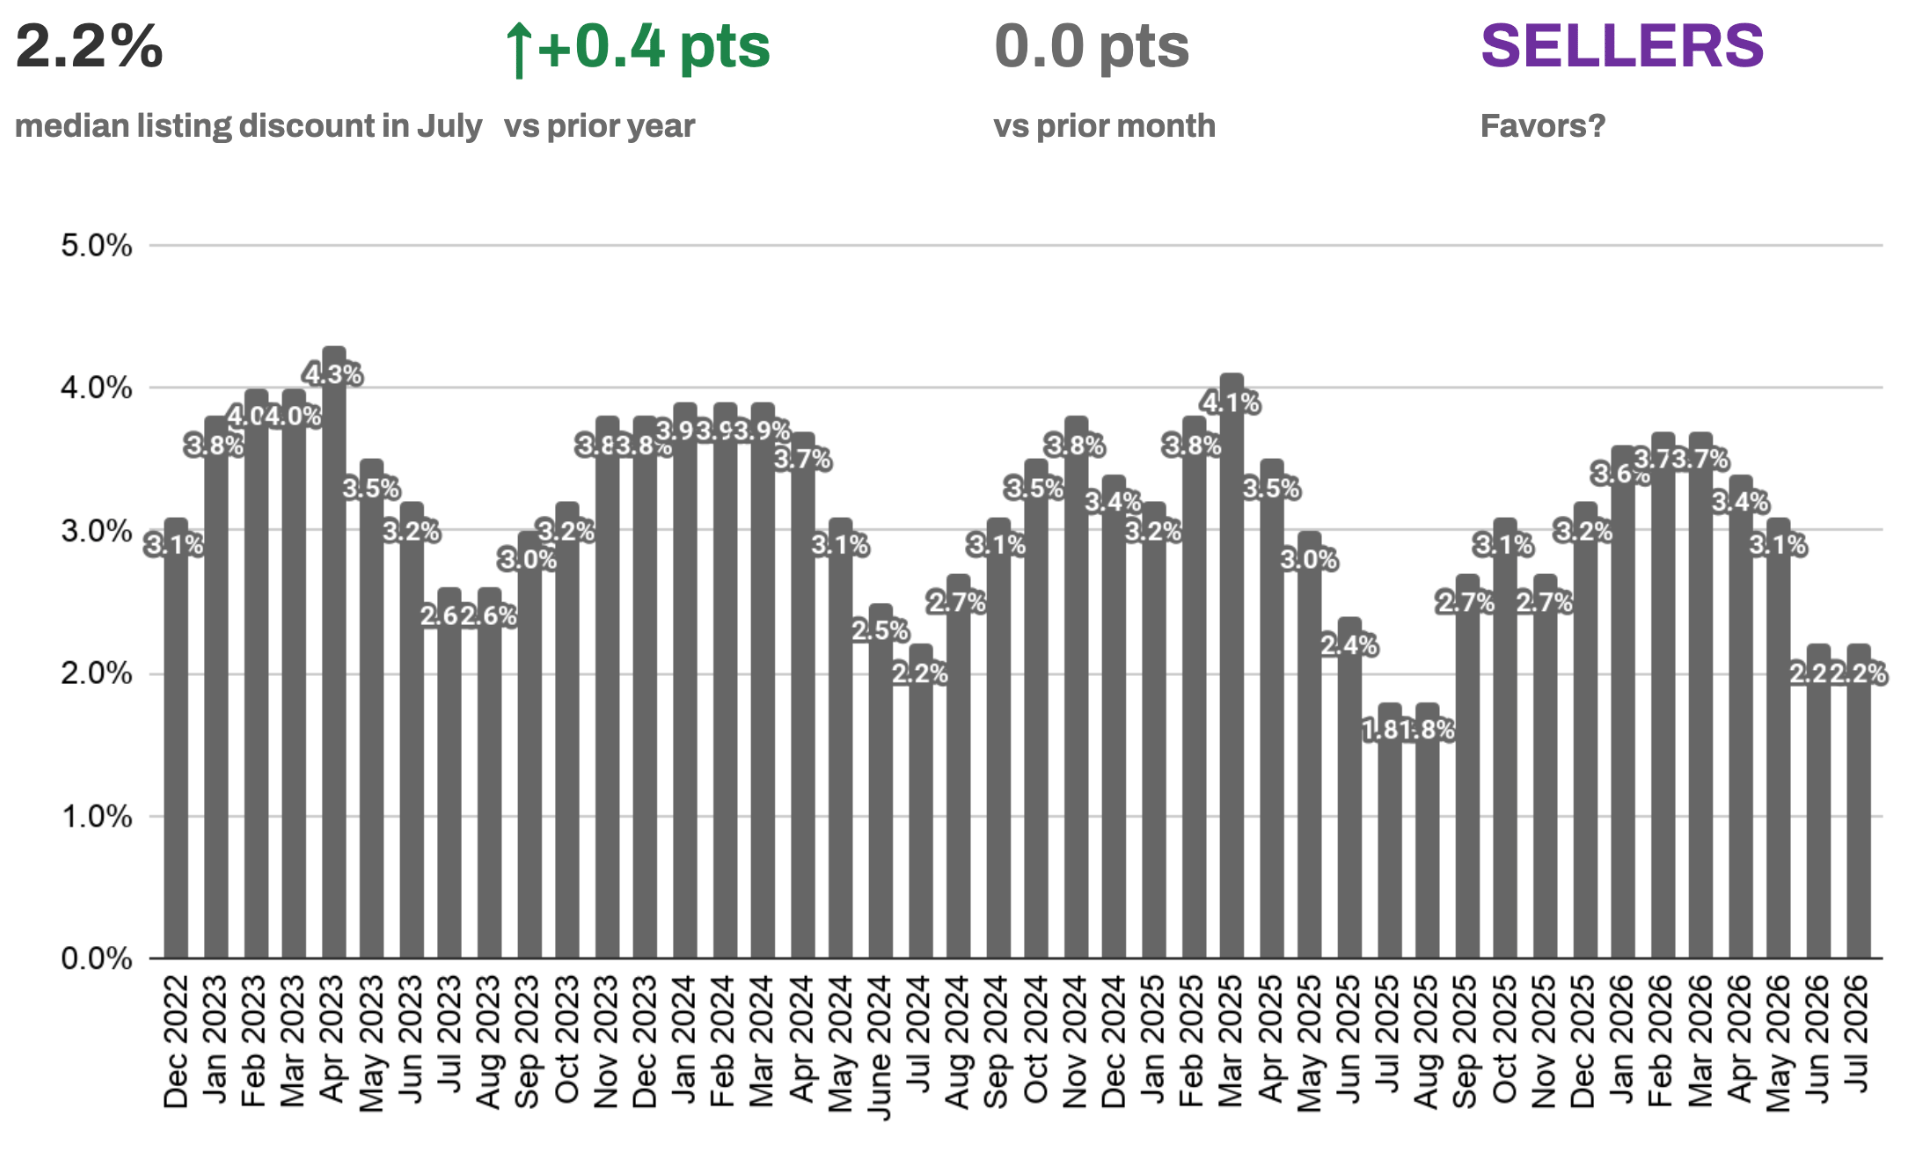
NEGOTIATING ROOM HOLDS AT THE 2026 LOW
The median listing discount held at 2.2% in July, flat from June and still the tightest reading tracked in either borough this year, a tenth of a point wider than an unusually tight July 2025. Properties are trading at roughly 97.8 cents on the final asking dollar, and 22.9% of May sales closed above ask entirely.
■ Buyers: There is very little room to negotiate on well-priced, well-located listings right now. A credible, clean offer will outcompete a lowball on desirable product.
■ Sellers: Pricing power is about as strong as this report has recorded for Brooklyn. Accurately priced listings are converting at or above ask.
Outlook: Expect the low-2% range to hold while demand runs this far ahead of supply. A meaningful widening would take a heavy fall listing season.
Rental Remarks
ASKING RENTS AT $3,900: GROWTH COOLS TO +4.0% AS SUPPLY SWELLS
Brooklyn’s median asking rent held at $3,900 in June, essentially flat on the month and up 4.0% year over year, the slowest annual growth of 2026. Supply is the story: active inventory jumped 13.0% on the month to 13,491 units and is now 2.2% above last June. The share of listings cutting price rose to 13.1% from 11.8%. Brooklyn landlords still hold the edge, but the market is handing renters more options than at any point this year.
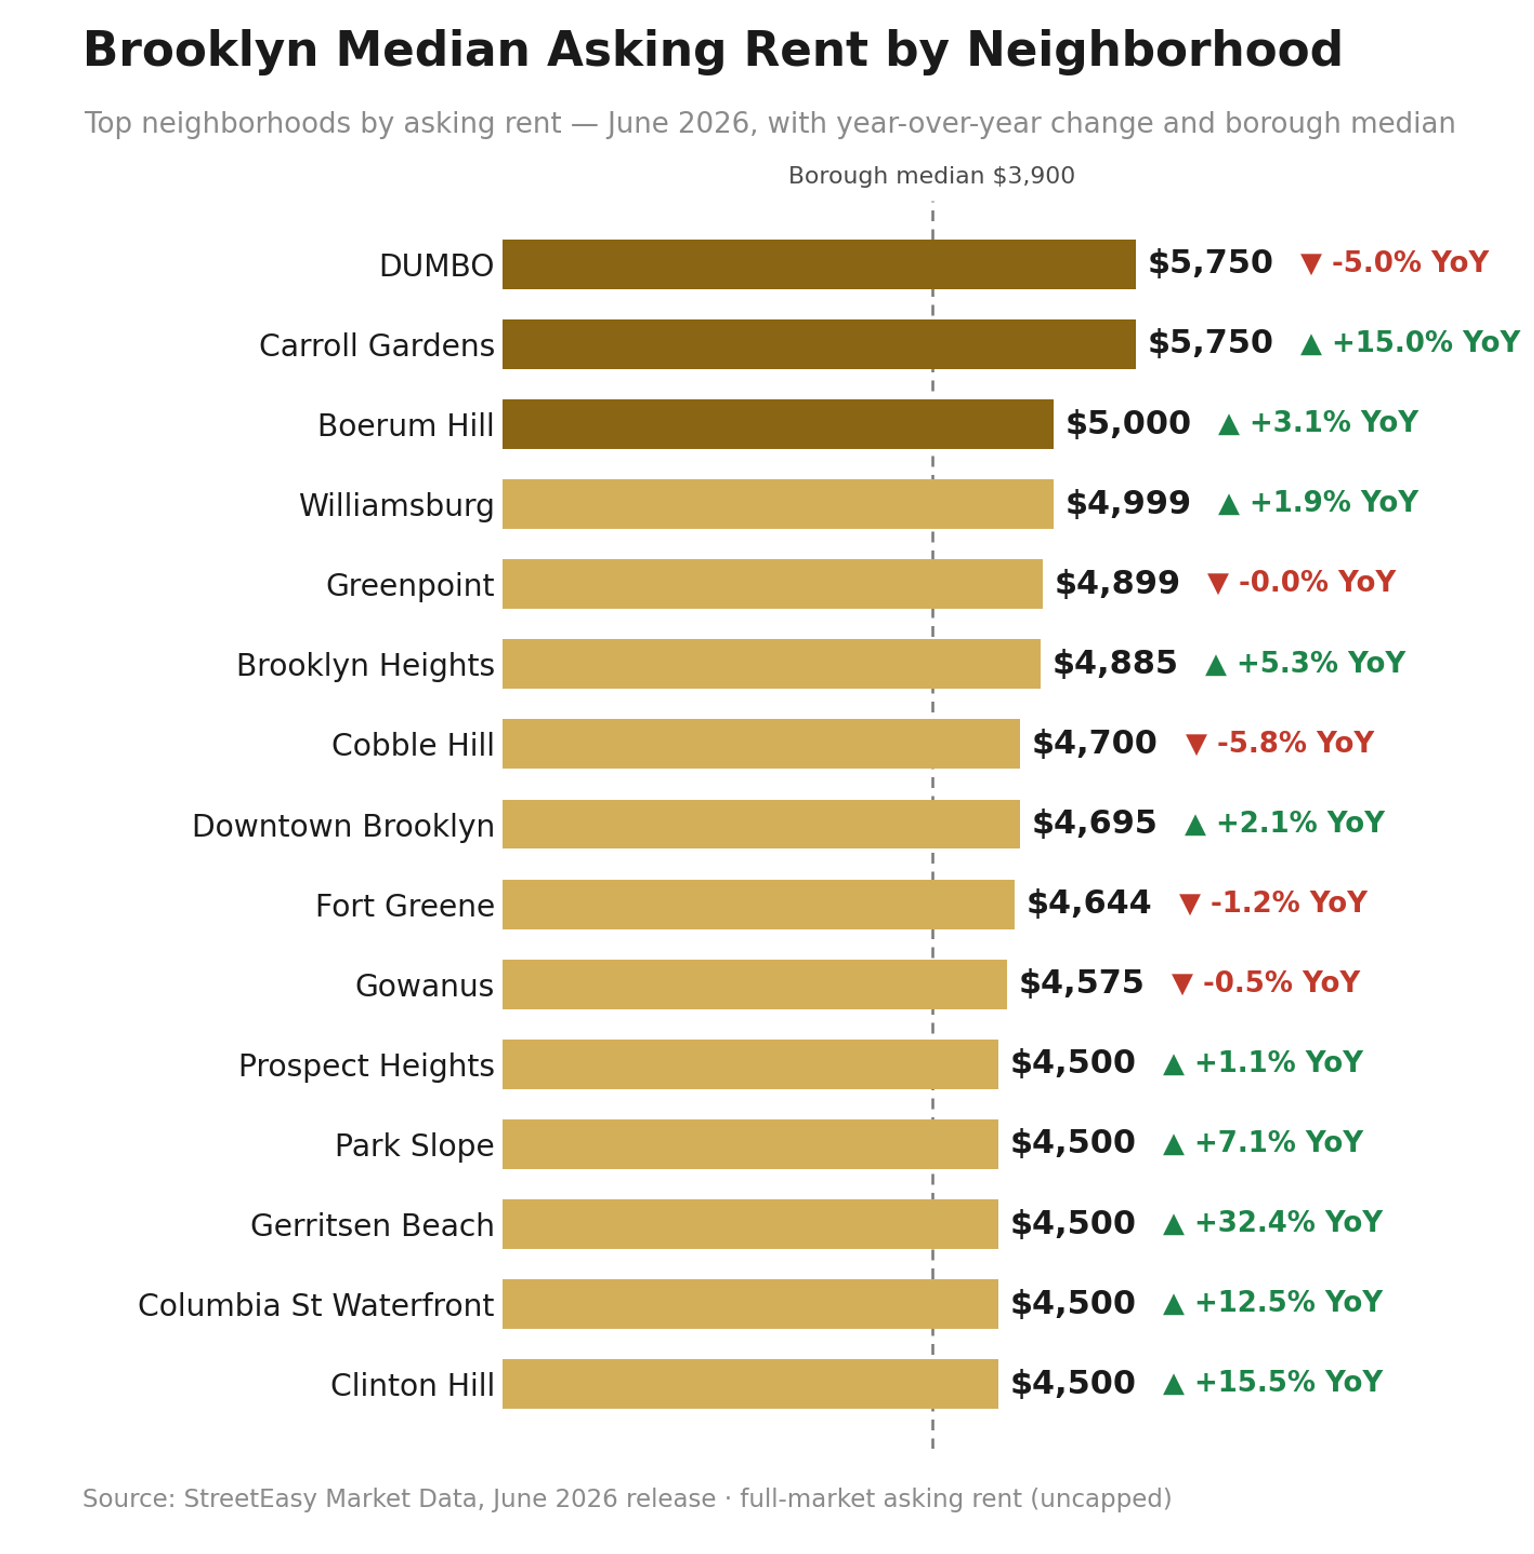
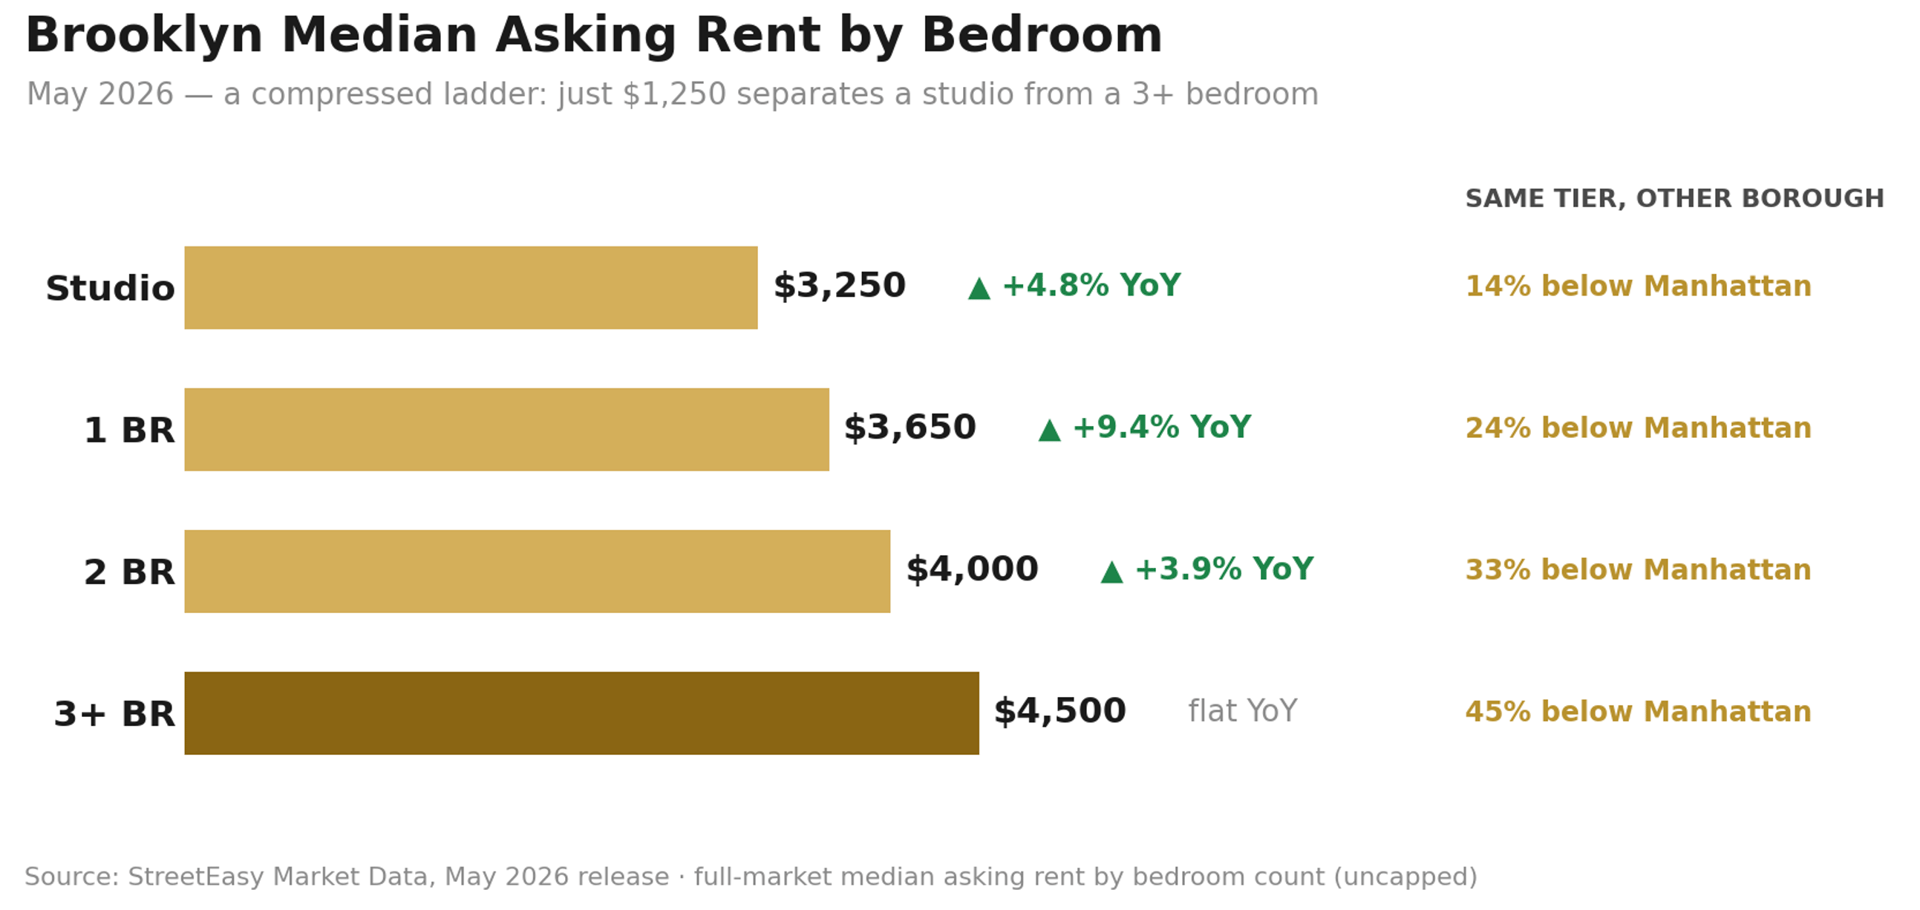
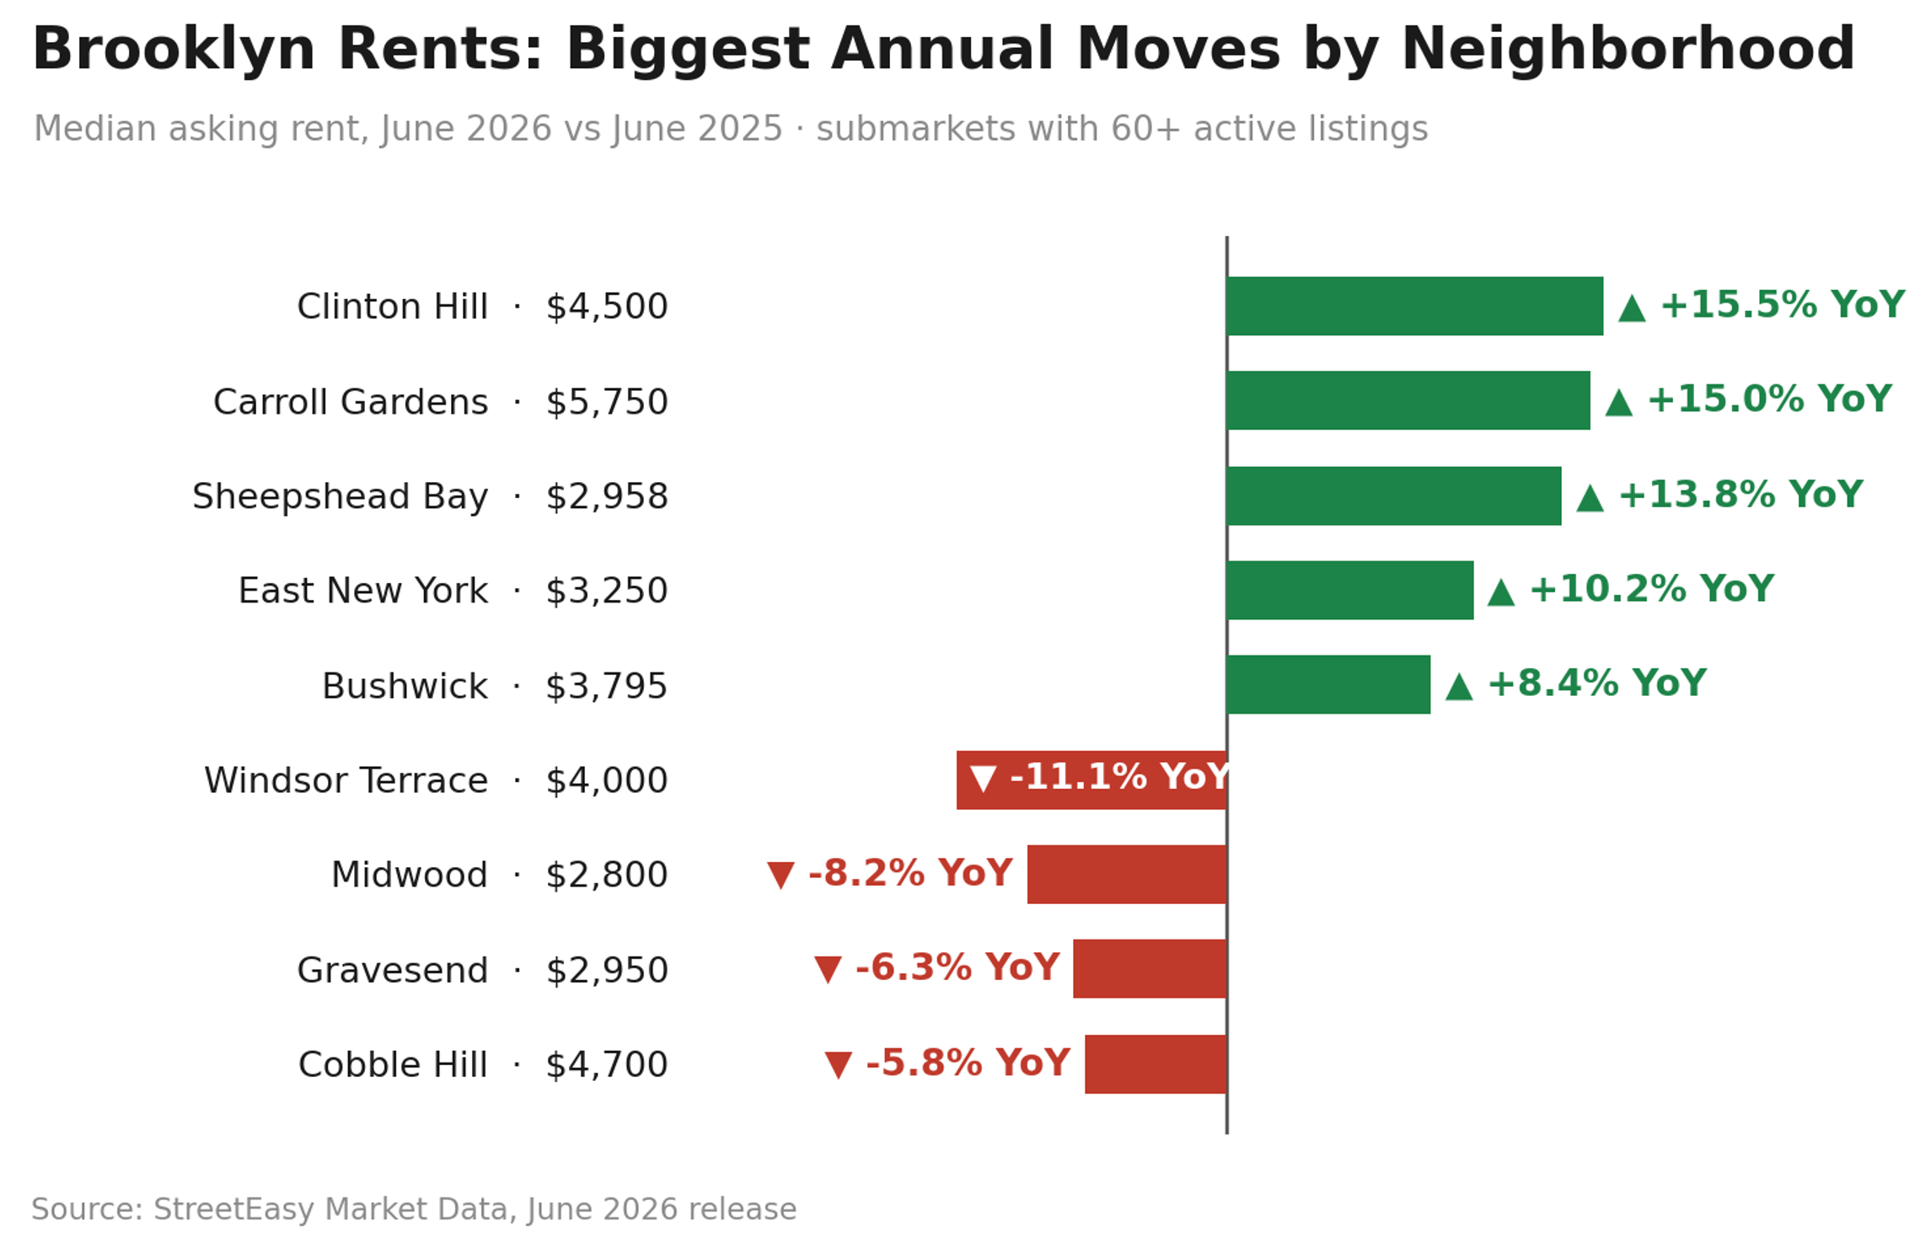
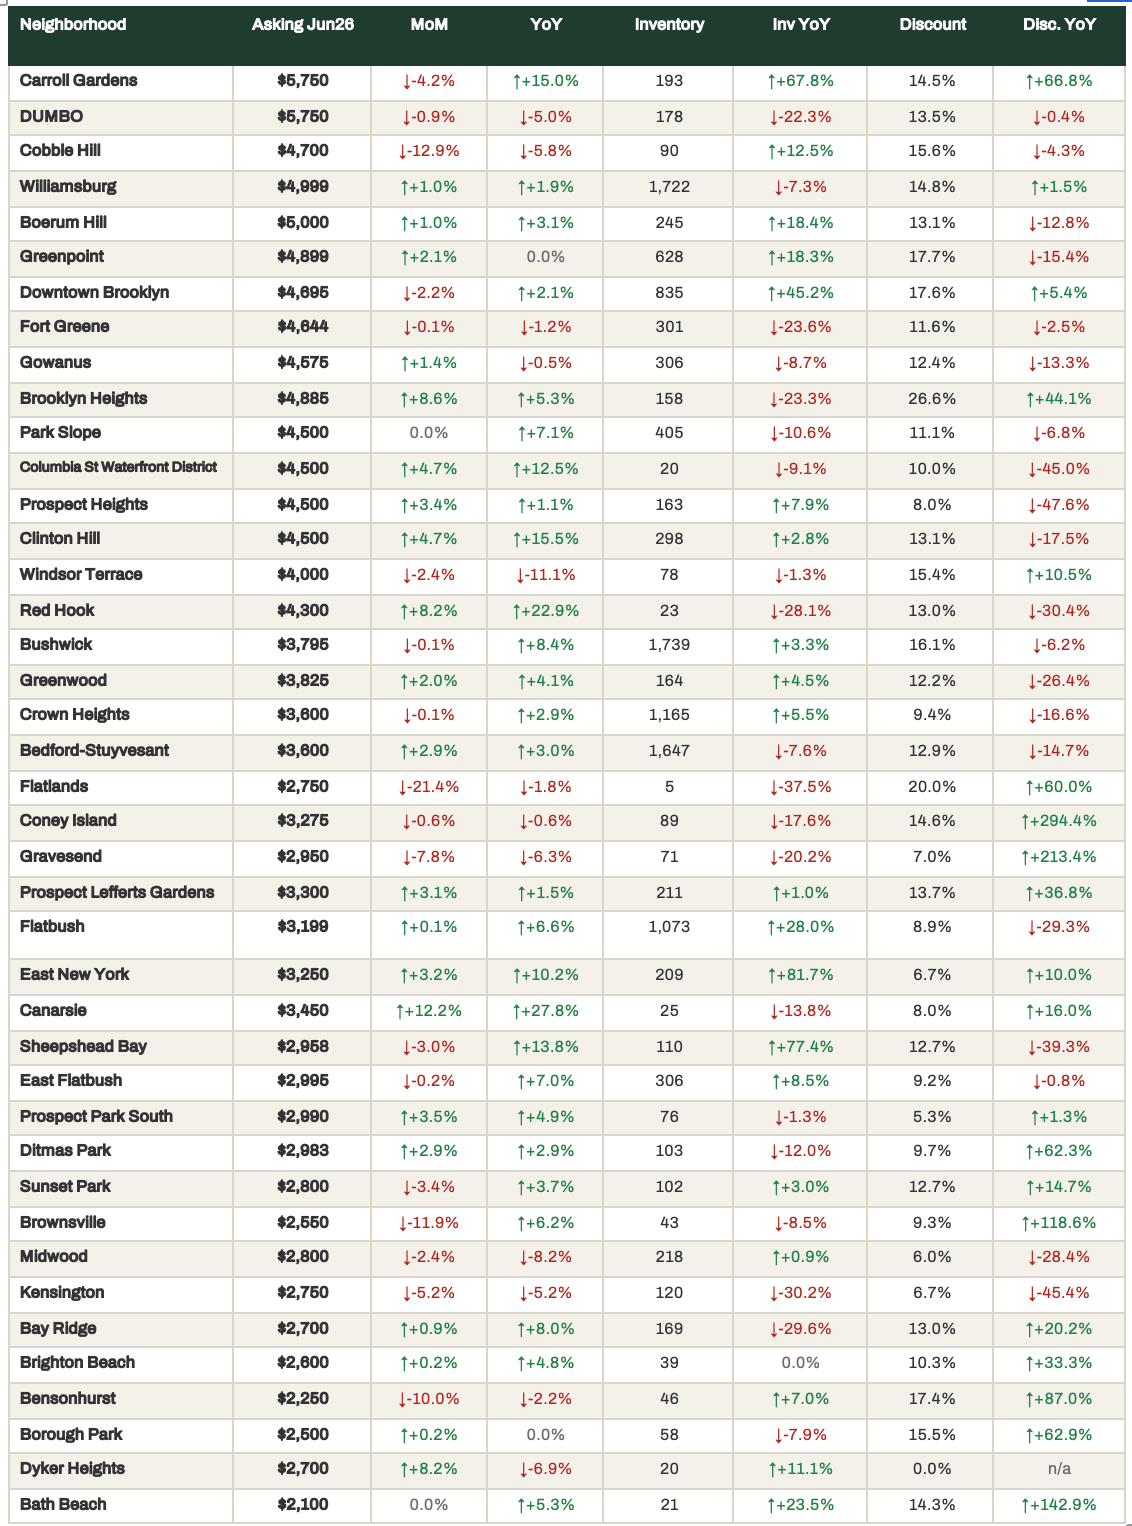
DUMBO and Carroll Gardens share the top of the market at $5,750, on opposite paths: Carroll Gardens is up 15.0% year over year while DUMBO is down 5.0%. The micro-market spread is the story: Clinton Hill (+15.5%), Sheepshead Bay (+13.8%) and East New York (+10.2%) lead the gainers, while Windsor Terrace (down 11.1%), Midwood (down 8.2%) and Cobble Hill (down 5.8%) gave ground. South Brooklyn value corridors are appreciating faster than parts of the brownstone belt.
■ For Renters: The best selection of 2026: inventory up 13% on the month and 13.1% of listings cutting price. The falling-rent pockets above are where negotiating actually works right now.
■ For Landlords: Growth of 4.0% on top of last year’s absorption is still a firm market, but the supply build is real. Price to the building’s comps, not to the borough headline.
Outlook: Peak season demand should absorb much of the new supply, but the direction has changed. Expect annual growth in the 3% to 5% range through Q3 with sharp neighborhood dispersion.
Source: StreetEasy Market Data, June 2026 release · median asking rent, active rental inventory, discount share · full market, uncapped · 41 Brooklyn submarkets shown.
Cross-Check: Brooklyn Sales by Neighborhood (StreetEasy)
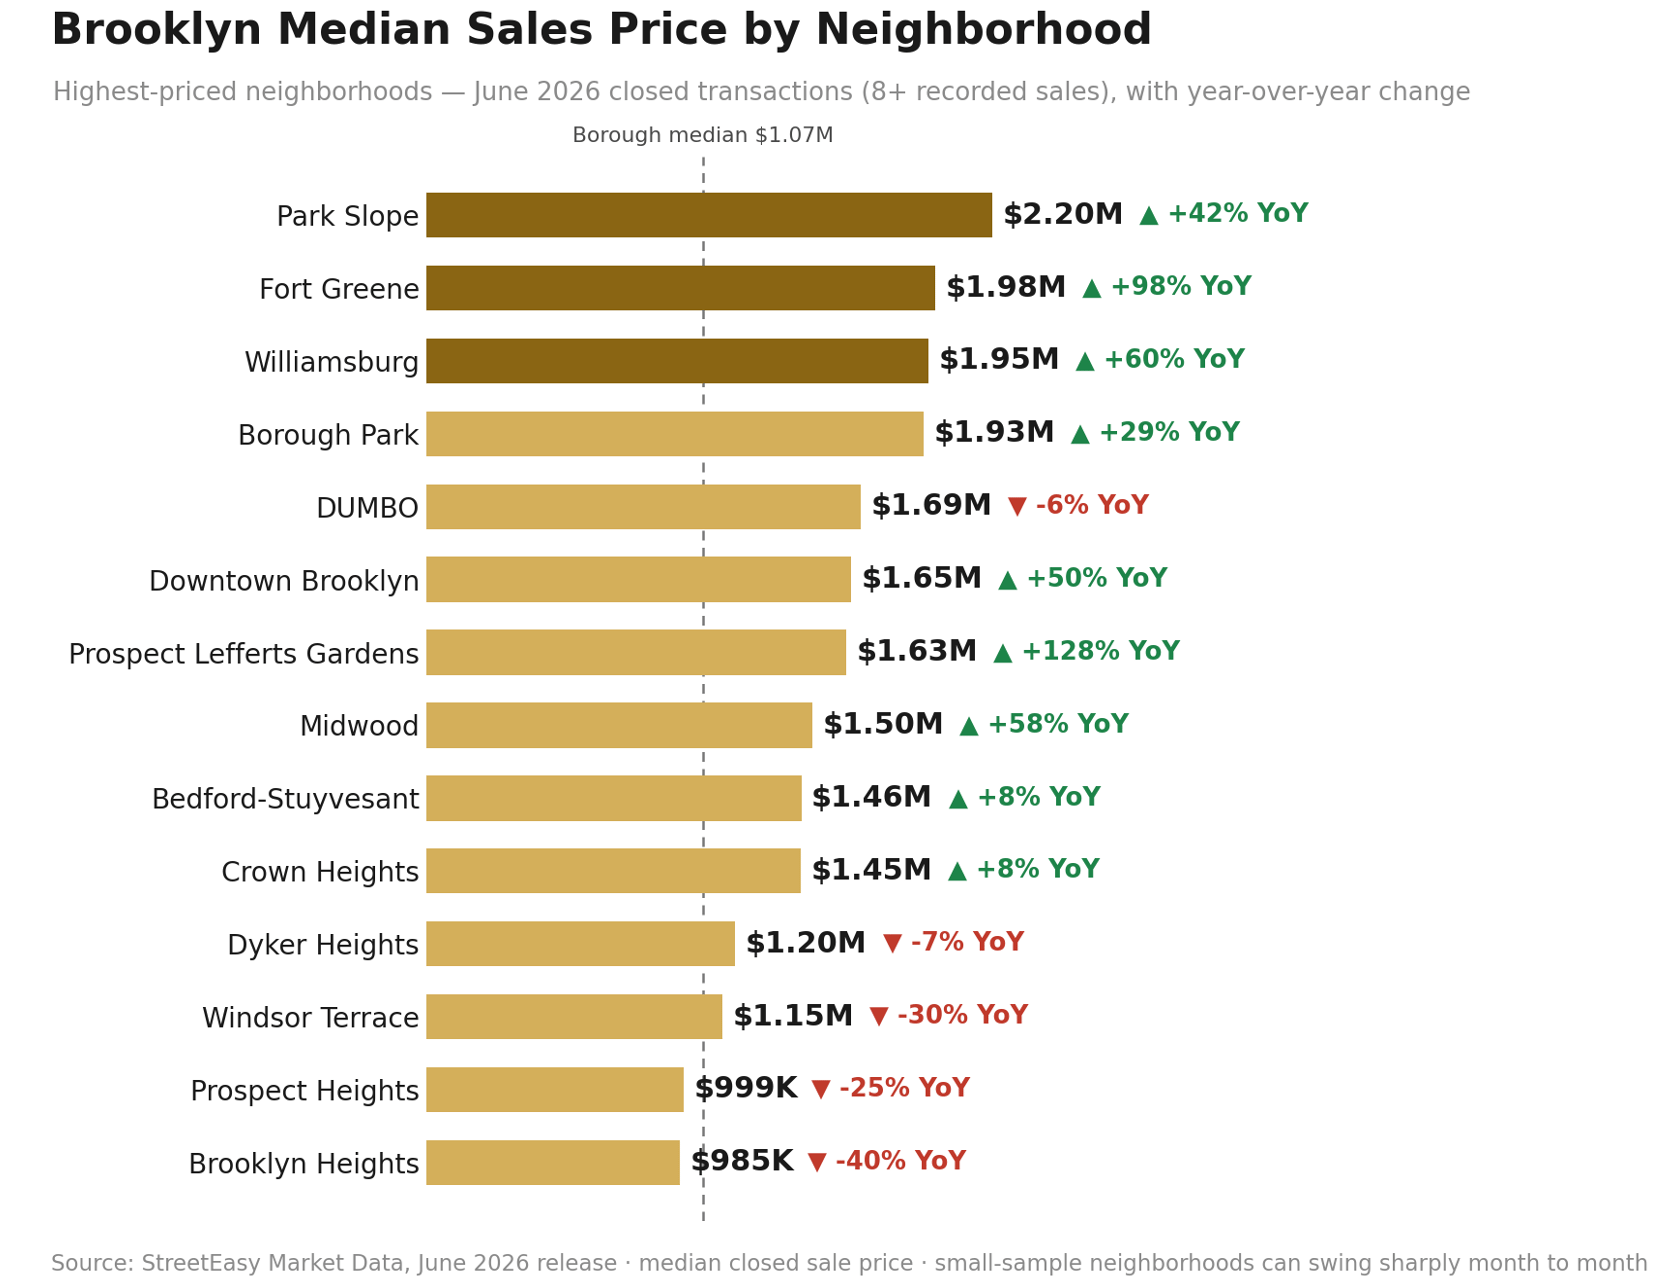
StreetEasy’s June closings put the borough median at $1.08M. Among submarkets with at least eight recorded sales, Park Slope leads at $2.20M (+42% YoY), ahead of Fort Greene ($1.98M) and Williamsburg ($1.95M). Brownstone-belt closings drove the top of the table this month; samples stay small, so read these alongside the borough-wide UrbanDigs figures above.
Mortgage Remarks
Courtesy of the Federal Reserve Bank of St. Louis (FRED) and Bank of America, Chase, and Wells Fargo.
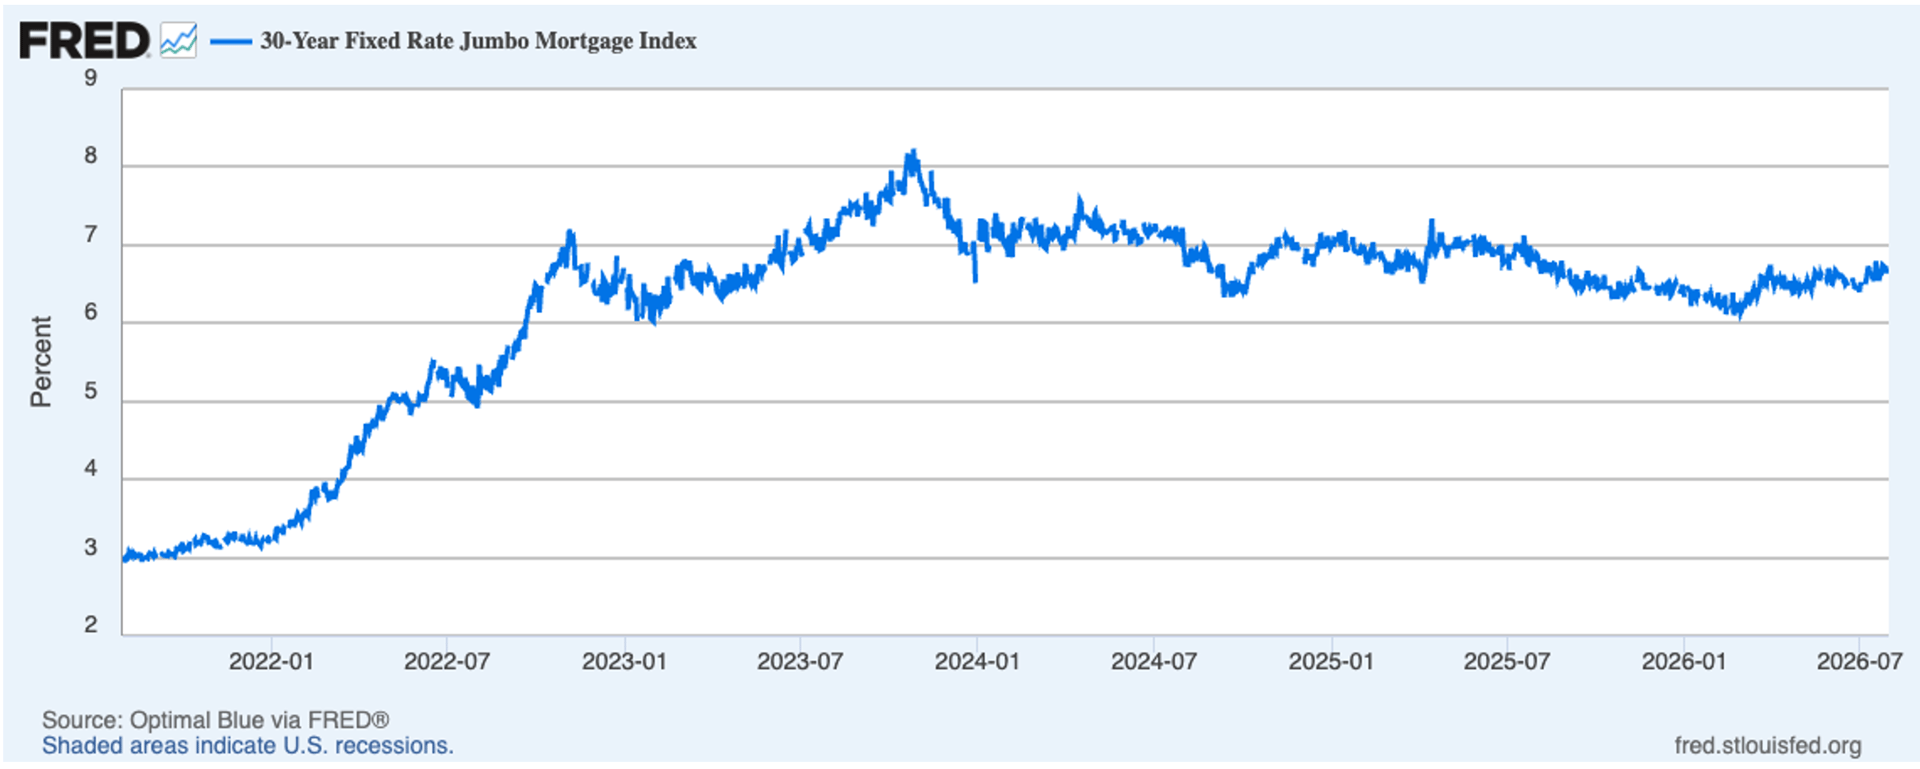
JUMBO APRS AT 6.73%: A REAL PAYMENT EVENT AT BROOKLYN PRICE POINTS
Thirty-year jumbo APRs at the major banks averaged 6.73% as of August 3, per our tracker of Bank of America (6.85%), Chase (6.61%) and Wells Fargo (6.75%), up from 6.57% in early June and the highest of 2026. The FRED chart below shows the broader jumbo index in the mid-6s. Brooklyn’s buyer pool leans on financing more than Manhattan’s, so the move bites harder here: roughly $215 more per month per $500K borrowed than at February’s low. July demand printed +21.5% anyway. Demand is outrunning the rate headwind, for now.
■ Buyers: Refresh the pre-approval at 6.75%, not the spring quote. Payment surprises kill deals late.
■ Sellers: Despite the highest APRs of the year, contracts ran a fifth ahead of last July. Accurate pricing is still converting at or above ask.
Outlook: The Fed held on July 29 for a fifth straight meeting with three dissents favoring a hike. Base case is high-6s APRs into the fall; the entry-level segment feels it first.
Investor Insights
Currency and International Demand
As in Manhattan, the FX story cooled in July: the dollar index ended the month just below 100 with EUR/USD near 1.15, roughly flat on the summer after June’s breakout. For international buyers, Brooklyn’s case now rests on fundamentals, a lower entry point than Manhattan with demand running 21.5% ahead of last year, rather than on currency.
Domestic Investors and Yield
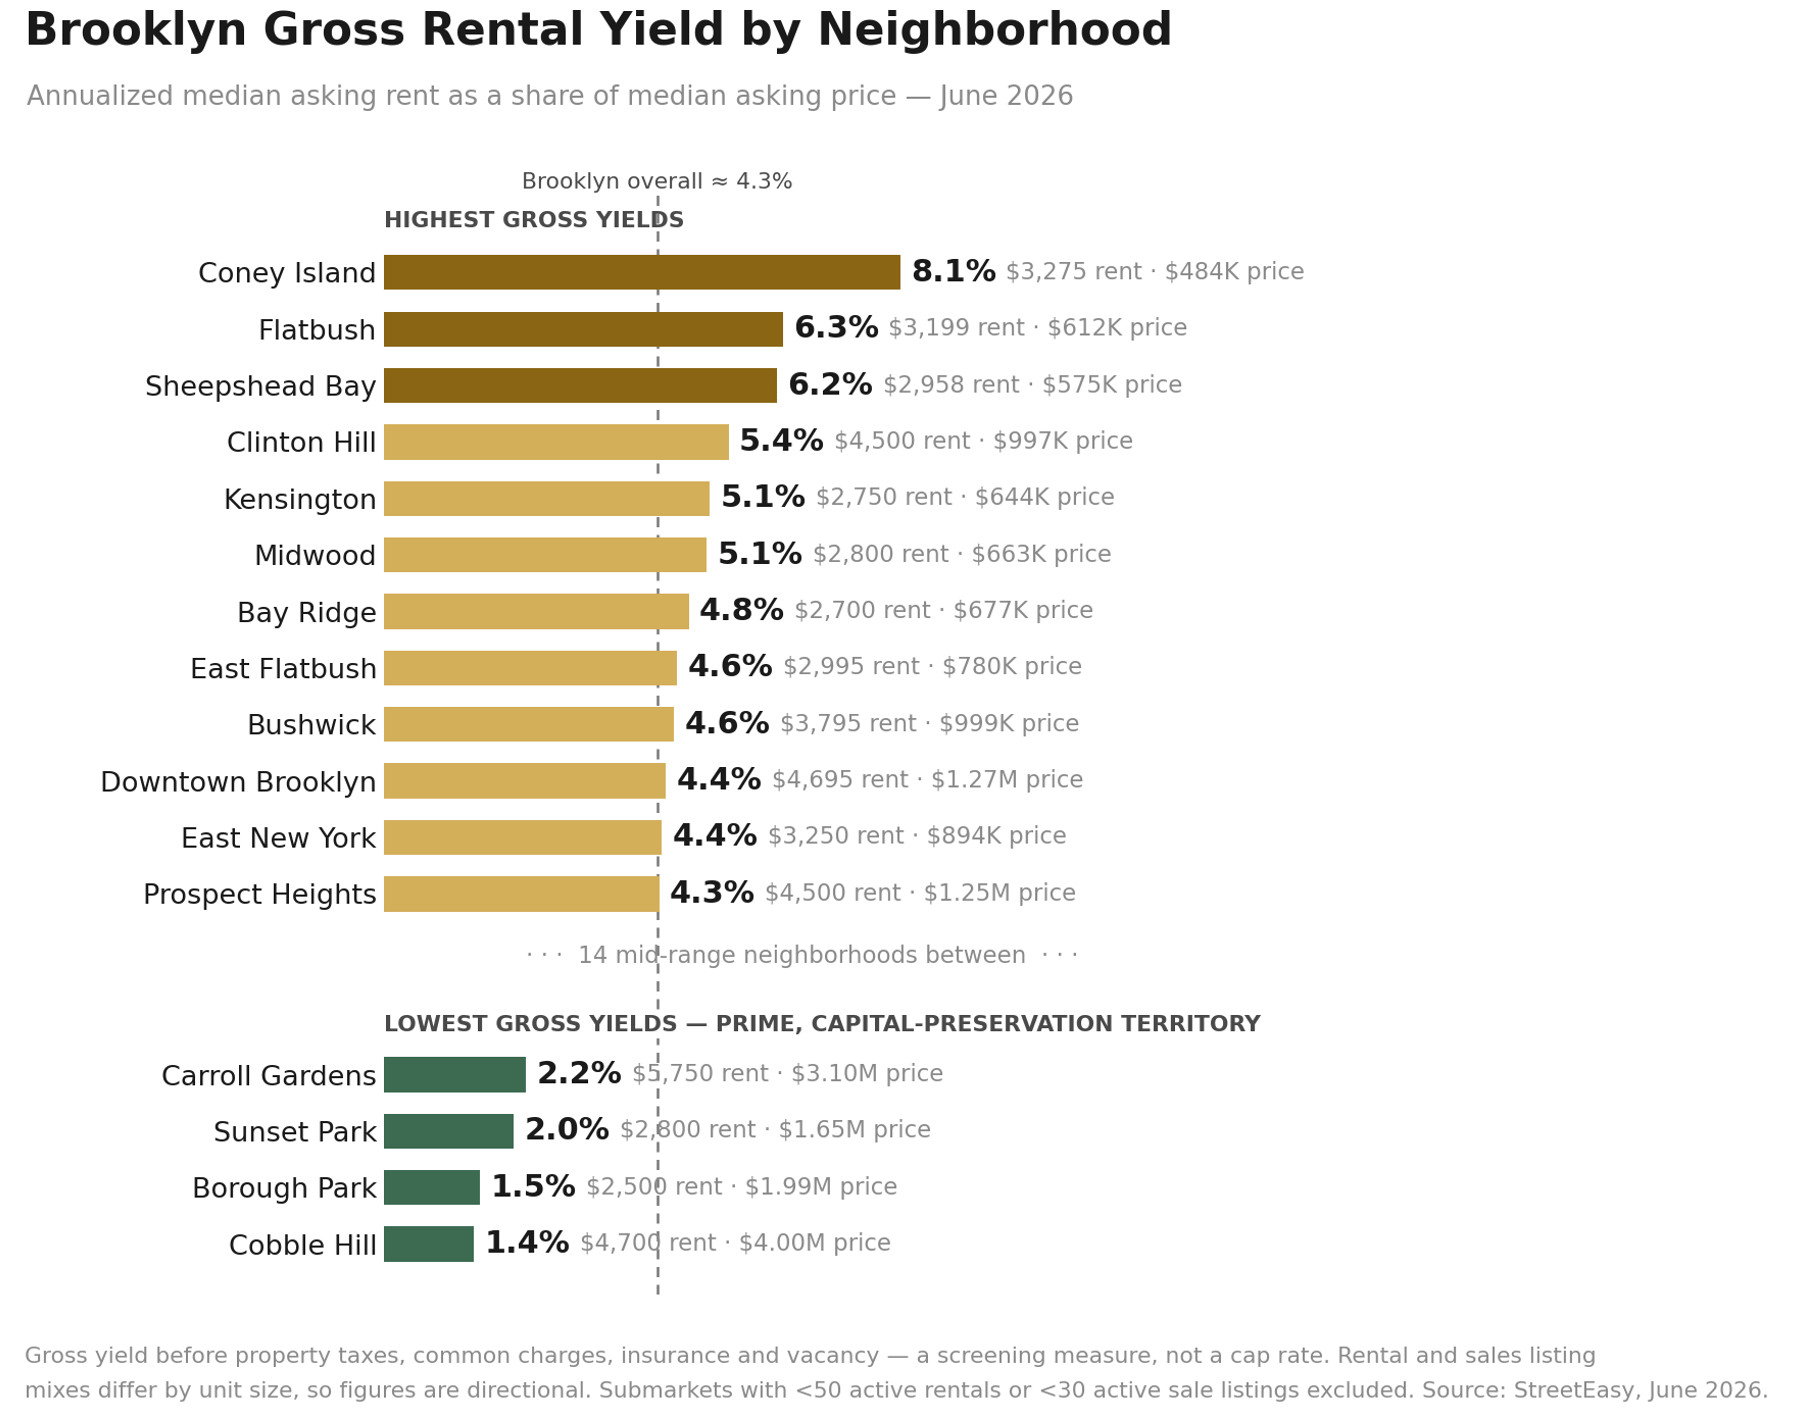
Brooklyn’s investment case held its shape in June: a meaningfully lower entry point than Manhattan ($1.2M vs $1.33M at the median), demand up 21.5% year over year, and gross yields that match Manhattan’s 4.3% borough average with more high-yield submarkets above 6%. Rising rental supply is the variable to watch; it cools rent growth before it dents yields.
New This Month: The Investor Yield Map
The yield map, updated for June: Coney Island still tops the entire city at 8.1% gross ($3,388 median rent against a $500K ask), with Flatbush (6.3%) and Sheepshead Bay (6.2%) behind it. Clinton Hill (5.4%) doubles as the borough’s hottest rent market, up 15.5% year over year. At the bottom, Cobble Hill (1.4%), Borough Park (1.5%) and Sunset Park (2.0%) stay in capital-preservation territory. Borough-wide, Brooklyn screens at roughly 4.3% gross.
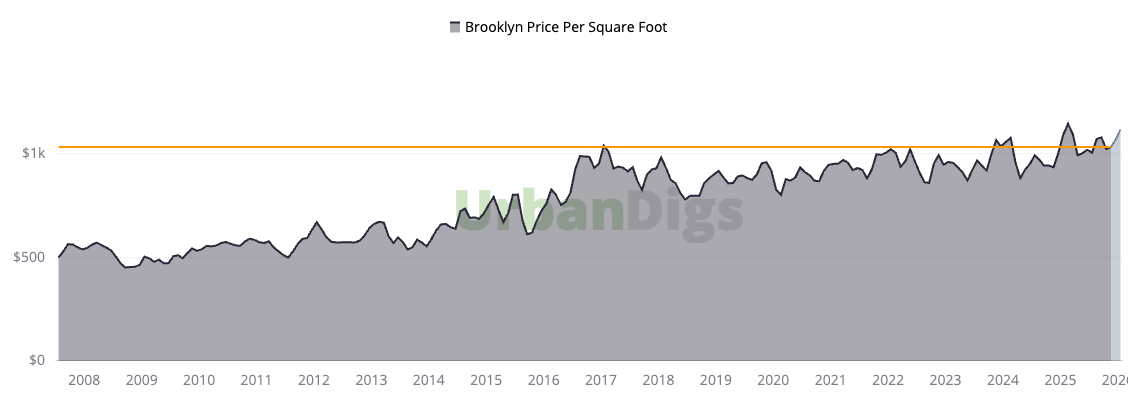
The Brooklyn PPSF Story
Brooklyn’s median PPSF has appreciated from a post-financial-crisis trough near $700/sf in the mid-2010s to a sustained $900–$1,100 range over the past several years, and July’s $1,119 print sits above the top of that band. Unlike Manhattan’s decade-long plateau, Brooklyn’s trajectory has been more actively upward, consistent with the borough’s ongoing re-rating as a primary destination rather than a Manhattan alternative. July’s record median, even mix-assisted, confirms that trajectory remains intact.
References
1. Sales and pricing data, Supply, Demand, PPSF, Listing Discount, Median Sale Price, Days on Market, Leverage Index inputs: UrbanDigs, July 2026 actuals.
2. Bedroom-level median sale price (Condo and Co-op): UrbanDigs Charts Room, 5-year monthly series, by closed date.
3. Rental data (asking rent, inventory, discount share, neighborhood table): StreetEasy Market Data, June 2026 release. Bedroom-level rent chart: May 2026 release.
4. Sales cross-check by neighborhood: StreetEasy Market Data, June 2026 release.
5. Mortgage rate data: Optimal Blue via Federal Reserve Bank of St. Louis (FRED); Howard Hanna NYC jumbo APR tracker (Bank of America, Chase, Wells Fargo), August 3, 2026.
https://www.federalreserve.gov/newsevents/pressreleases/monetary20260617a.htm6. Federal Reserve policy: Federal Reserve Board, FOMC statement, July 29, 2026. https://www.federalreserve.gov/newsevents/pressreleases/monetary20260729a.htm
7. Currency data: EUR/USD, GBP/USD, and U.S. Dollar Index market data, as of late July 2026.
8. Gross rental yield: annualized StreetEasy median asking rent ÷ median asking price, by neighborhood, June 2026 release. Screening measure; thin submarkets excluded (see chart footnote).
If you would like to chat about the most recent market activity,
feel free to contact us at [email protected] or connect with one of our Advisors.
Howard Hanna NYC brings the nation’s largest independent and family-owned brokerage to New York City, uniting the strength of a national network with the insight and sophistication of a local firm. Formed through joining forces with Elegran Real Estate, Howard Hanna NYC delivers a seamless, full-service experience backed by more than 15,000 agents across 500 offices in 14 states. The firm’s forward-thinking, agent-first culture continues to shape the future of real estate across Manhattan and the Tri-State area.Learn more at www.howardhannanyc.com.