Manhattan Market Pulse ¹ August 2026
Prices Hit 2026 Highs as Supply Tightens Sharply
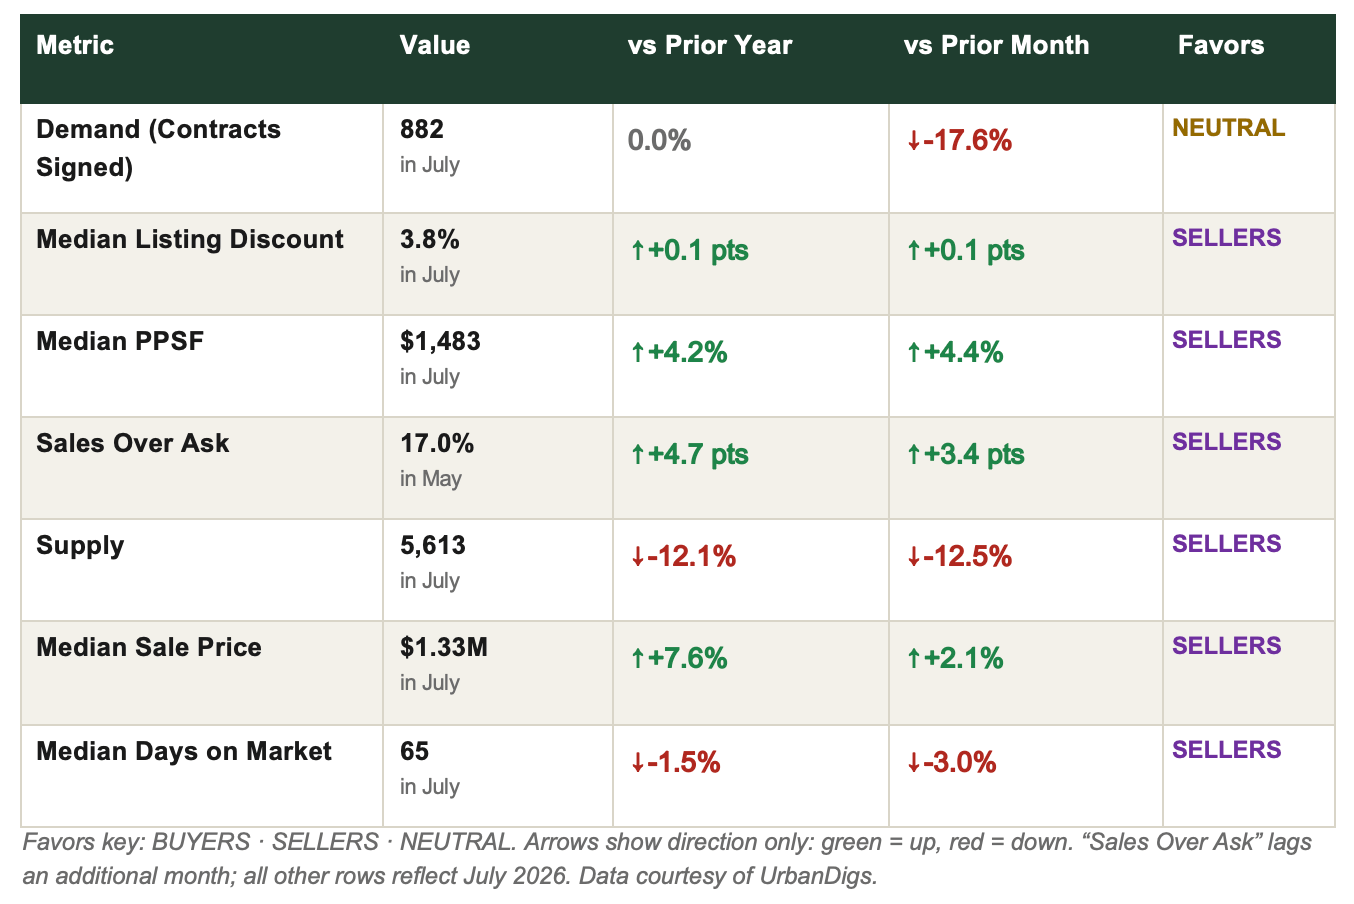
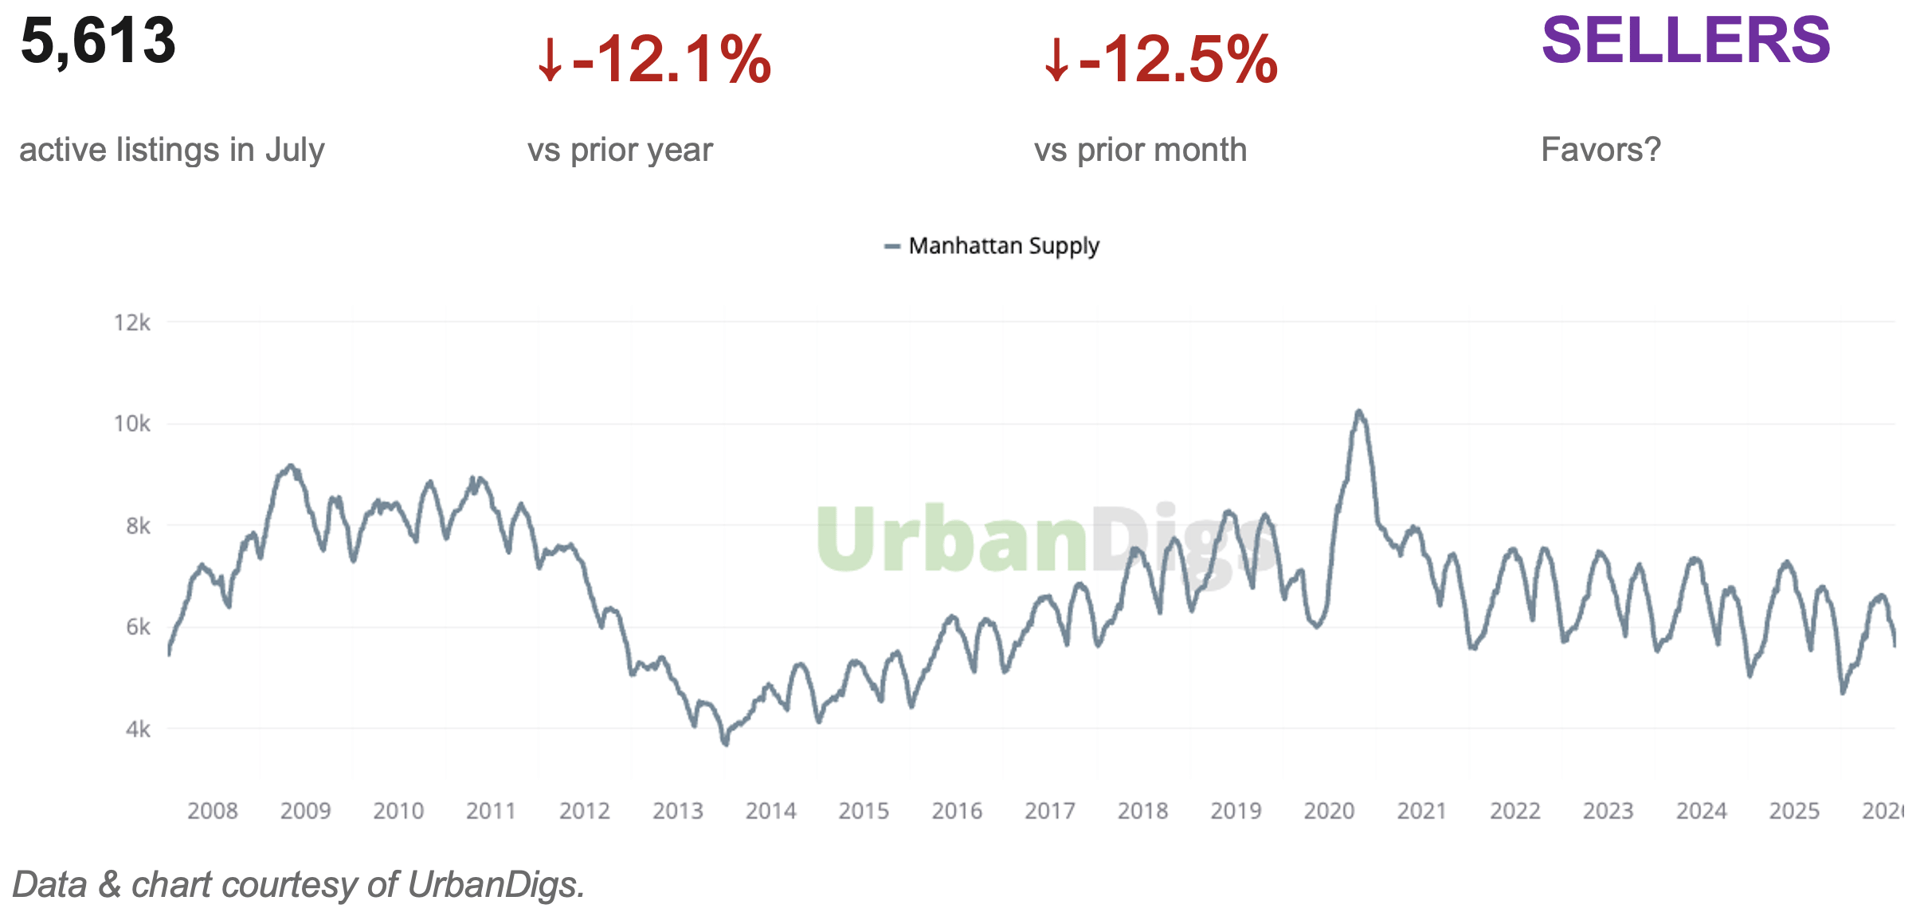
July brought Manhattan’s sharpest supply contraction of the year: active listings fell 12.5% from June to 5,613, now 12.1% below last July, as new listings dropped 29% and a net 985 homes came off the market. Demand downshifted with the season, 882 contracts, down 17.6% from June but exactly even with last July, while pricing strengthened: the median sale price reached $1.33M, up 7.6% year-over-year and the strongest print of 2026, and median PPSF jumped to $1,483 (+4.2% YoY), erasing June’s soft reading.
Bottom line: Manhattan enters late summer as a market defined by scarcity. Sellers pulled back faster than buyers paused, pending sales sit 27.8% above last year, and the listing discount held at 3.8%. The quiet season is doing nothing to loosen conditions.
Market Snapshot: Five Numbers That Matter
• 882 contracts signed in July, even with last July and down 17.6% from June. A seasonal downshift, not a demand break: pending sales sit 27.8% above last year.
• 5,613 active listings, down 12.1% year-over-year after the sharpest monthly contraction of 2026 (-12.5%). New listings fell 29% from June.
• $1.33M median sale price, up 7.6% year-over-year, the strongest annual gain and the highest level of 2026.
• $1,483 median PPSF, up 4.4% from June and 4.2% year-over-year, fully reversing June’s mix-driven dip.
• 17% of May sales closed above asking price, up 4.7 points year-over-year, buyer competition is concentrating on well-priced listings.
Key Takeaways
• Supply is the story: 5,613 listings, down 12.5% MoM and 12.1% YoY, with a net loss of 985 homes in July and new listings off 29%, sellers withdrew faster than buyers paused.
• Demand went seasonal, not soft: 882 contracts, flat versus last July, while pending sales of 3,938 run 27.8% above last year, the spring pipeline is still converting.
• Pricing strengthened across the board: median sale price $1.33M (+7.6% YoY, the best of 2026) and PPSF $1,483 (+4.2% YoY), June’s mix-shift dip fully reversed.
• The listing discount held at 3.8% (+0.1 pts MoM and YoY), negotiating room stays near multi-year lows even in the slow season.
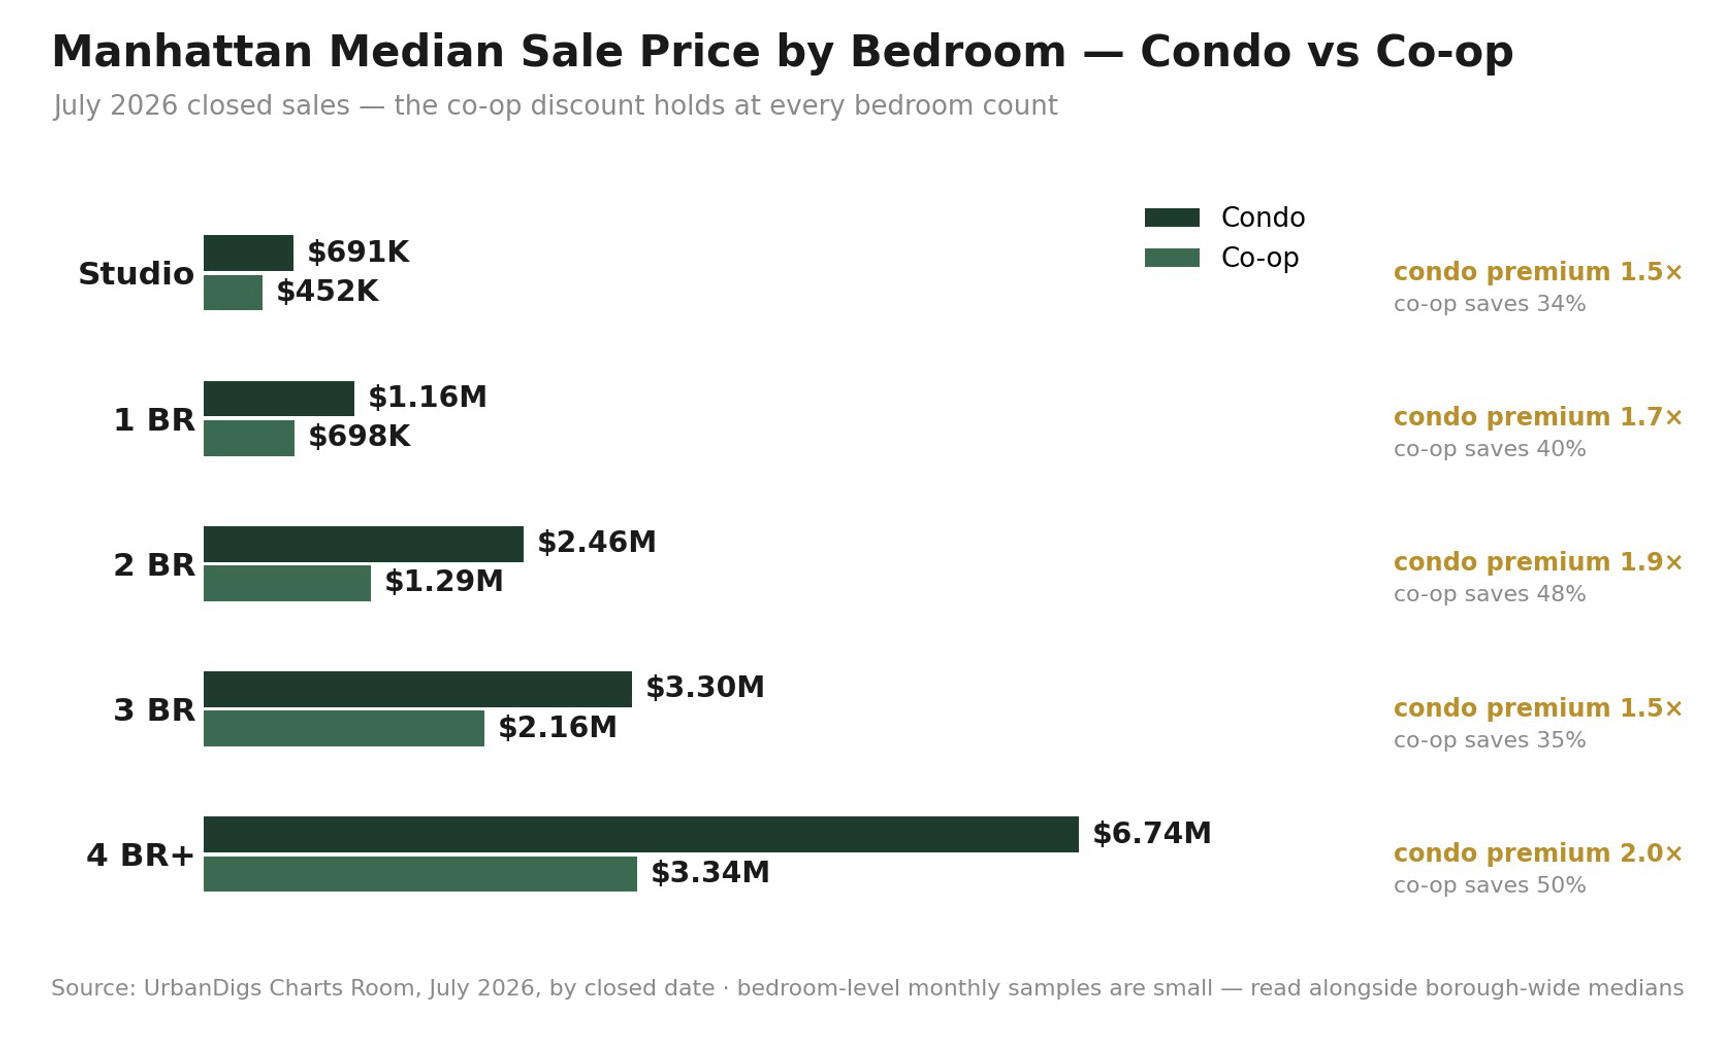
• Bedroom-level data: condo 2BRs printed +27.0% YoY (small sample, read directionally); larger co-ops (3BR –6.7%, 4BR+ –17.7%) remain the softest corner of the market.
• A data caveat worth flagging: recorded closed-sale counts (339, –68% MoM) reflect public-record recording lag on the most recent month, not a genuine drop in activity.
• Days on market fell to 65, down 3.0% from June and 1.5% below last July, absorption is quickening even as transaction volume thins seasonally.
Outlook
Manhattan heads into August with scarcity doing the work: fewer listings, quickening absorption, and prices at 2026 highs. September’s listing wave is the next real test, if new supply returns near normal levels while the pending pipeline converts, conditions stay seller-leaning; a heavier wave would hand buyers their first real selection improvement since spring.
■ For Sellers: Scarcity is your tailwind, but it cuts both ways, fewer competing listings, yet a thinner buyer pool until after Labor Day. Accurately priced listings still convert: 17% of May sales closed above ask.
■ For Buyers: August is the quietest competitive window of the year: less bidding pressure per listing, though also the thinnest selection. With jumbo APRs at 6.73%, negotiating price beats waiting for financing relief the Fed is not signaling.
Howard Hanna NYC Manhattan Leverage Index
The Howard Hanna NYC Manhattan Leverage Index tracks four market signals, supply, demand, median PPSF, and median listing discount, to gauge the balance of power between buyers and sellers. Tightening supply, accelerating demand, firming PPSF, and compressing discounts all point toward sellers; the reverse combination points toward buyers.
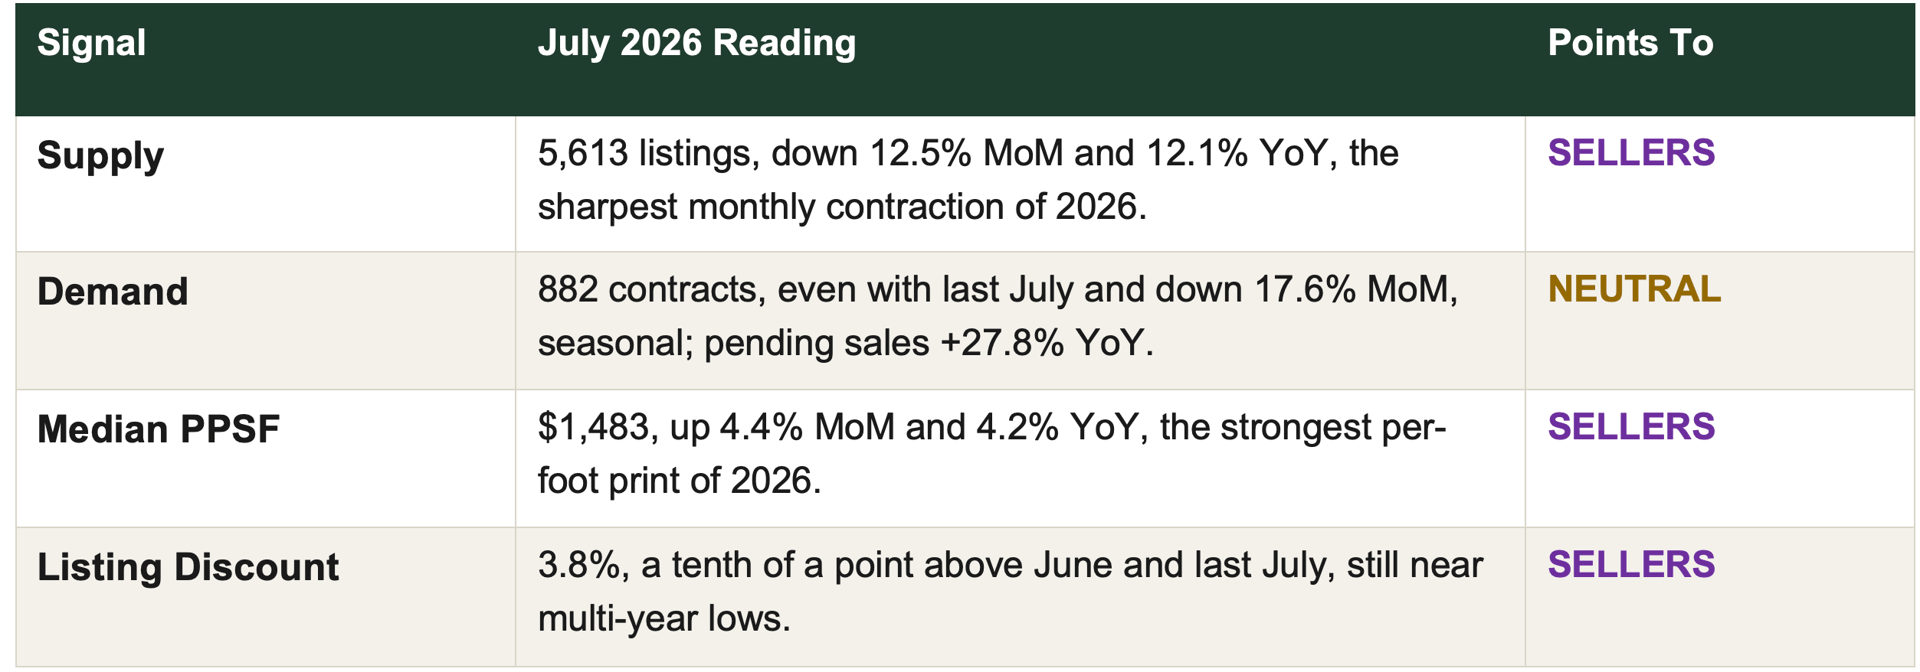
Three of the four inputs still point to sellers in July. The index itself eased to 0.68 from June’s 0.75, its 2026 high, as the demand input went seasonal. Readings this high have marked seller-leaning conditions all year, and the curve’s direction since January remains upward. Source: Howard Hanna NYC Leverage Index 2026, data courtesy of UrbanDigs.
Manhattan Supply
SUPPLY CONTRACTS SHARPLY, THE DEFICIT WIDENS TO 12%
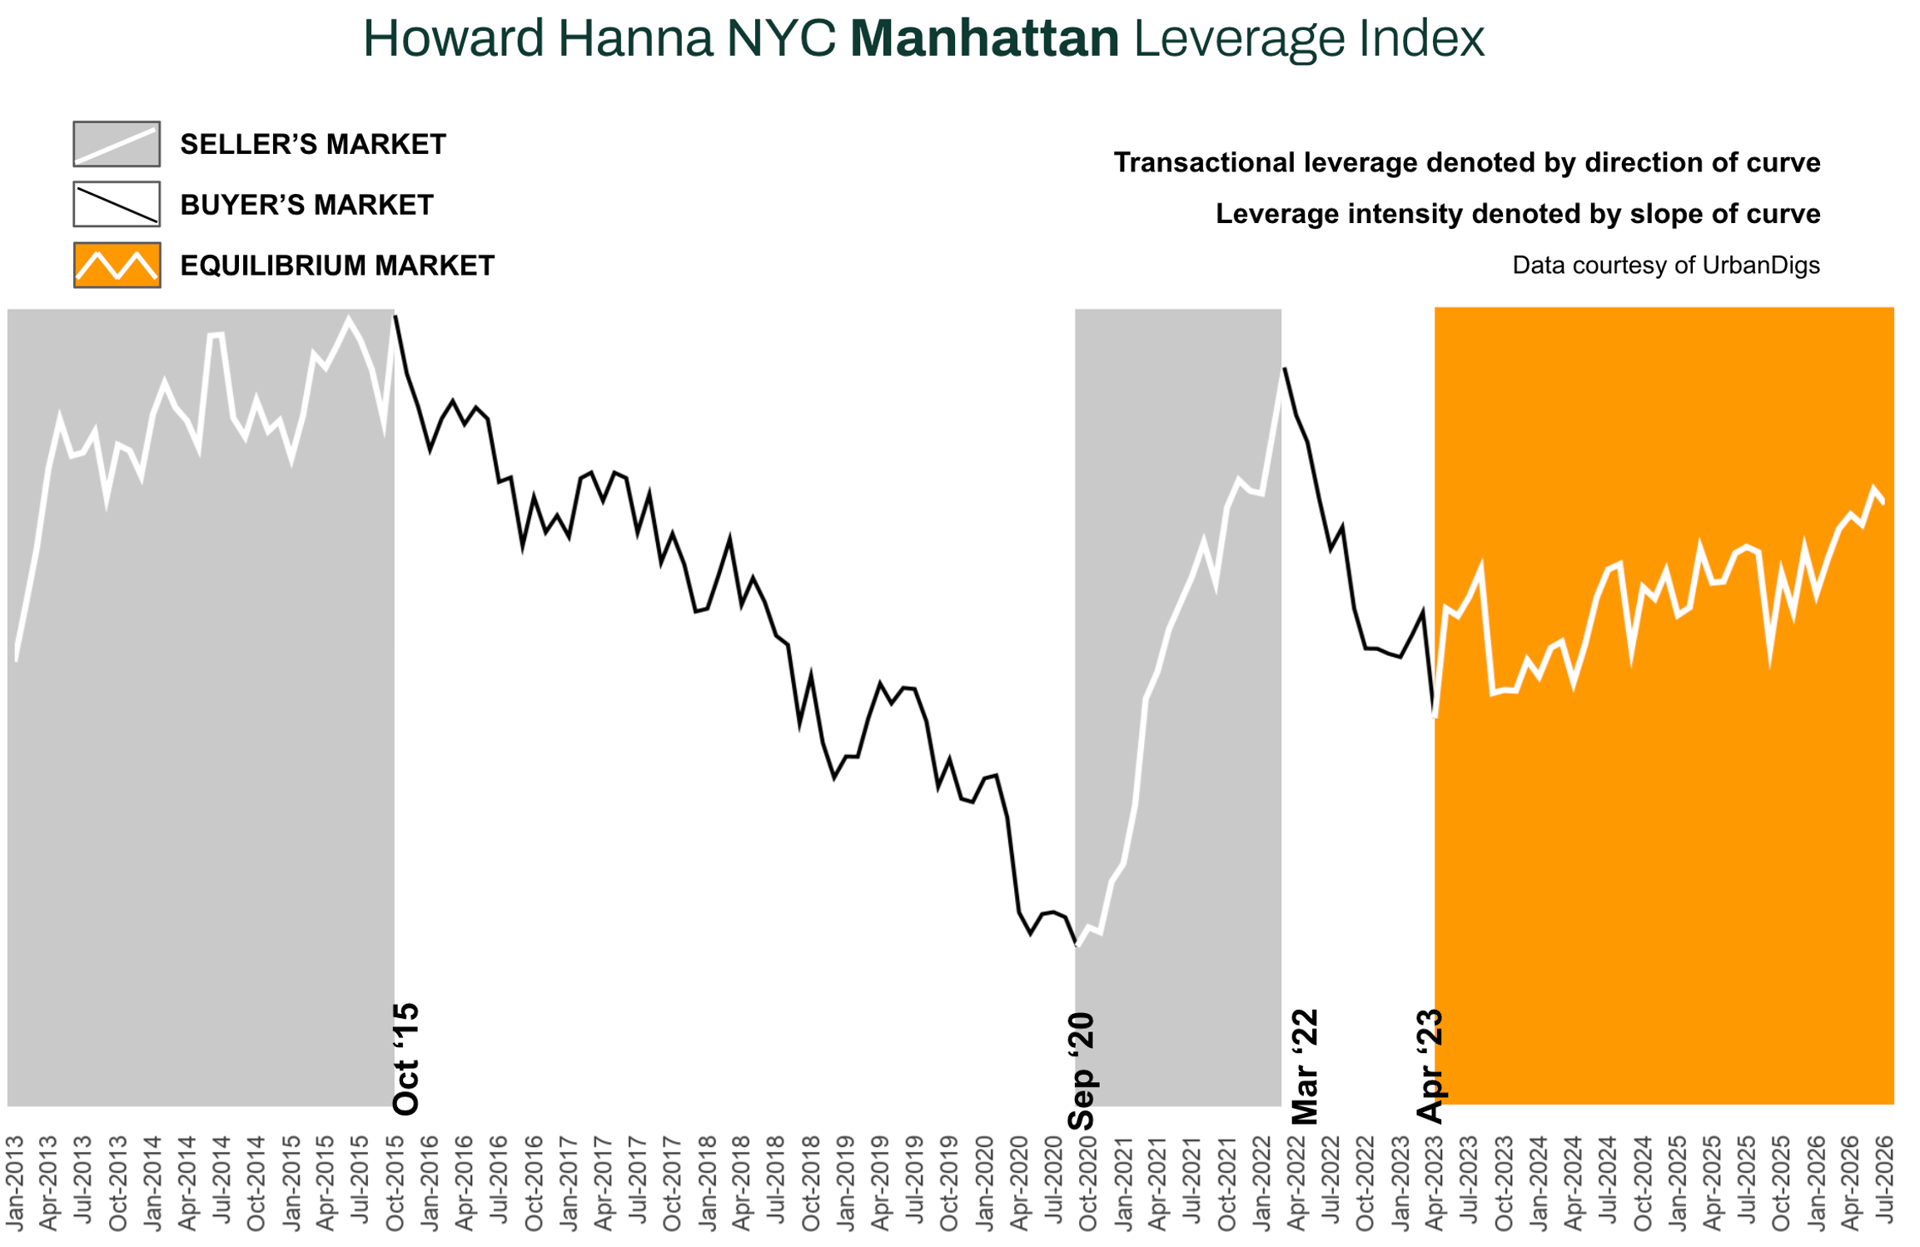
Active Manhattan listings fell to 5,613 in July, down 12.5% from June and 12.1% below last July, the sharpest monthly contraction of 2026. The squeeze came from both directions: new listings dropped 29% from June, and the borough recorded a net loss of 985 homes as off-market moves outpaced fresh supply. As the chart shows, inventory now sits far below the 8,000–9,000 range that defined pre-2020 summers.
■ Buyers: Selection is the thinnest it has been all year. When a well-priced listing does appear, competition concentrates on it quickly, 17% of May sales closed above ask.
■ Sellers: Scarcity is doing real work for you. A listing priced accurately today faces the least competition of 2026.
Outlook: Supply should stay tight through August; the September listing wave is the next real test. If it arrives light, the deficit carries straight into the fall market.
Manhattan Demand
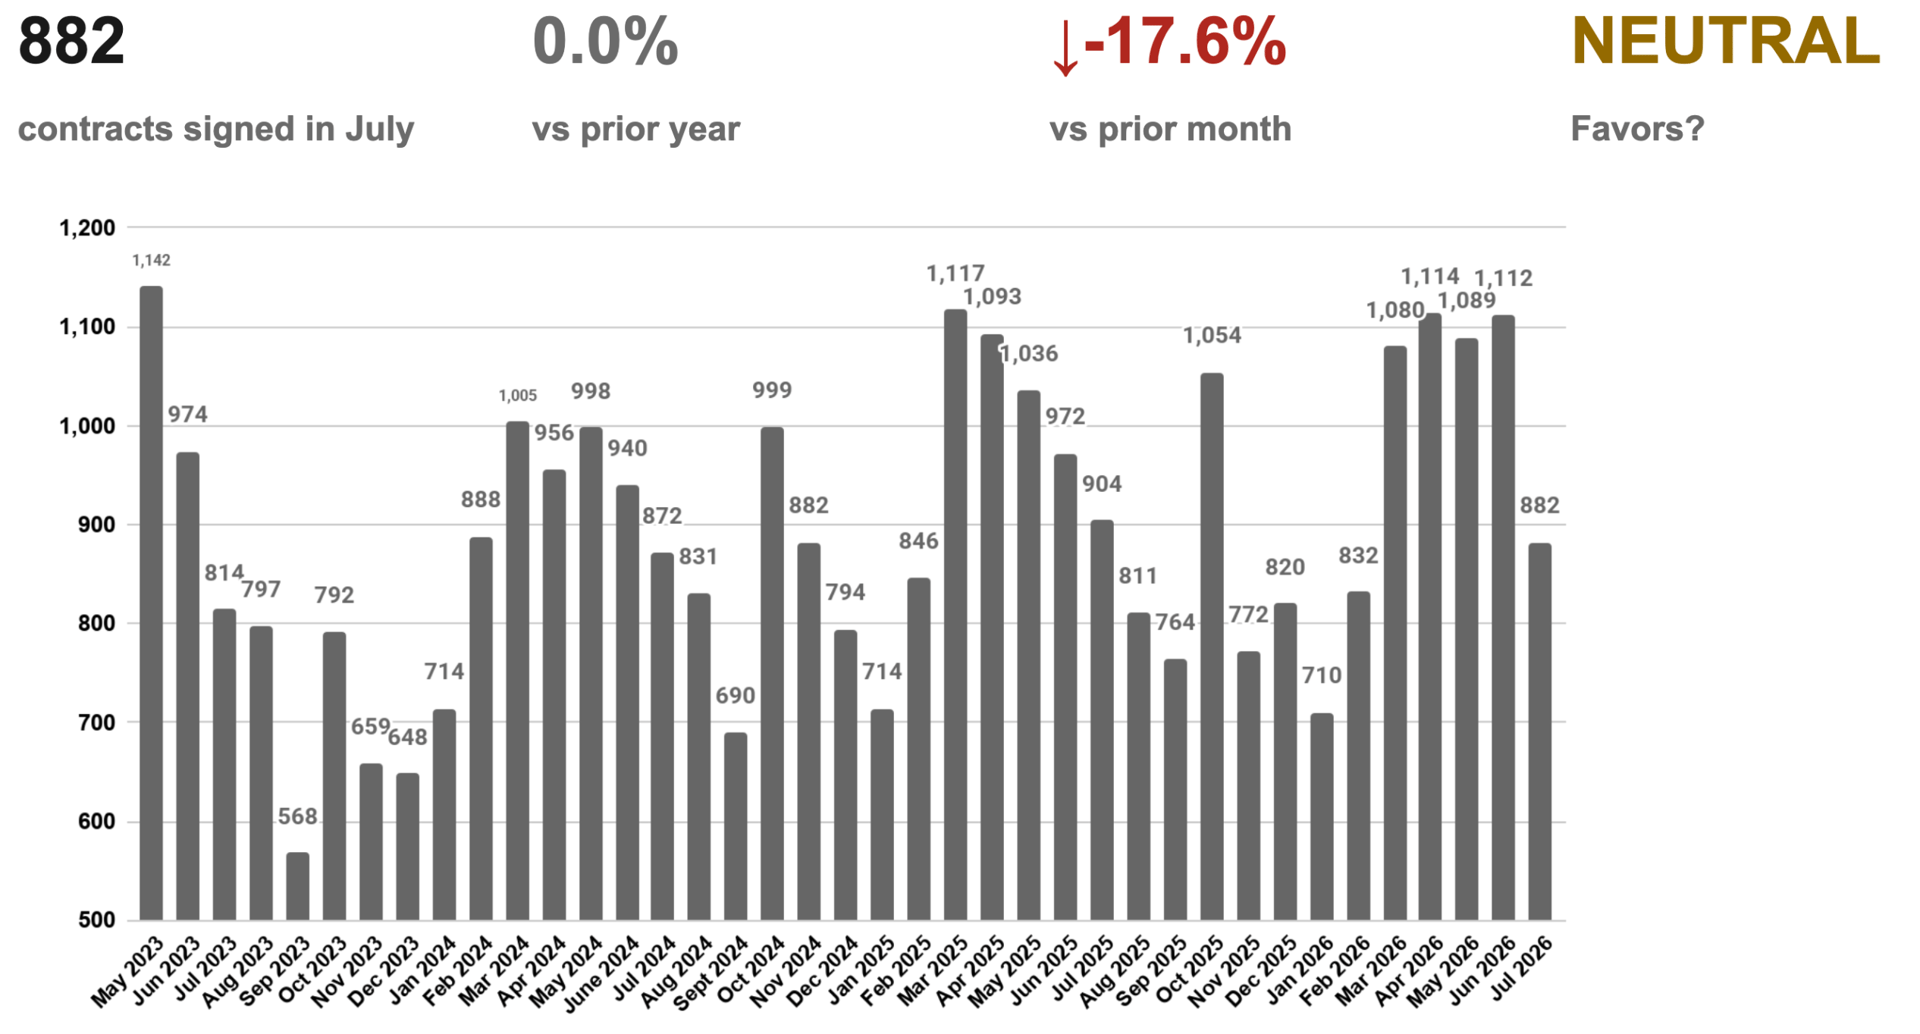
CONTRACTS DOWNSHIFT WITH THE SEASON, EVEN WITH LAST JULY
July brought 882 signed contracts, down 17.6% from June and exactly even with July 2025. After June’s +14.9% surge, this is the seasonal rhythm asserting itself rather than a demand break: pending sales, at 3,938, remain 27.8% above last year, and months of inventory actually fell to 5.8 as supply contracted faster than demand.
■ Buyers: The quietest competitive window of the year is open. Sellers who list in August are motivated sellers.
■ Sellers: Flat year-over-year contracts against a 12% supply deficit still leaves the balance in your favor, but the August buyer pool is thinner. Price for the room.
Outlook: Expect activity to stay muted through Labor Day, then re-accelerate. A pending pipeline 27.8% above last year points to a firm close to Q3.
Manhattan Median PPSF
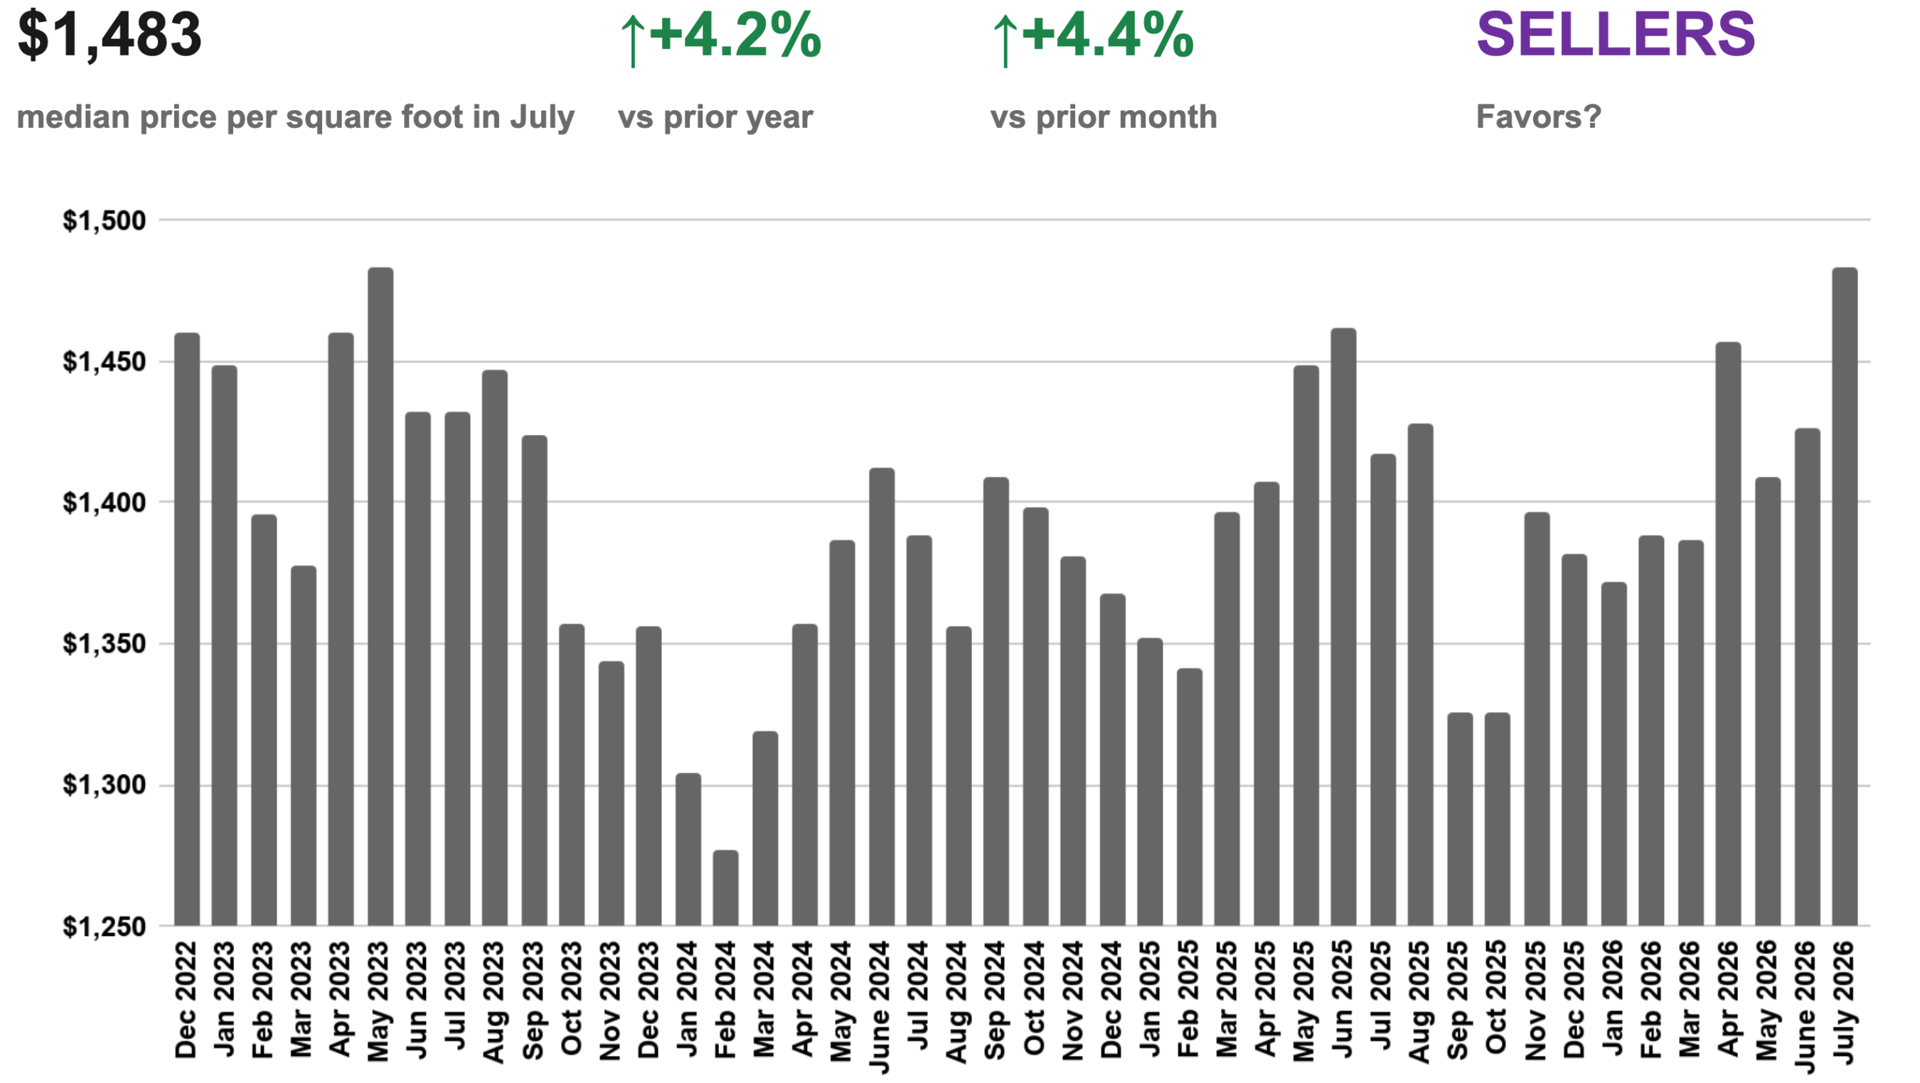
PER-FOOT PRICING SNAPS BACK TO A 2026 HIGH
Median PPSF jumped to $1,483 in July, up 4.4% from June and 4.2% year-over-year, fully reversing June’s mix-driven dip and setting the strongest per-foot print of 2026. With the median sale price at $1.33M (+7.6% YoY), July’s pricing strength was broad rather than a single-segment artifact, led by condo two-bedrooms.
■ Buyers: The window where mix-shift made headline pricing look soft has closed. Genuine negotiating room is concentrated in larger co-ops, the one segment still repricing.
■ Sellers: The strongest pricing month of the year. Comparable-based pricing can lean confident, though not aspirational, as the discount data shows buyers still walk from stretch pricing.
Outlook: Prints in the $1,450–$1,500 range look sustainable through Q3 given the supply backdrop. The September listing wave is the main variable to watch.
Manhattan Median Listing Discount
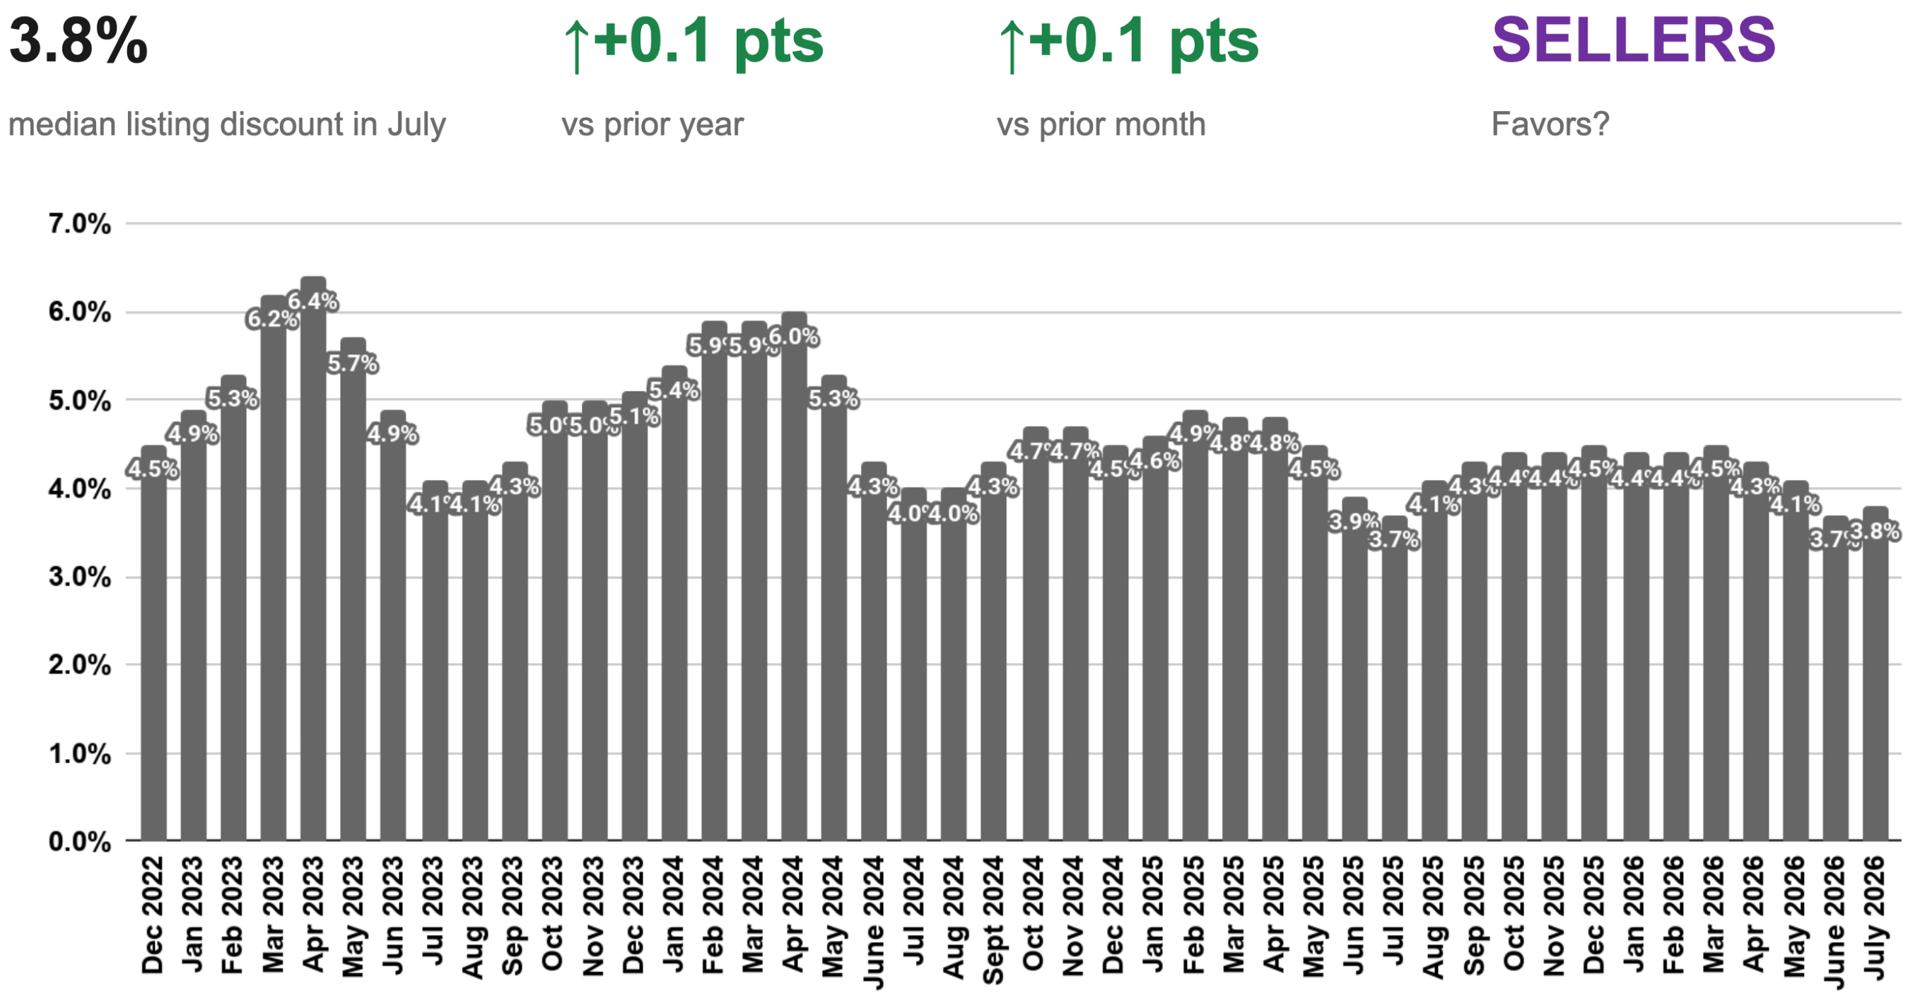
NEGOTIATING ROOM STAYS NEAR MULTI-YEAR LOWS
The median listing discount held at 3.8% in July, a tenth of a point above both June and last July. In dollar terms, a buyer of a $1.5M listing is negotiating roughly $57,000 off final asking, modest by historical standards, and consistent with 17% of May sales closing above asking entirely.
■ Buyers: Come in with a clean, competitive offer. The data does not support anchoring to a deep discount on a well-priced listing.
■ Sellers: Pricing power remains firm. Accurately priced listings are converting near ask, and a meaningful share are exceeding it.
Outlook: With supply contracting and pricing firm, the discount should hold in the high-3% range through the summer. A meaningful widening would require the fall listing wave to land heavy.
Rental Remarks
ASKING RENTS AT $4,965: GROWTH COOLS TO +5.1% AS SUPPLY BUILDS
Manhattan’s median asking rent reached $4,965 in June, up 0.8% from May and 5.1% year over year. Two things changed under the surface. Annual rent growth cooled from May’s 7.2%, and supply loosened for the first time in months: active inventory climbed 8.8% on the month to 16,538 units, cutting the annual deficit from 13% to 4.4%. The share of listings taking a price cut rose to 14.0% from 12.4%. Rents are still rising, but the one-way pressure of the past year is easing at the margin.
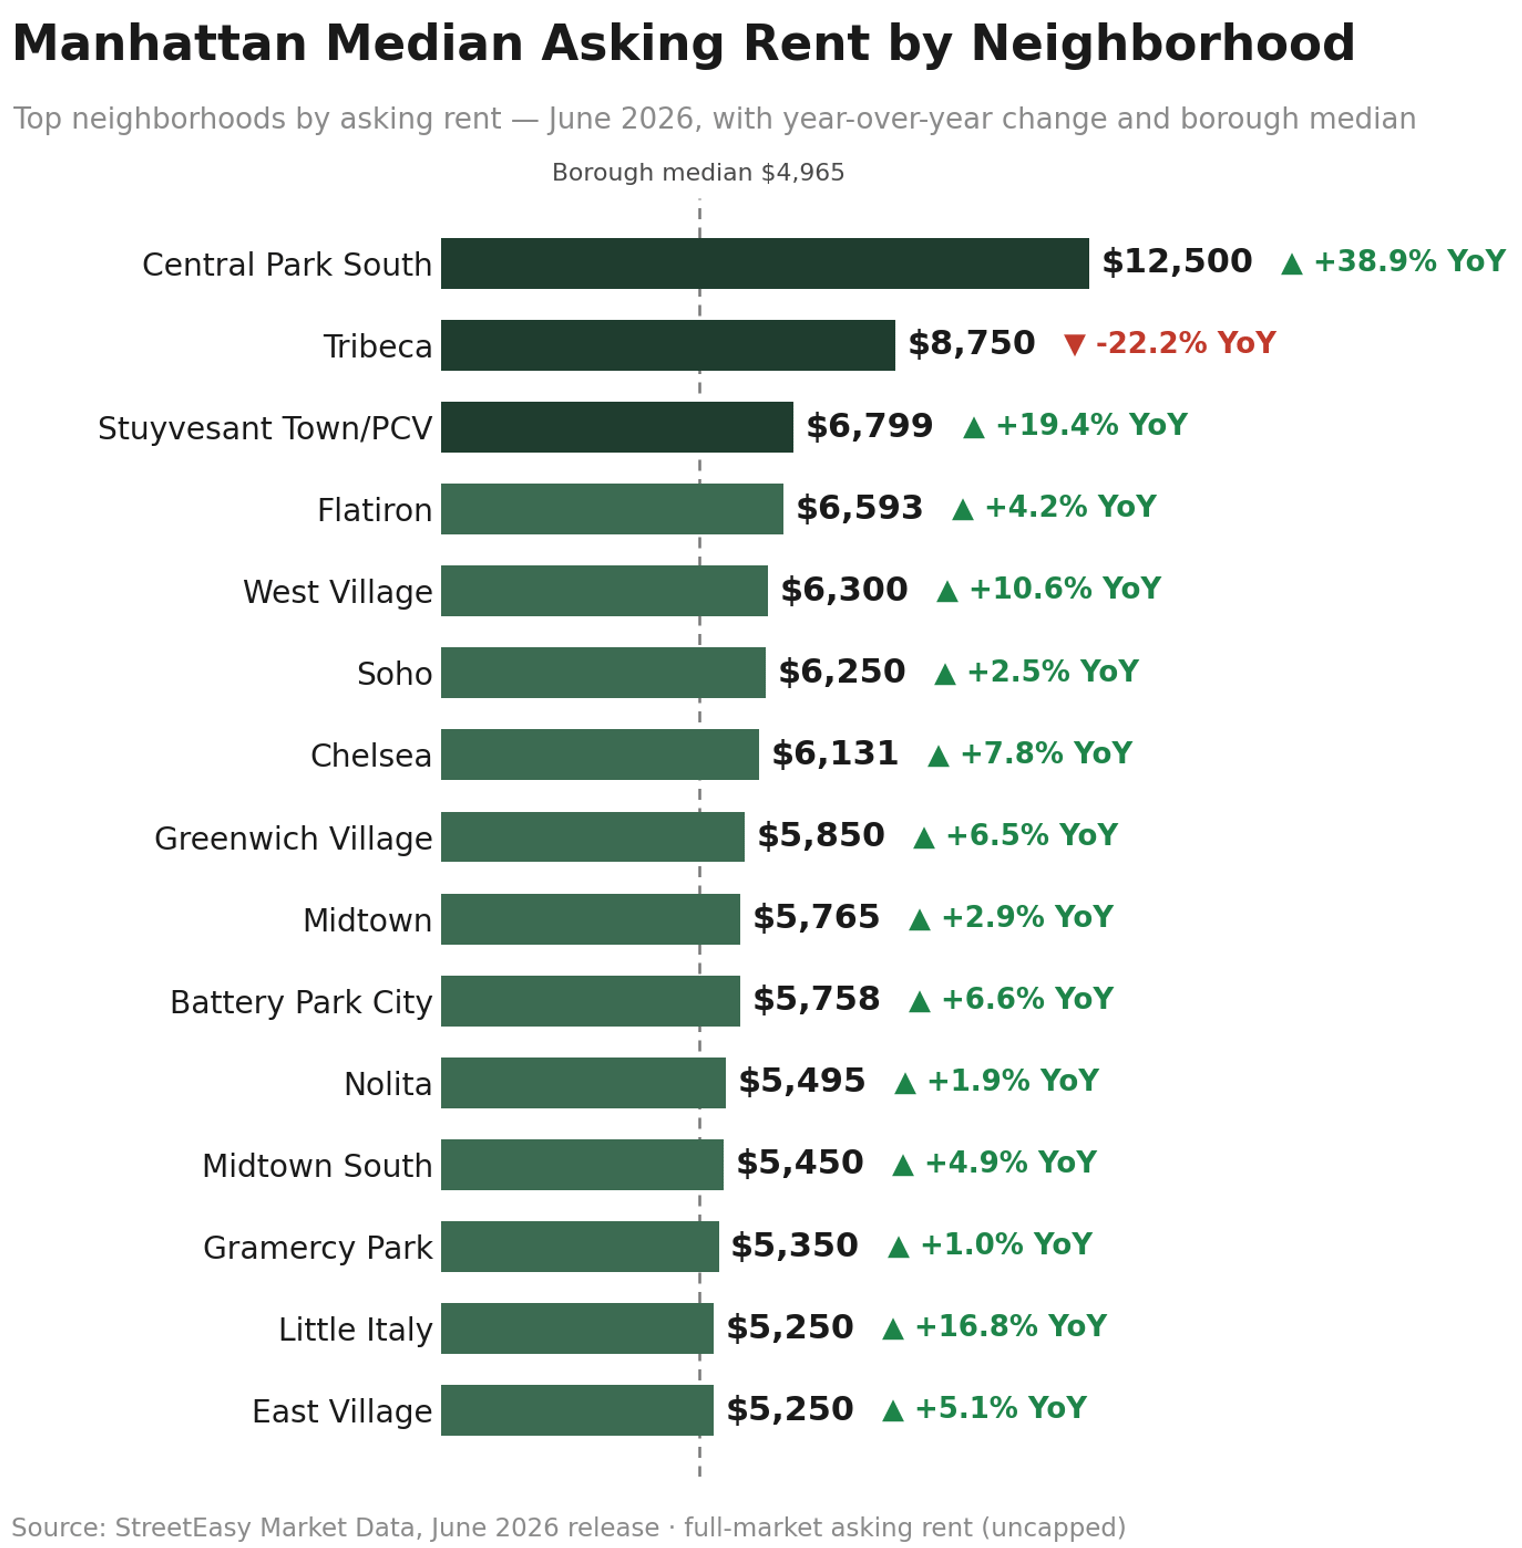
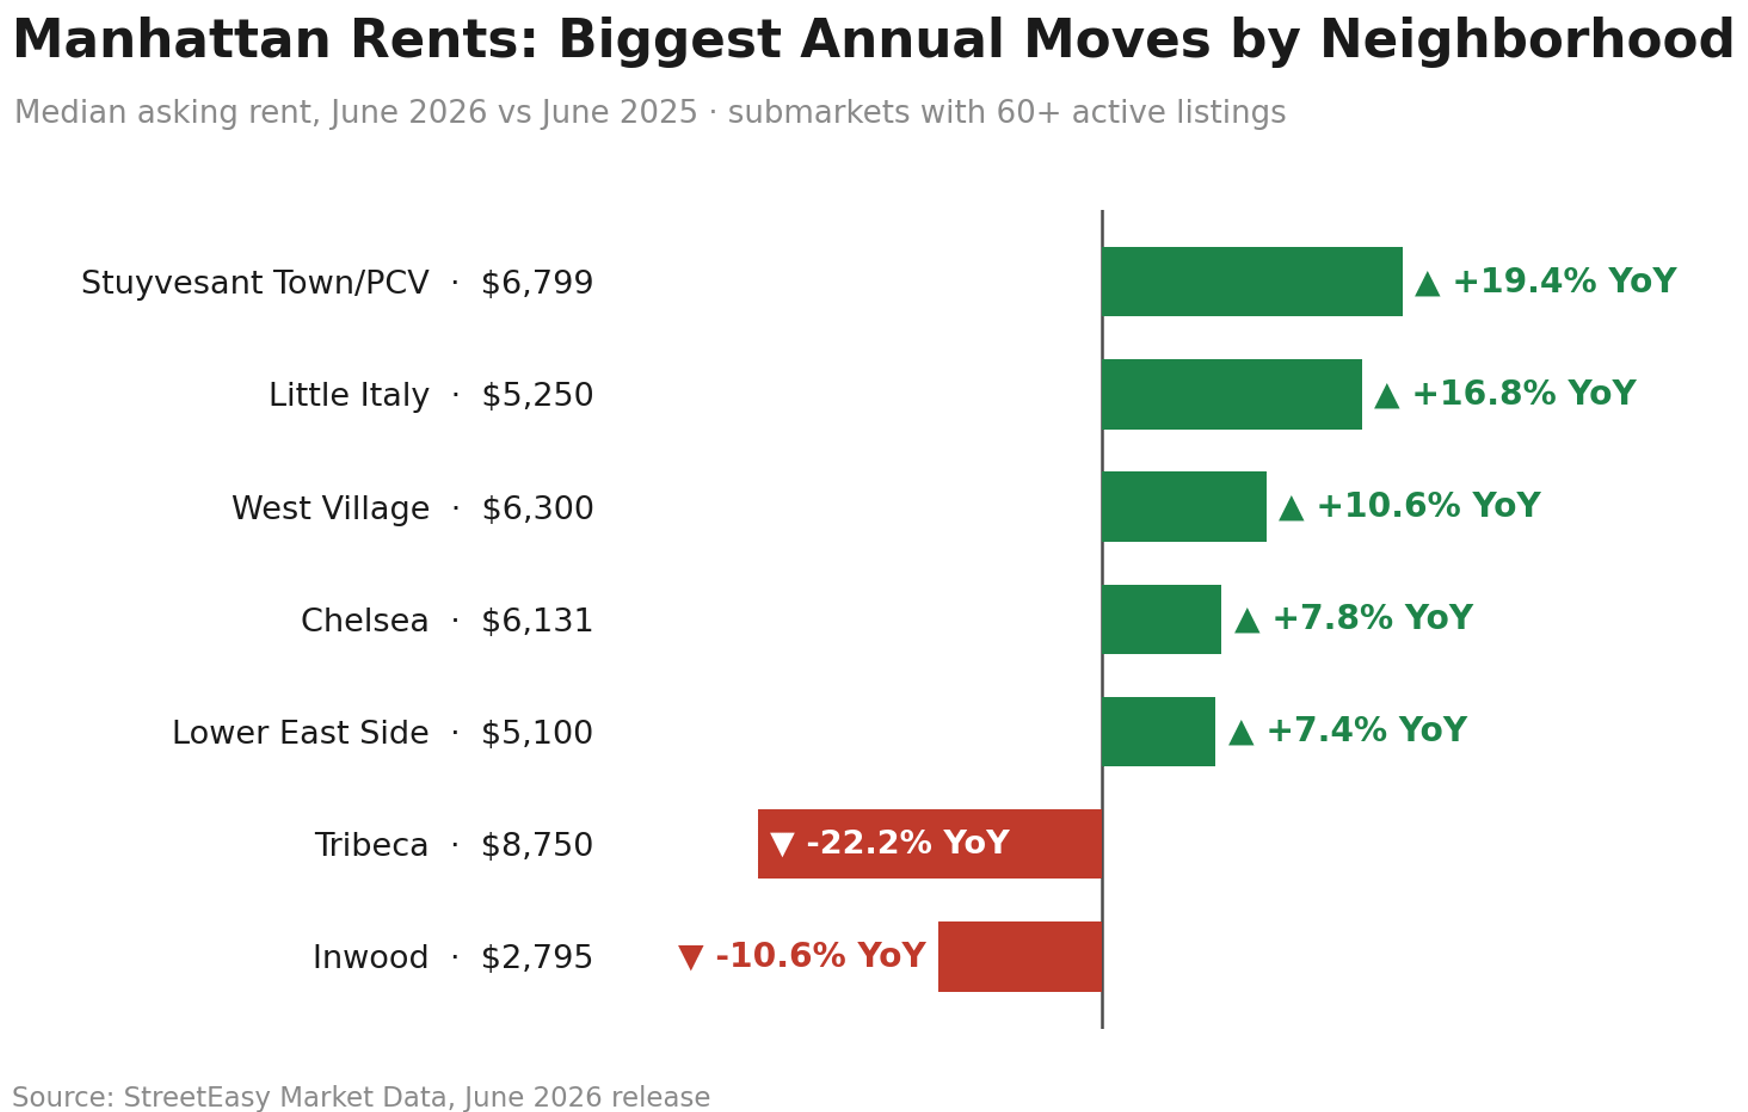
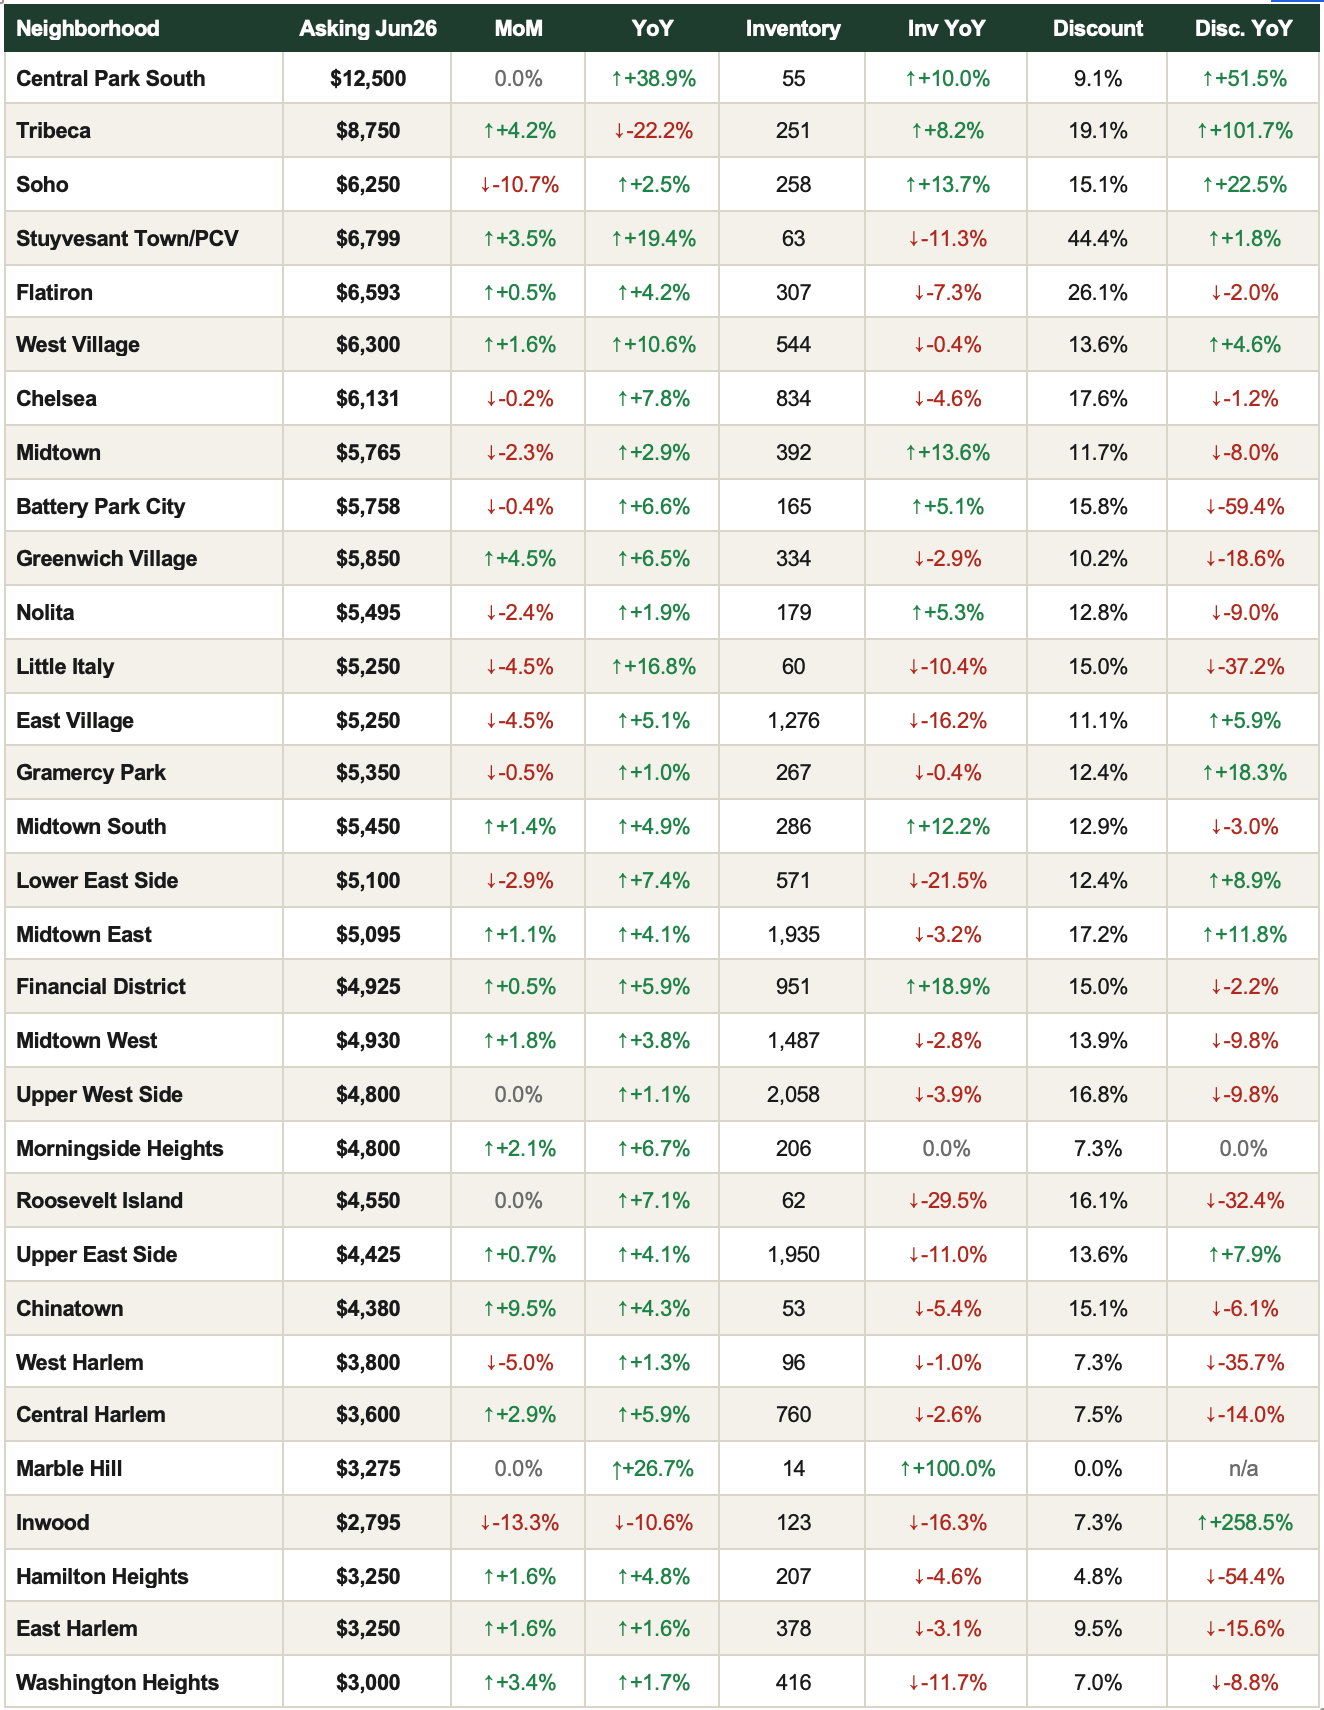
Central Park South leads on price at $12,500, up 38.9% year over year on a thin ultra-luxury market of about 54 listings. The micro-market moves tell the sharper story: Stuyvesant Town/PCV (+19.4%), Little Italy (+16.8%) and West Village (+10.6%) lead the gainers, while Tribeca ($8,750, down 22.2%) and Inwood (down 10.6%) posted the largest declines. Spreads this wide are why building-level comps matter more than borough averages in a lease negotiation.
■ For Renters: The first real breathing room of 2026. Inventory is up 8.8% on the month and 14% of listings are cutting price. Negotiate hardest where supply is building; move fast in the outperformers above.
■ For Landlords: Rents are still up 5.1% year over year, but rising supply and a higher price-cut share argue for precise pricing into late summer rather than stretch asks.
Outlook: Peak leasing season meets rising supply. Expect annual rent growth to keep moderating toward the mid single digits through Q3, with wide neighborhood dispersion the defining feature.
Source: StreetEasy Market Data, June 2026 release · median asking rent, active rental inventory, discount share · full market, uncapped · 31 Manhattan submarkets shown.
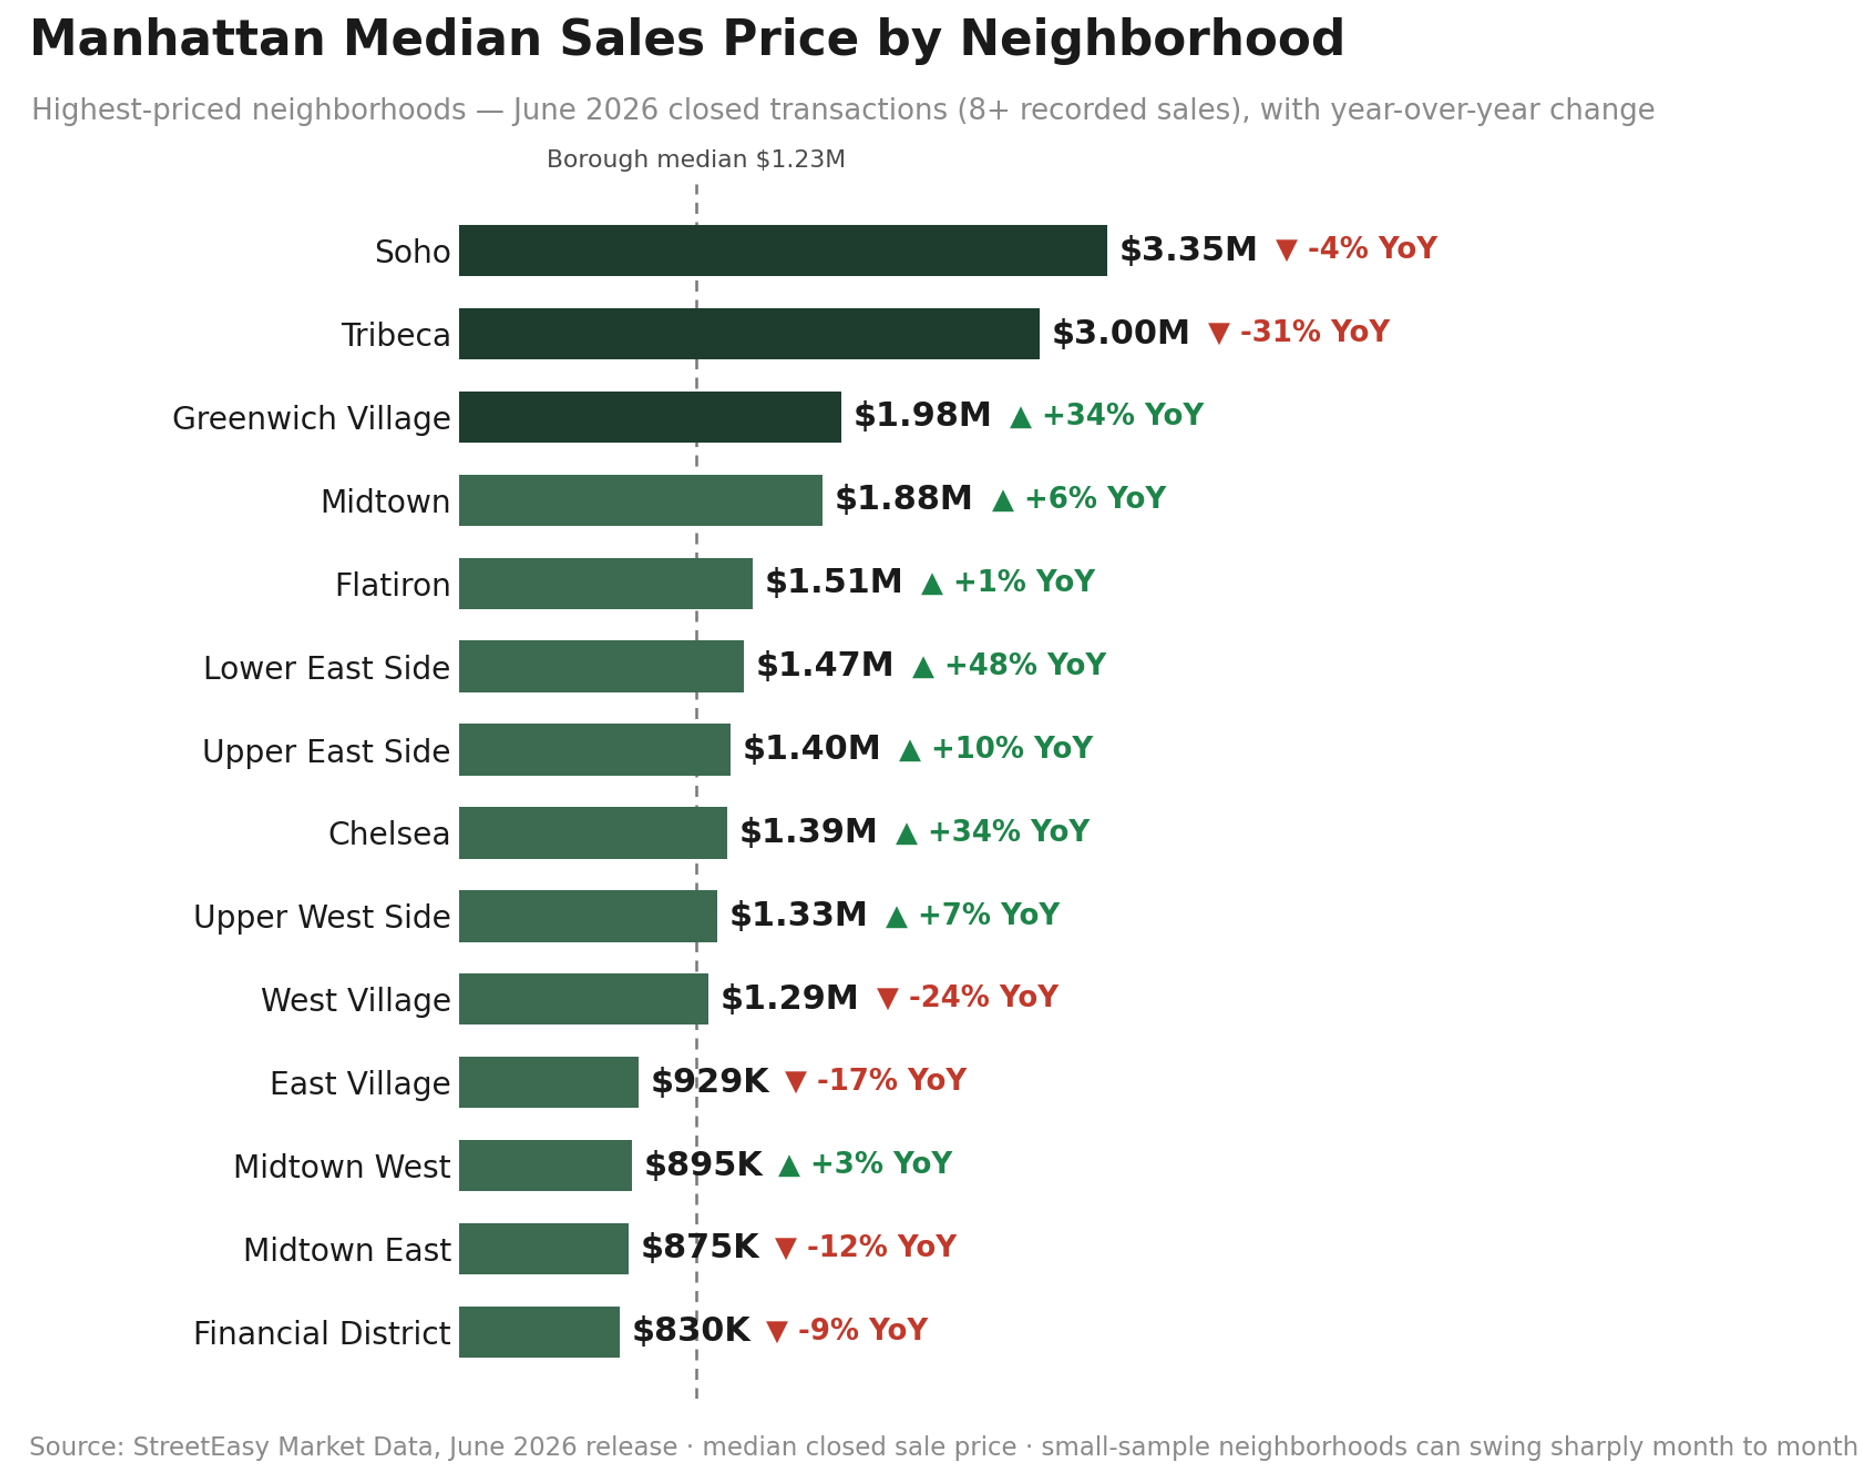
StreetEasy’s June closings put the borough median at $1.23M. Among submarkets with at least eight recorded sales, Soho leads at $3.35M, ahead of Tribeca ($3.00M) and Greenwich Village ($1.98M). Monthly samples at the neighborhood level stay small, so read these alongside the borough-wide UrbanDigs figures above.
Mortgage Remarks
JUMBO APRS AT 6.73%: THE HIGHEST OF 2026
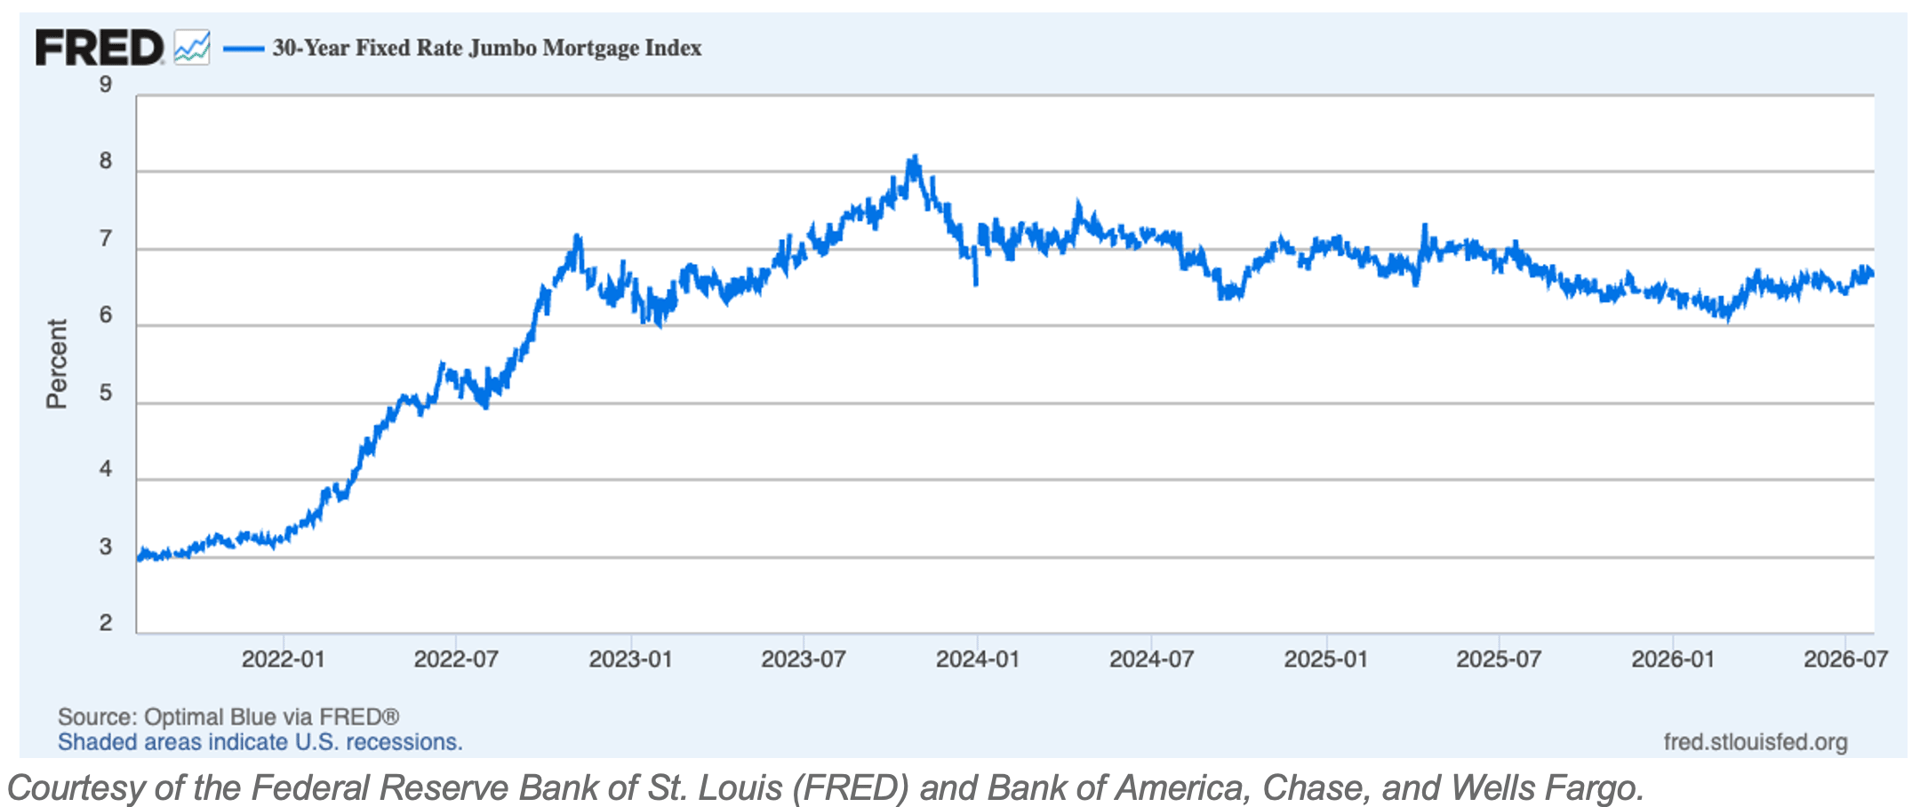
Thirty-year jumbo APRs at the major banks averaged 6.73% as of August 3, per our tracker of Bank of America (6.85%), Chase (6.61%) and Wells Fargo (6.75%). That is up from 6.57% in early June and 6.07% in late February, the highest of 2026. The FRED chart below shows the broader jumbo index in the mid-6s: well below the 2023 peak above 8%, but a full point above this year’s low. The Federal Reserve held at 3.50%–3.75% on July 29 for a fifth straight meeting, with three members dissenting in favor of a hike.
■ Buyers: Underwrite at 6.75%, not the 6.1% of last winter. On a $1M loan that gap adds roughly $430 a month. Negotiating price beats waiting for relief the Fed is not signaling.
■ Sellers: Manhattan’s equity-heavy buyer pool is the most rate-insulated in the country, one reason demand held flat while APRs climbed. Below $1.5M, where financing does the work, price with more care.
Outlook: With three FOMC dissents arguing for a hike and year-end projections of 3.6%–4.1%, the base case is jumbo APRs holding in the high-6s into the fall. A 7-handle is the risk case. Rate-sensitive demand thins first at the entry level; the top of the market barely notices.
Investor Insights
Currency and International Demand
The dollar’s June breakout partially unwound in July: the dollar index ended the month just below 100, with EUR/USD near 1.15, leaving the greenback roughly flat on the summer. For European and UK buyers, New York is neither the bargain of early spring nor meaningfully dearer than a month ago. The conversation with international clients is now about stability rather than momentum, pricing power, not currency, is doing the work.
Domestic Investors and Yield
The rent-versus-buy math is now moving in both directions at once. Carrying costs rose again as jumbo APRs hit 6.73%, while June rents cooled to +5.1% growth on rising rental supply. For buyers on the fence, renting got marginally easier to justify this month. For investors, the yield map below still clears most hurdles in the high-yield corridors, and Washington Heights now tops the borough.
New This Month: The Investor Yield Map
The yield map, updated for June: Washington Heights leads Manhattan at 6.9% gross ($3,000 median rent against a $525K median ask), edging out Midtown East (6.8%), still the deepest high-yield market with roughly 1,900 rentals and 1,300 sale listings, and Morningside Heights (6.8%). Battery Park City (6.5%) and Hamilton Heights (6.2%) round out the leaders. At the other end, Soho (1.9%) and Tribeca (2.4%) remain pure capital-preservation territory. Borough-wide, Manhattan screens at roughly 4.3% gross.
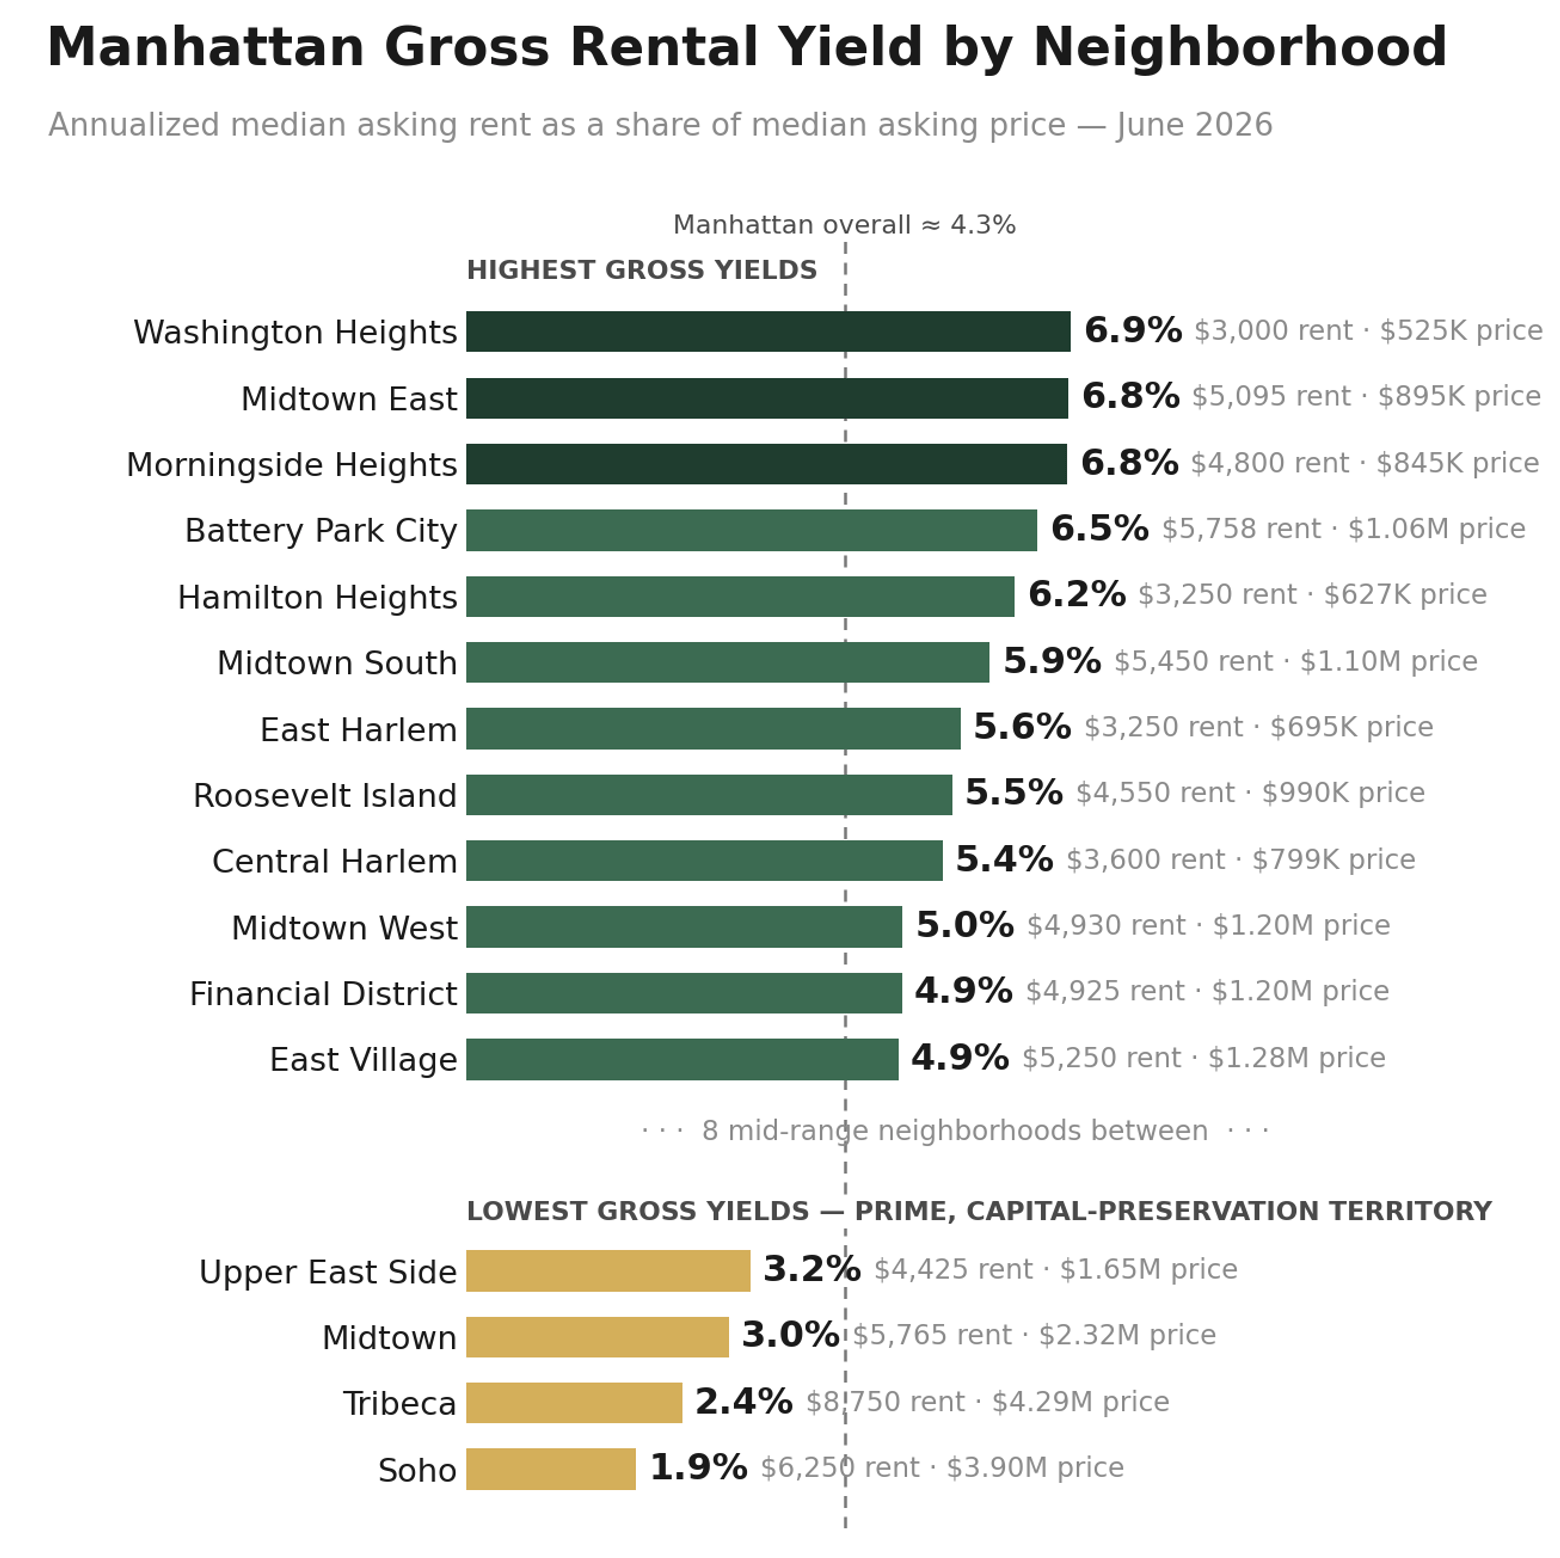
Method: gross yield = annualized StreetEasy median asking rent ÷ median asking price, both June 2026, same source and stage. A screening measure before property taxes, common charges, insurance and vacancy, not a cap rate. Submarkets with fewer than 50 active rentals or 30 active sale listings excluded.
The Manhattan PPSF Story
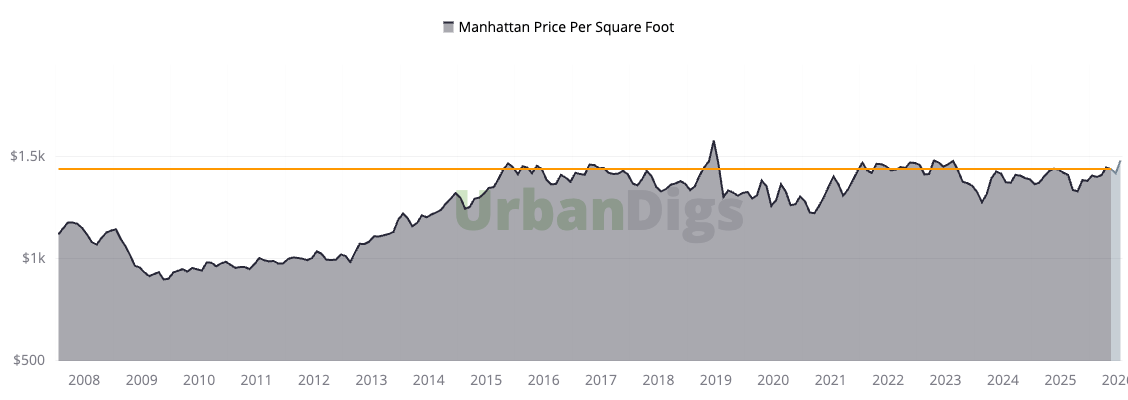
Manhattan’s median PPSF has traded in a remarkably narrow band for over a decade, from a post-financial-crisis trough near $950/sf to a sustained plateau above $1,300/sf in recent years, with July’s $1,483 print sitting at the very top of that band. This stability, not explosive appreciation, is Manhattan’s defining investment characteristic: a supply-constrained, deeply liquid market that has absorbed multiple macro shocks without a sustained repricing lower. For investors, the case remains capital preservation, currency diversification, and quality of asset, not speculative upside.
References
1. Sales and pricing data, Supply, Demand, PPSF, Listing Discount, Median Sale Price, Days on Market, Leverage Index inputs: UrbanDigs, July 2026 actuals.
2. Bedroom-level median sale price: UrbanDigs Charts Room, 5-year monthly series, by closed date.
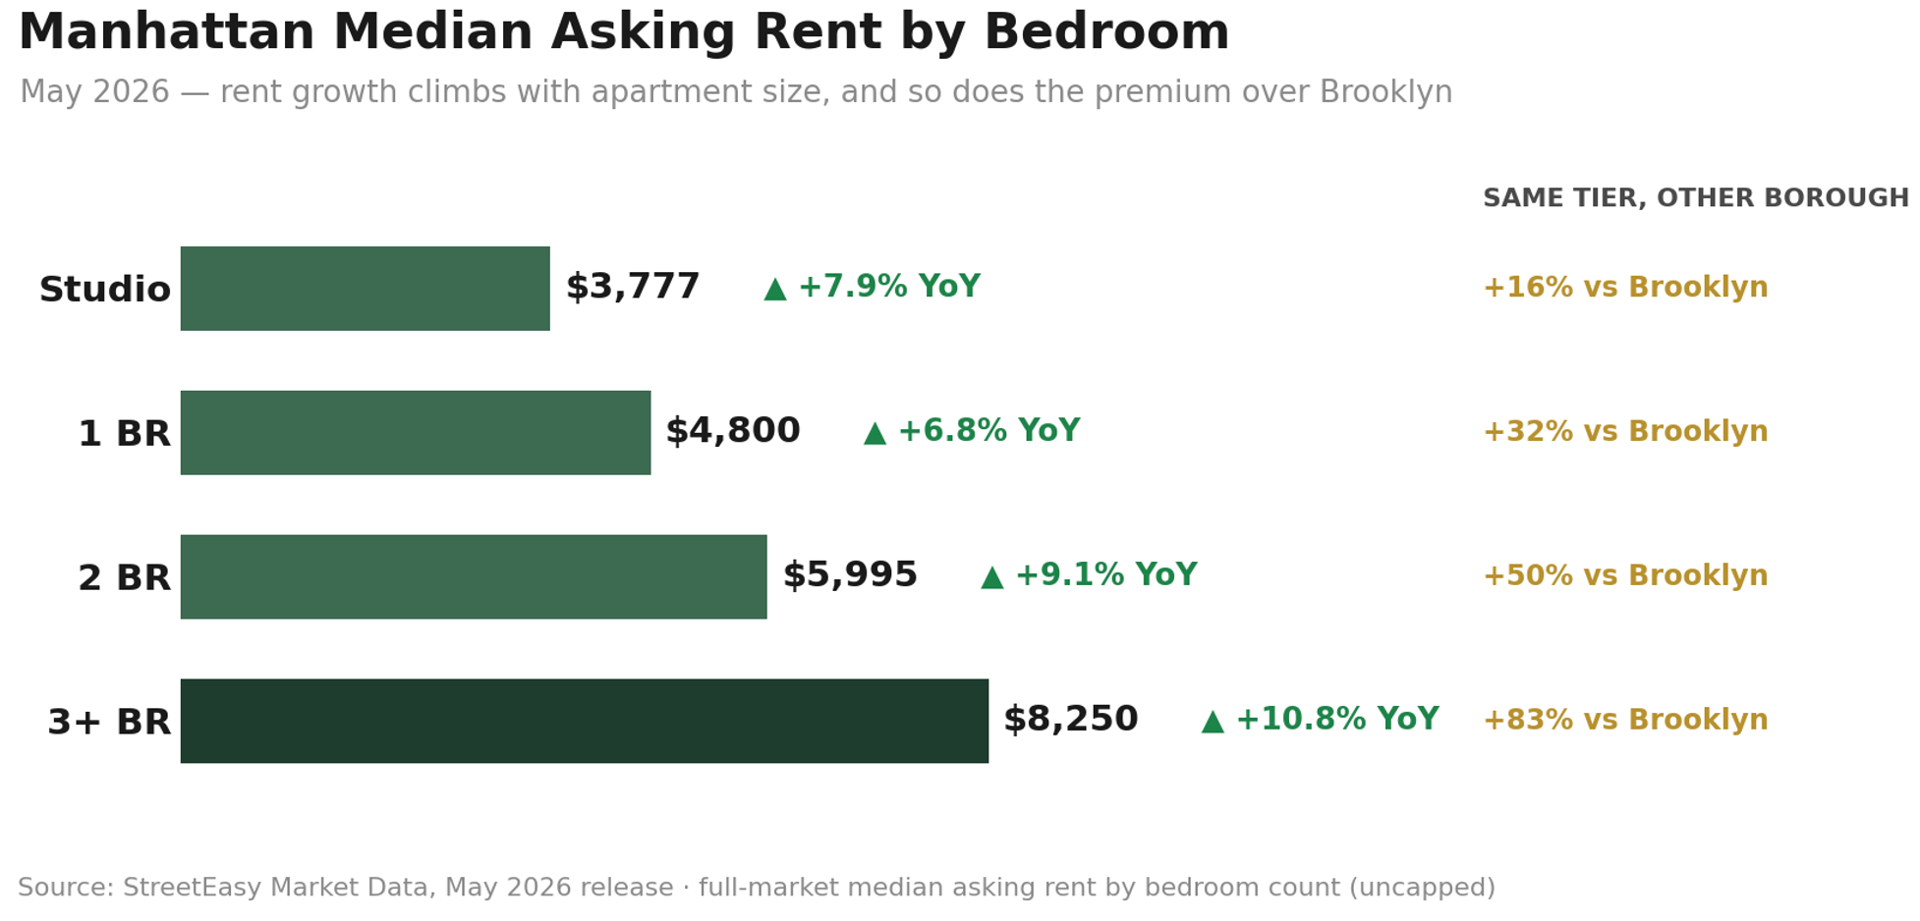
3. Rental data (asking rent, inventory, discount share, neighborhood table): StreetEasy Market Data, June 2026 release. Bedroom-level rent chart: May 2026 release.
4. Sales cross-check by neighborhood: StreetEasy Market Data, June 2026 release.
5. Mortgage rate data: Optimal Blue via Federal Reserve Bank of St. Louis (FRED); Howard Hanna NYC jumbo APR tracker (Bank of America, Chase, Wells Fargo), August 3, 2026.
https://www.federalreserve.gov/newsevents/pressreleases/monetary20260617a.htm6. Federal Reserve policy: Federal Reserve Board, FOMC statement, July 29, 2026. https://www.federalreserve.gov/newsevents/pressreleases/monetary20260729a.htm
7. Currency data: EUR/USD, GBP/USD, and U.S. Dollar Index market data, as of late July 2026.
8. Gross rental yield: annualized StreetEasy median asking rent ÷ median asking price, by neighborhood, June 2026 release. Screening measure; thin submarkets excluded (see chart footnote).
9. Leverage Index: Howard Hanna NYC Leverage Index 2026; inputs courtesy of UrbanDigs.
If you would like to chat about the most recent market activity,
feel free to contact us at [email protected] or connect with one of our Advisors.