
April 2026: MOMENTUM WITHOUT FRENZY
Manhattan's spring market is delivering exactly what disciplined observers expected — not a surge, not a retreat, but a steady, well-functioning market where preparation and execution matter more than timing. The Howard Hanna NYC Manhattan Leverage Index² edged modestly higher in March and remains in seller-leaning territory, supported by rising contract activity, persistent supply constraints, and pricing that continues to hold its ground.
Contracts jumped 30% from February to March. Inventory rose seasonally but remains nearly 10% below last year. Median sale prices are up year-over-year. This is a market that rewards conviction — from both buyers and sellers.
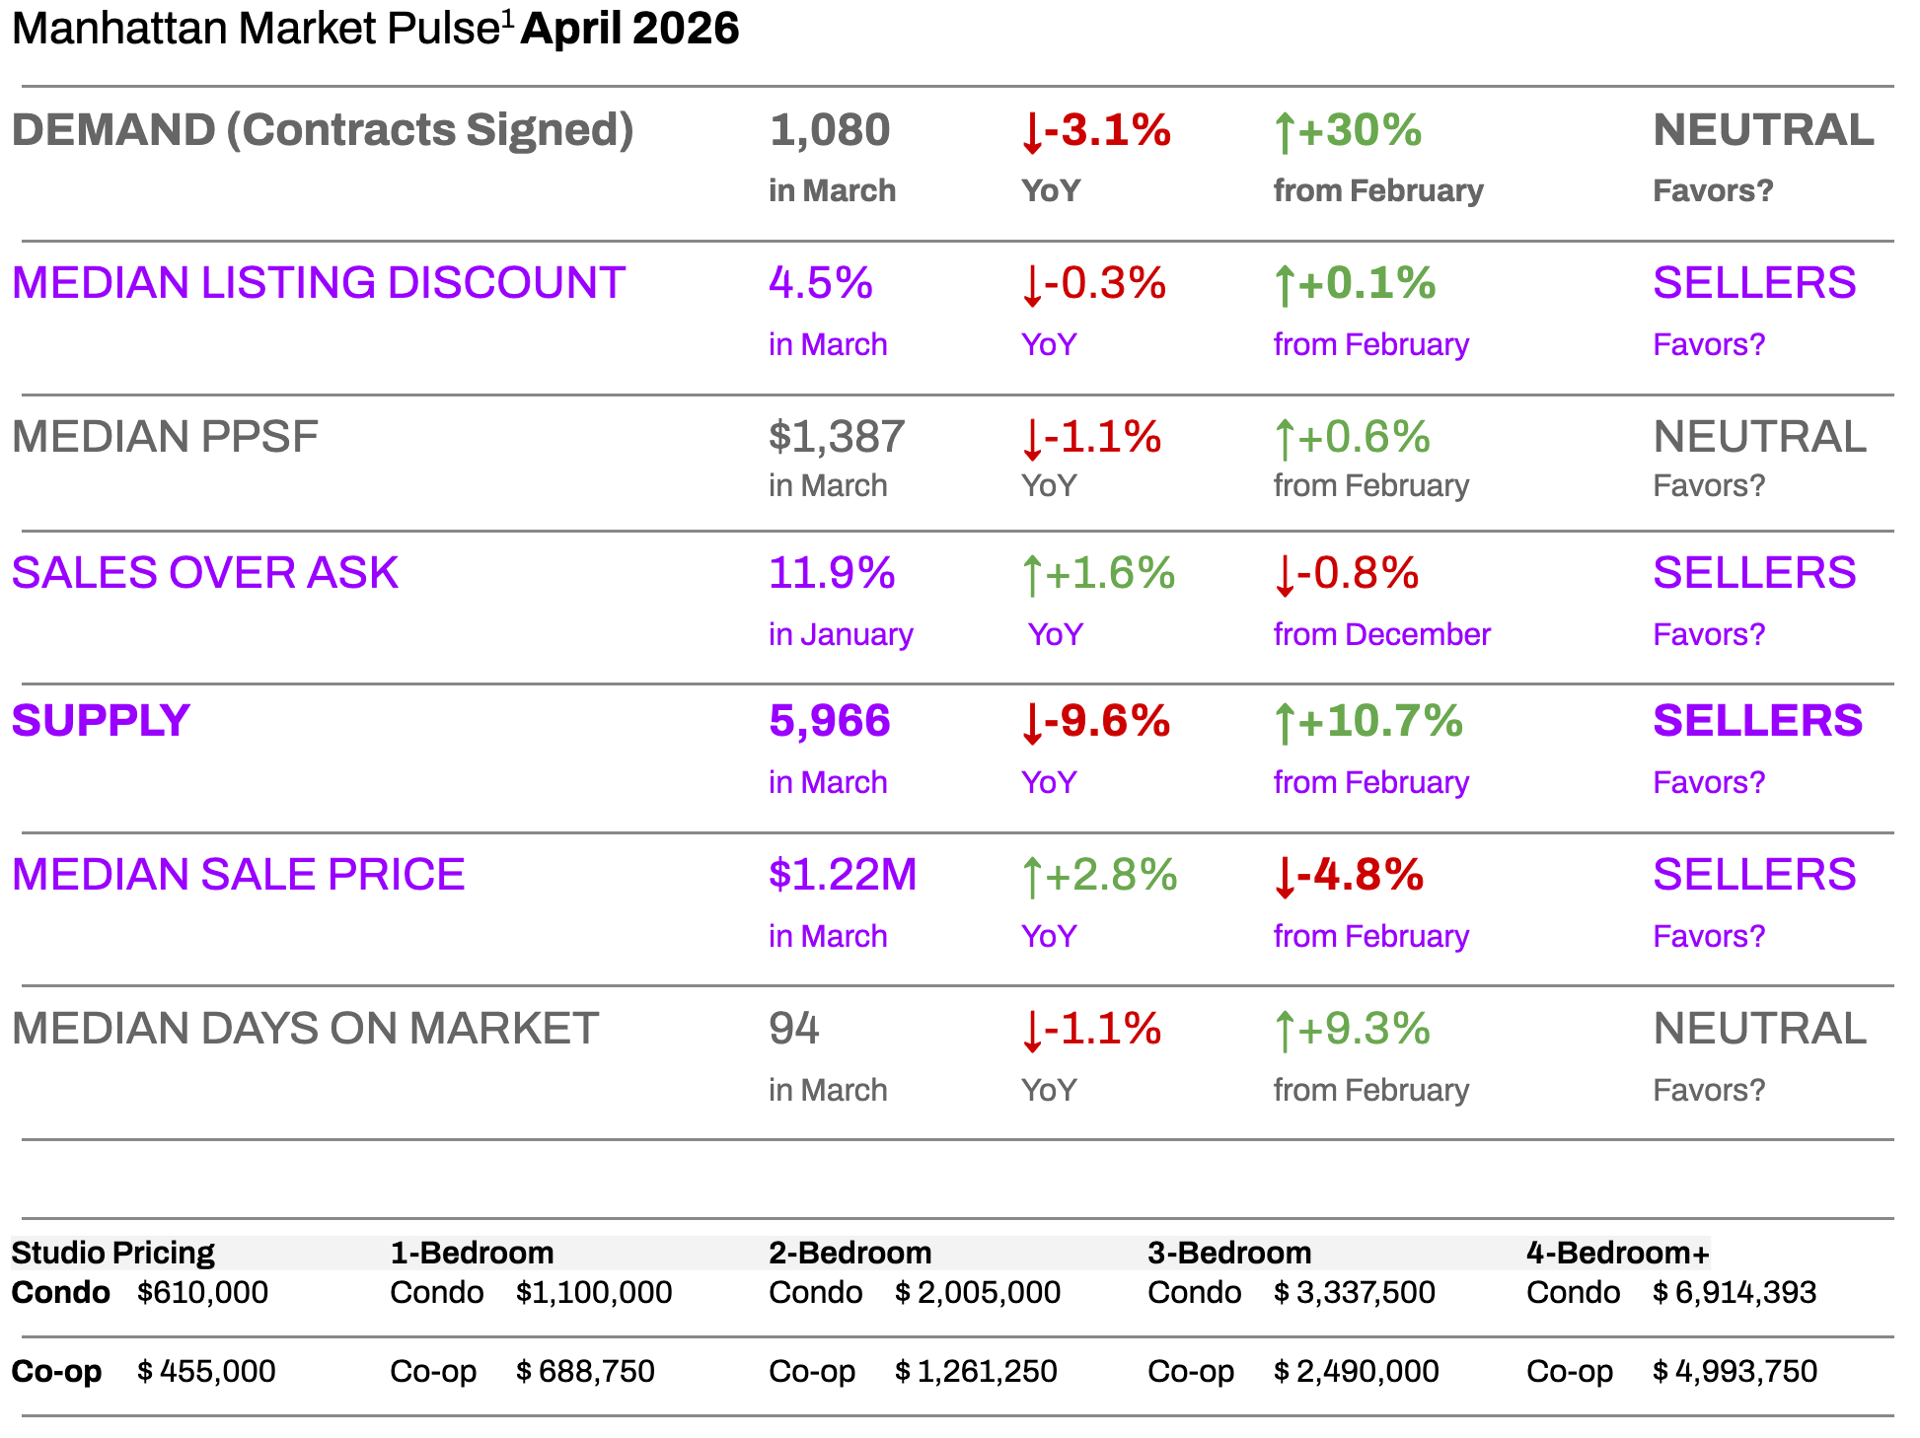
MARKET SNAPSHOT: FIVE NUMBERS THAT MATTER
-
1,080 contracts signed in March — a 30% month-over-month surge, confirming that spring demand is firmly underway.
-
5,966 active listings — up from February, but still 9.6% below this time last year. Supply is rising, but structurally constrained.
-
$1.22M median sale price — up 2.8% year-over-year. Prices are holding and appreciating, even as month-over-month fluctuations reflect the mix of properties closing.
-
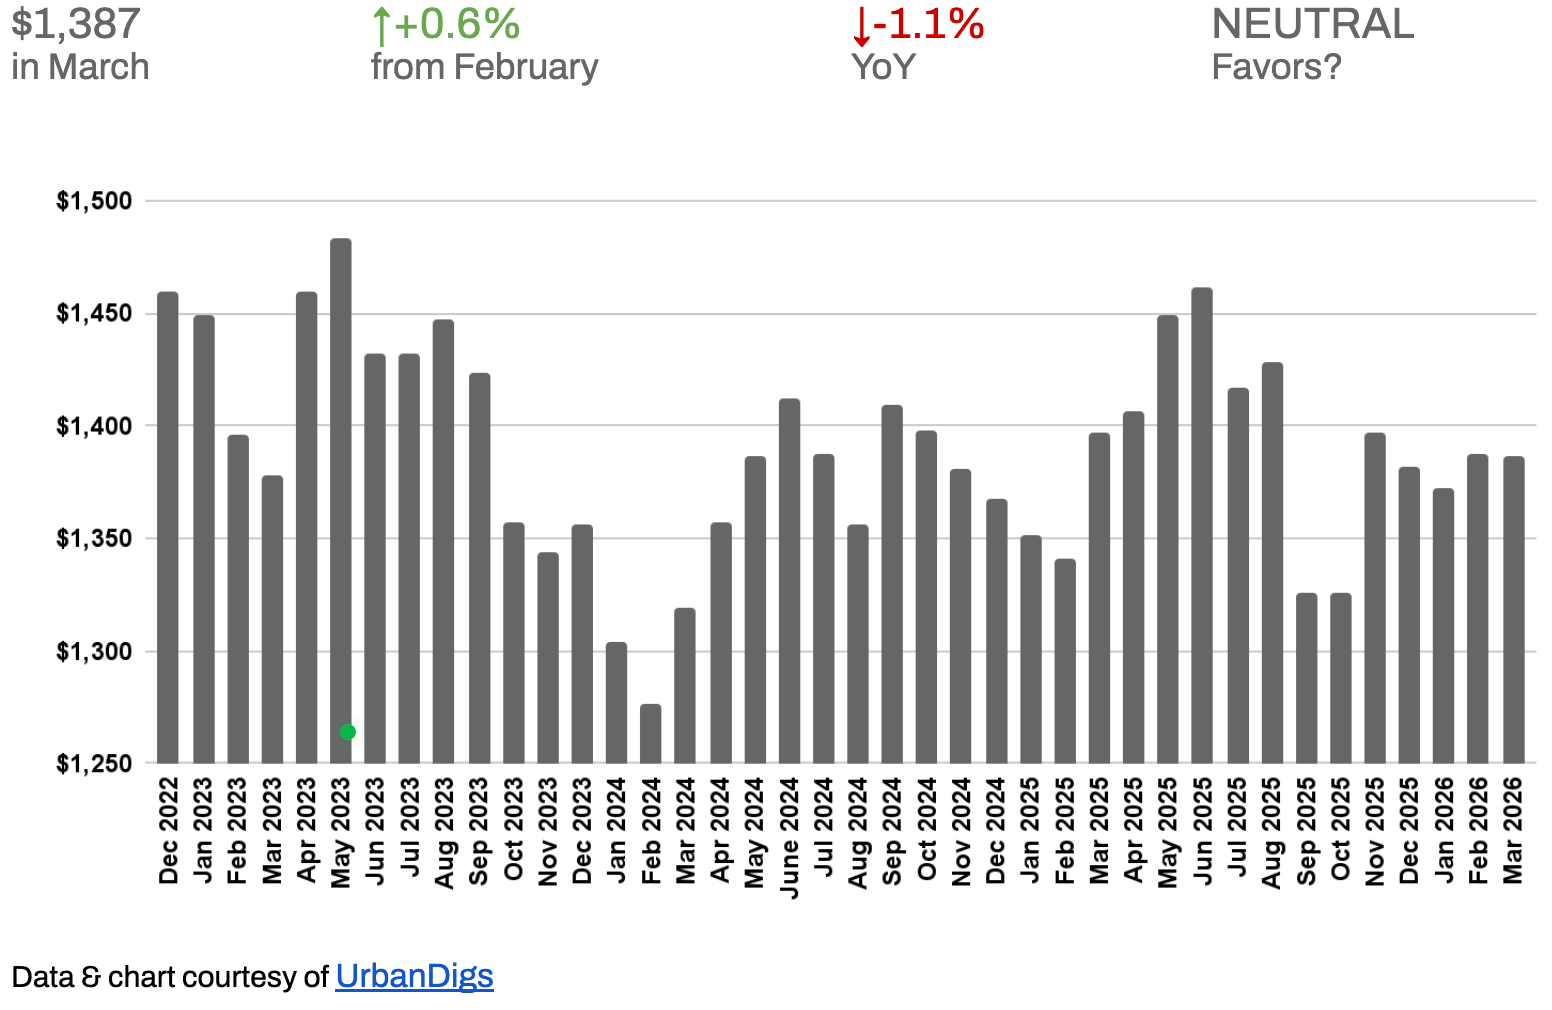
$1,387 median price per square foot — essentially flat YoY, signaling price stability rather than speculation.
-
11.9% of sales closed above asking price — a real-time indicator that competition for well-priced listings remains active.
KEY TAKEAWAYS
- Supply rose 10.7% from February to 5,966 listings, but remains 9.6% below March 2025 — structural undersupply persists.
- Contract signings rebounded sharply to 1,080, up 30% from February, signaling real spring momentum even as the YoY comparison edges slightly negative.
- Median PPSF of $1,387 is essentially flat year-over-year — a sign of pricing stability, not stagnation.
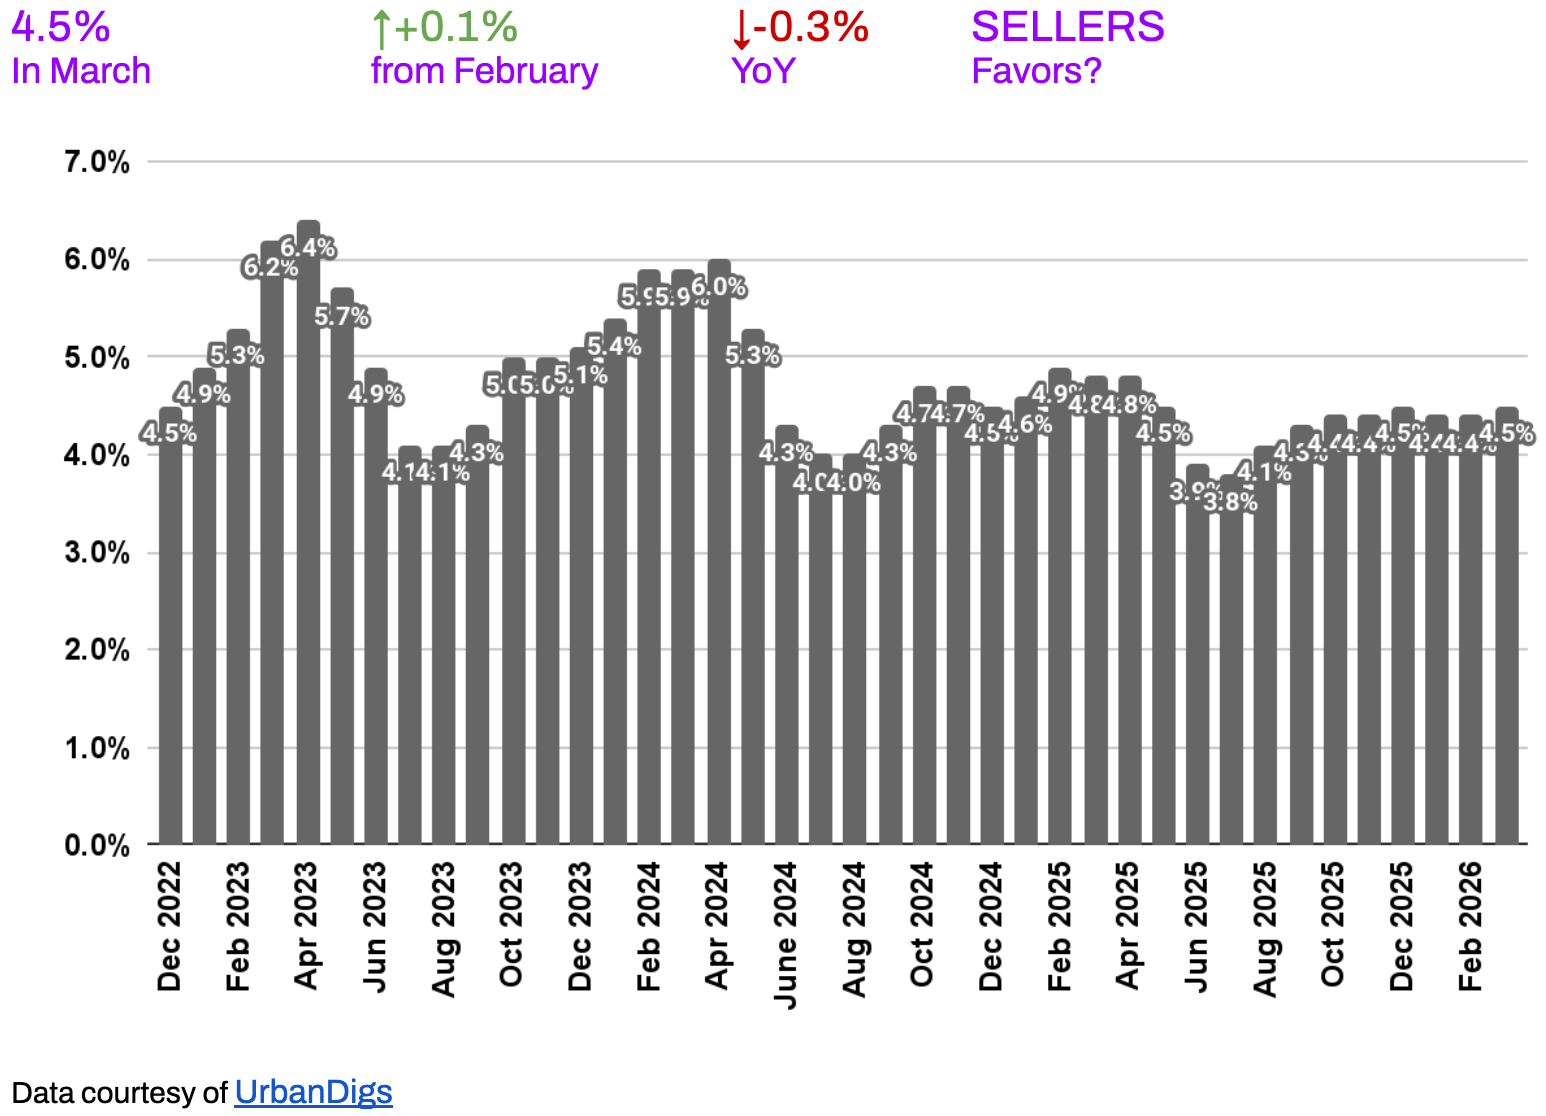
- Listing discounts remain tight at 4.5%, down 0.3% YoY — sellers continue to hold pricing power.
- Nearly 1 in 8 sales is closing above asking price, a meaningful signal in a market that avoided the frenzy of 2021–2022.
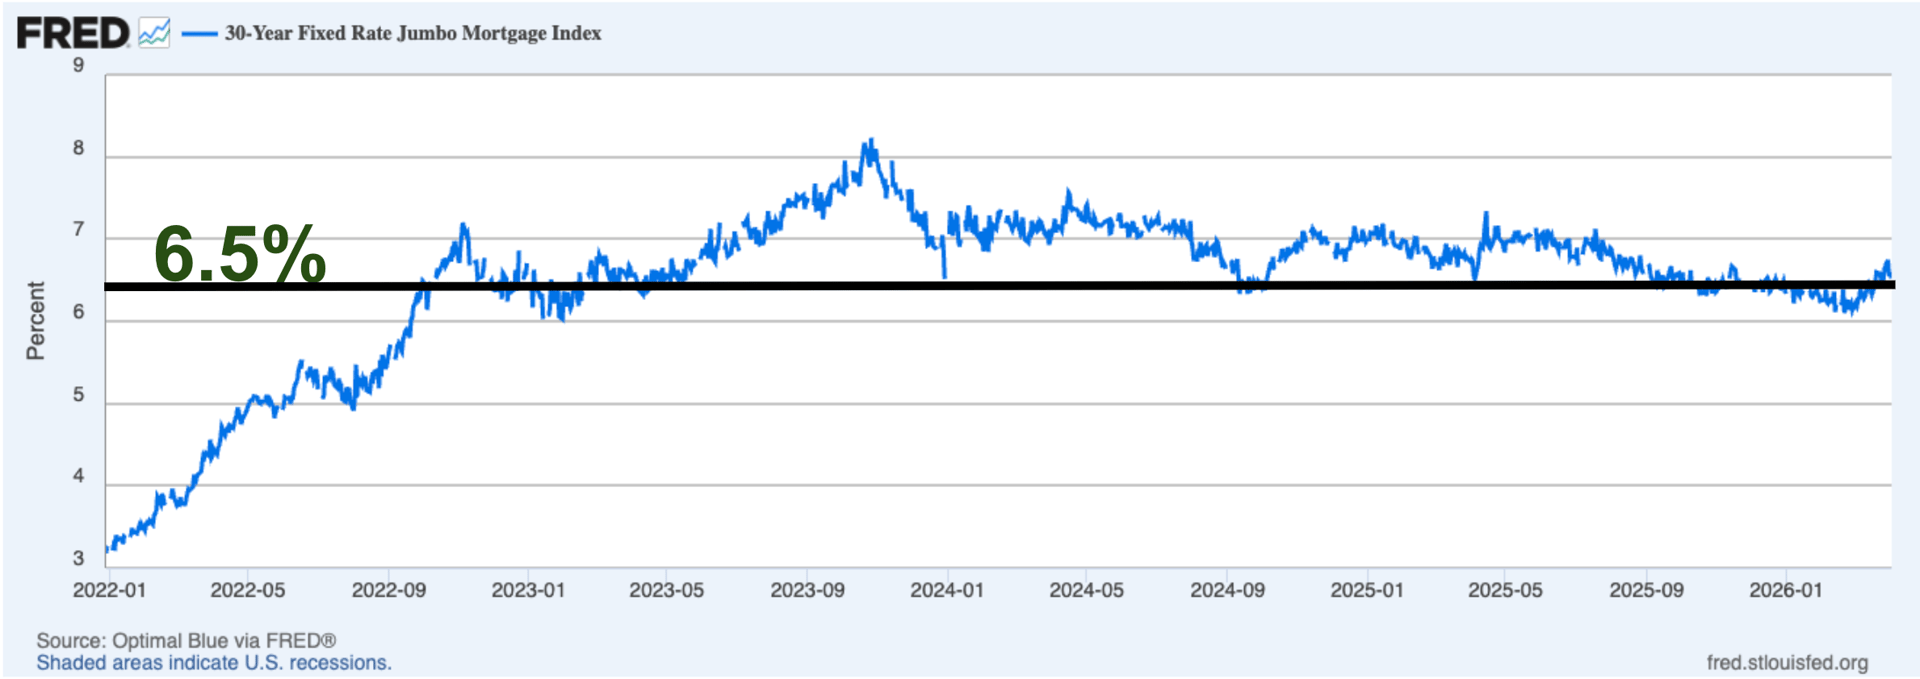
- Mortgage rates climbed back toward 6.5% in early April, adding renewed urgency for rate-sensitive buyers.
OUTLOOK
Spring 2026 is a seller-leaning market with nuance. Well-priced, move-in-ready listings are trading efficiently. Buyers with financing in place are finding selective opportunities, particularly in co-ops and value-oriented condos below $2M. The first eight weeks of spring have historically been the most active — and 2026 is proving no exception. For sellers, this window is open now.

Photo by Rihards Gederts | Howard Hanna NYC
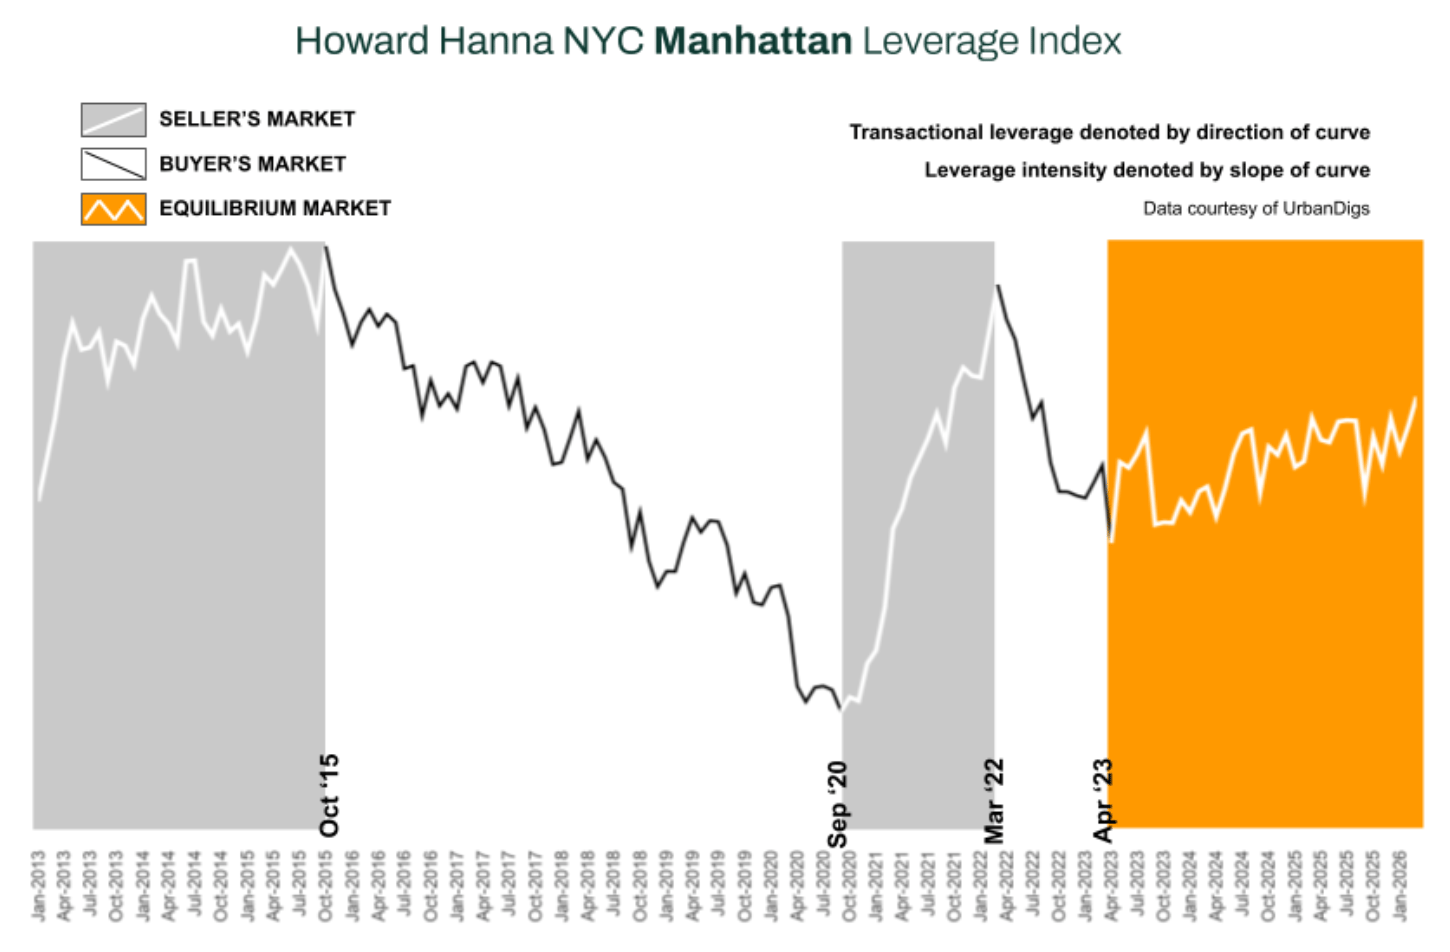
Howard Hanna NYC Manhattan Leverage Index
The Howard Hanna NYC Manhattan Leverage Index blends four key market signals – supply, demand, median PPSF, and median listing discount – to gauge the balance of power between buyers and sellers in Manhattan. It’s a proprietary index that distills these metrics into one indicator of market leverage. Direction Matters:
-
An upward-sloping curve = seller’s market
-
A downward-sloping curve = buyer’s market
The steeper the slope, the stronger the advantage for either side
In March 2026, the index edged modestly higher and remains in seller-leaning territory. Demand registered neutral, the median listing discount declined year-over-year (favoring sellers), and PPSF held within a tight band consistent with stable market conditions. Supply rose seasonally but remains below prior-year levels, keeping the underlying balance tilted toward sellers.
From a historical perspective, this resembles mid-cycle normalization periods such as 2013–2015, when mortgage rates rose modestly without triggering a broad market correction.
What is different this cycle is structural undersupply. Manhattan inventory remains well below 2017–2019 averages, limiting the probability of distress-driven repricing.
Manhattan Supply
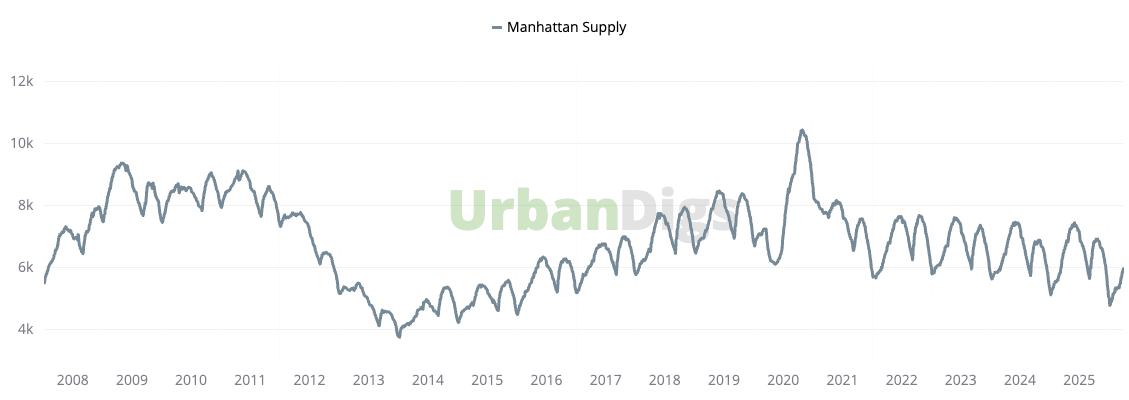
INVENTORY RISES WITH THE SEASON — BUT REMAINS WELL BELOW LAST YEAR
Active listings climbed to by +10.7% from February to 5,966 in March, a natural seasonal pickup as more sellers test the market heading into spring. But the year-over-year picture tells a different story: supply is still 9.6% below where it was at this time in 2025. That gap matters — it means buyers have fewer choices, which continues to support asking prices and limit negotiating room.
🟦 Buyers: Selection is improving month-over-month, but overall inventory remains tight relative to demand. If you find the right property, waiting for "better" conditions may mean waiting for higher competition.
🟪 Sellers: The structural supply deficit continues to work in your favor. Realistic pricing from day one — not aggressive overpricing — remains the most effective strategy in this environment.
Outlook: Inventory should continue its seasonal rise through Q2, but a meaningful shift into buyer-favoring territory is unlikely without a significant macro disruption. The supply floor remains firm.
Manhattan Demand
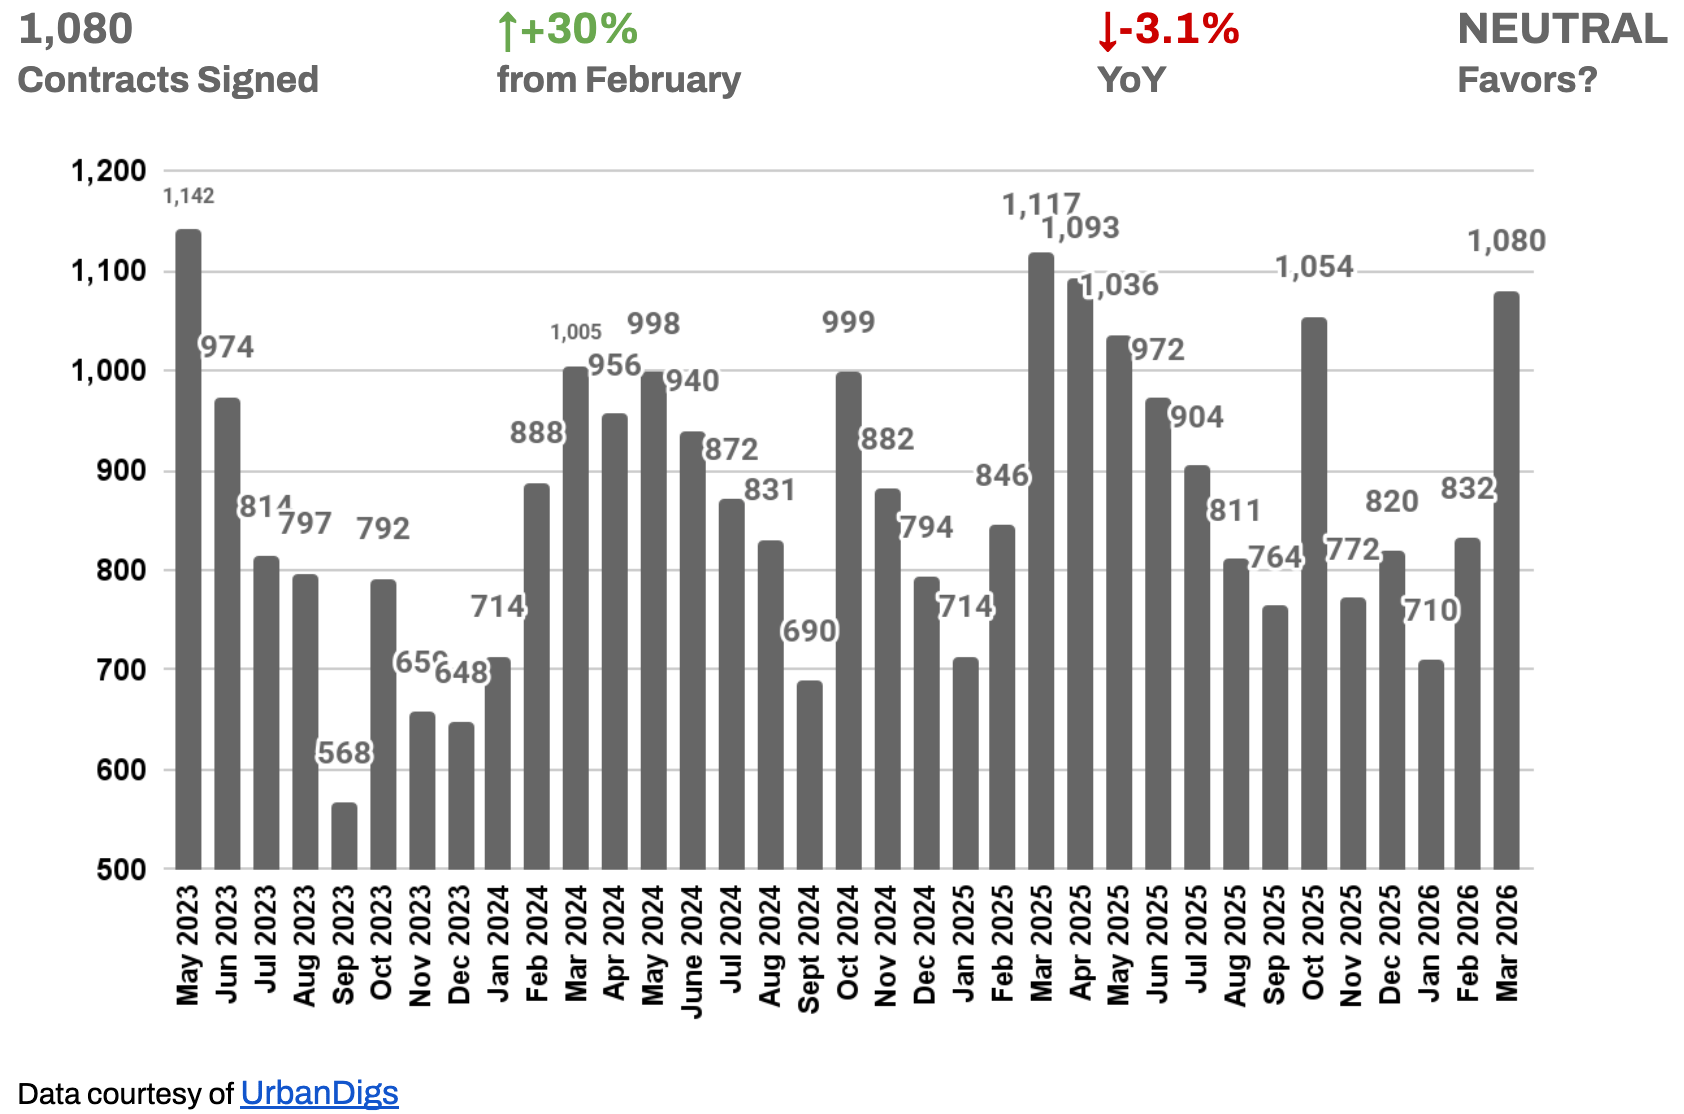
CONTRACTS SURGE AS SPRING MARKET TAKES HOLD
March brought 1,080 signed contracts — a 30% jump from February and a clear confirmation that buyers are returning to the market in force. The month-over-month acceleration is the strongest signal of the spring so far, reflecting pent-up demand that had been building through a quieter January and February.
The slight year-over-year dip of 3.1% deserves context: March 2025 was an unusually active month. Against that elevated baseline, this March's performance is reassuring rather than concerning. At 1,080 contracts, activity is comfortably within mid-cycle norms and well above the lows of late 2023.
🟦 Buyers: Momentum is building. This is not the moment to wait for a dramatic shift in leverage — it is the moment to act if you have found the right property. Spring competition typically accelerates from here.
🟪 Sellers: The 30% month-over-month demand rebound validates disciplined pricing strategies. Properly positioned listings are finding buyers, and the spring window is open.
Outlook: Contract activity is expected to continue rising through April and May as spring inventory comes online and buyer urgency increases. The trajectory points toward a steady, active spring rather than a frenzied one.
Manhattan Median PPSF
PRICING IS STABLE — AND STABILITY IS THE STORY
Median price per square foot registered $1,387 in March, up modestly from February and essentially flat year-over-year. The slight annual decline of 1.1% does not reflect distress — it reflects mix shift, as a higher proportion of co-ops and mid-market units transacted in March relative to the luxury-weighted comparable period in 2025.
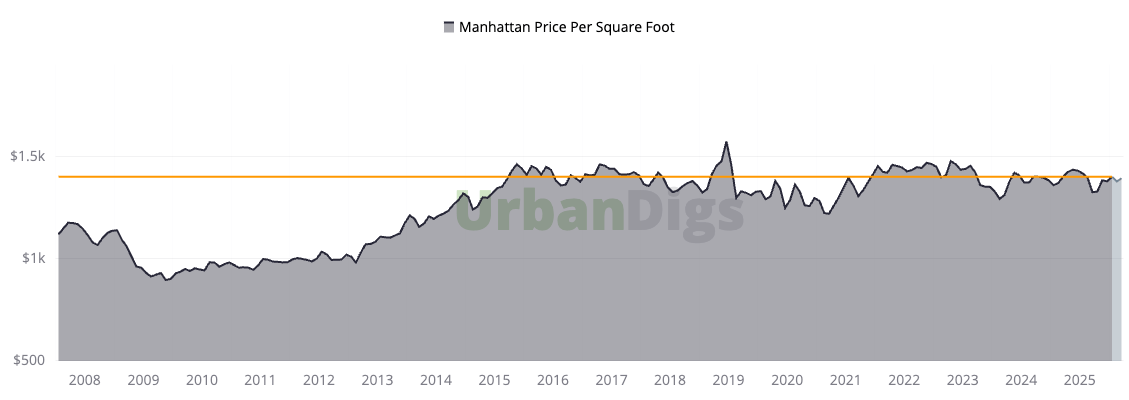
The more important signal is the longer trend: Manhattan's median PPSF has remained in a remarkably tight range for over a decade — a testament to the market's structural price stability and resistance to the boom-bust volatility seen in other U.S. metros. For buyers, this means the floor is real. For sellers, it means sky-high aspirational pricing without market support will not be rewarded.
🟦 Buyers: Broad price declines are not supported by current supply-demand dynamics. Value is asset-specific — co-ops continue to offer meaningful price-per-square-foot advantages over condos in comparable locations.
🟪 Sellers: The pricing floor is intact. Market-aligned listings are achieving strong outcomes. Properties with premium finishes, natural light, and desirable floor plans are trading at or above ask.
Outlook: PPSF is expected to firm modestly through Q2 as spring demand absorbs available inventory. A return to the $1,400+ range is plausible if luxury contract volume continues to build.
Manhattan Median Listing Discount
NEGOTIATION ROOM REMAINS LIMITED
The median listing discount held at 4.5% in March — essentially unchanged from February and down 0.3% points from a year ago. That keeps negotiation margins near multi-year lows and reinforces a consistent theme: sellers are not being pressured into meaningful price concessions.
In practical terms, this means buyers should approach the market with well-structured, competitive offers rather than anchoring to large discount expectations. The era of 8–10% listing discounts that defined the early post-pandemic correction has not returned, and current data suggests it is not imminent.
🟦 Buyers: Strategy matters more than leverage here. Competitive, well-structured offers with clean financing contingencies remain the most effective path to securing a property.
🟪 Sellers: The market continues validating realistic asking prices. Well-prepared sellers who price accurately from day one are achieving outcomes close to, and in some cases above, their listing price.
Outlook: Listing discounts may compress slightly further if spring demand strengthens as expected. Any meaningful expansion in discounts would require a notable deterioration in buyer confidence or a sharp rise in rates — neither of which appears likely in the near term.
RENTAL REMARKS
Source: StreetEasy · February 2026 NYC Market Report
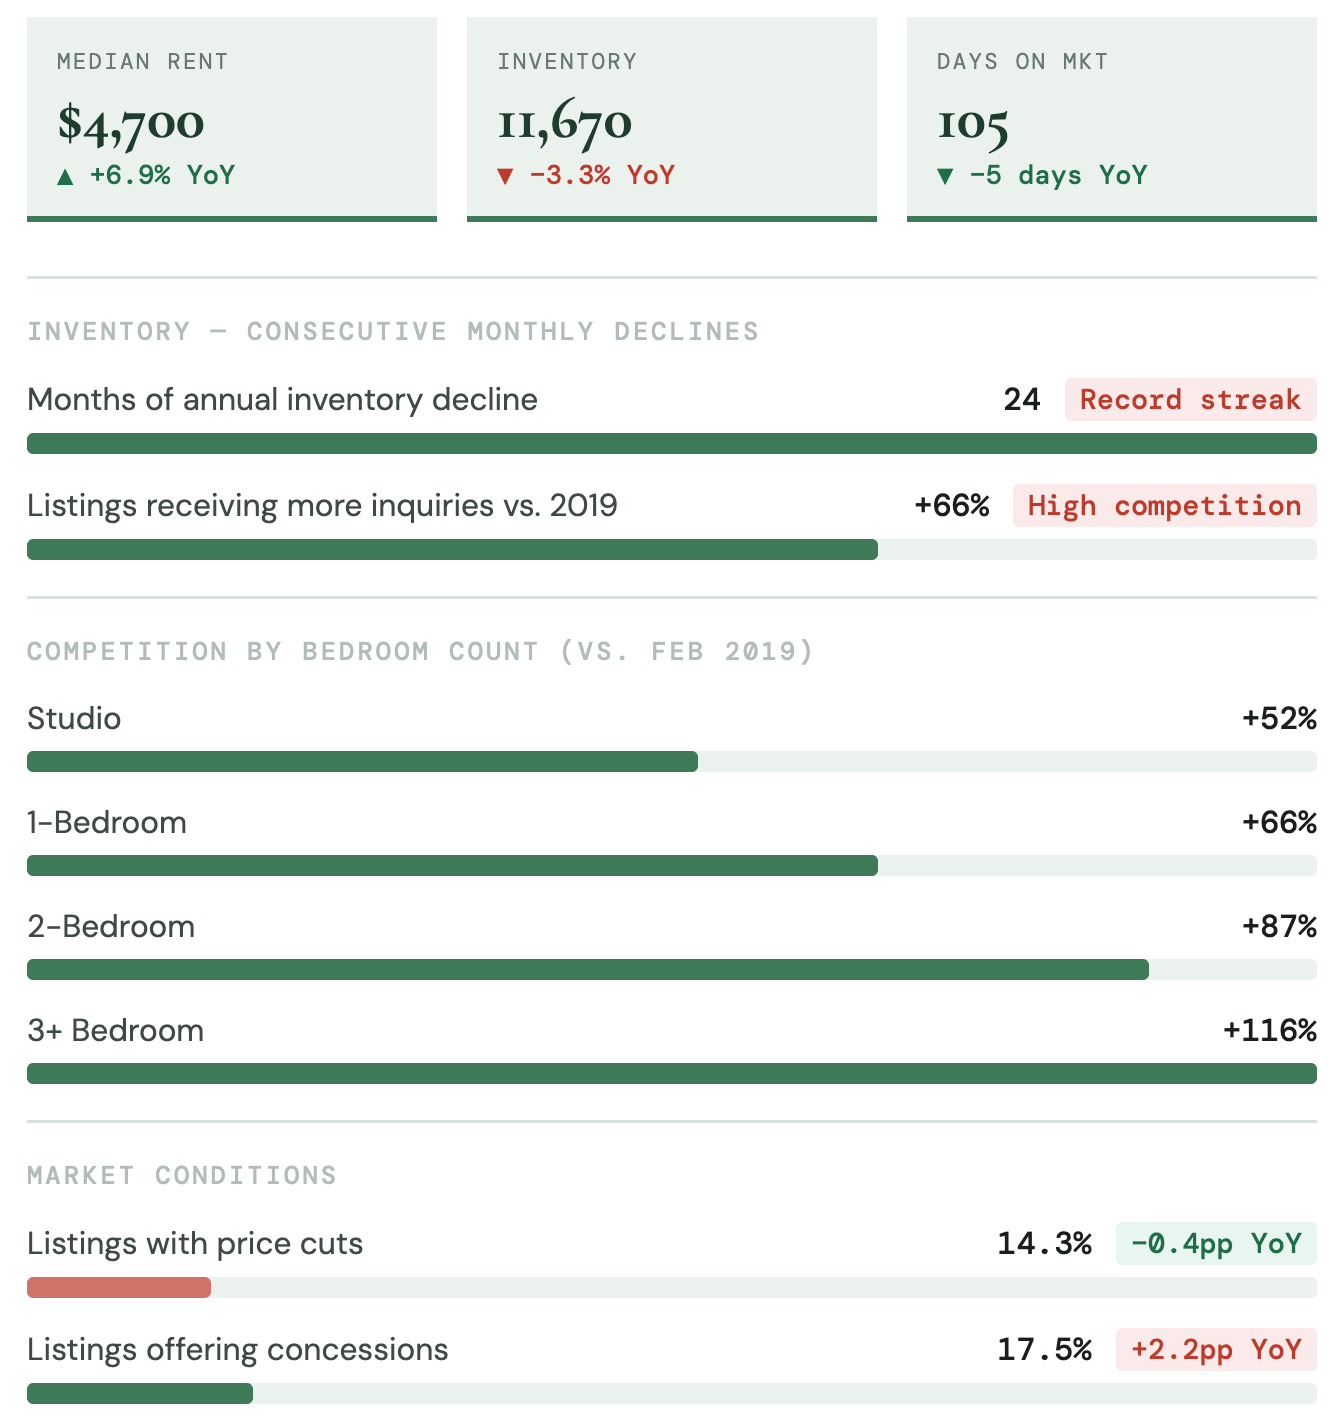
Rents Reach Record High as Inventory Falls for 24th Consecutive Month
Manhattan's rental market entered 2026 at record levels. The February median asking rent rose 6.9% year-over-year to $4,700 - a record high. Inventory fell 3.3% to 11,670 units, marking the borough's 24th consecutive month of annual declines, the longest streak ever recorded.³
New construction has done little to ease supply pressure: of 18,618 new rental units added citywide in 2025, only 2,575 were in Manhattan. With vacancy rates declining and demand structurally outpacing supply, rents are poised to remain firm through mid-2026.
🟦 Renters: Fundamentals remain strongly favorable. Tight vacancy, rising average rents and minimal new supply support stable income and long-term hold strategies.
🟪 Landlords: Fundamentals remain favorable. Tight vacancy and rising average rents support stable income and hold strategies.
Outlook: Unless inventory expands meaningfully in spring, rental pricing is expected to remain firm through mid-2026. Manhattan continues to sit out the city's new development rental boom.
MORTGAGE REMARKS
RATE UNCERTAINTY RETURNS — AND CHANGES THE CALCULUS
Mortgage conditions after few months of predictability not once again has bome back to more uncertain and increased again. In early April average 30-year jumbo rates were hovering around 6.5%⁴, with effective APRs close to 6.4%⁵.
Outlook:
After a period of relative stability, mortgage conditions have grown more unpredictable. By early April, average 30-year jumbo rates had climbed back to approximately 6.5%, with effective APRs near 6.4% — roughly 40 basis points above where they stood in February. That shift matters for transaction psychology, even if the absolute level is not historically extreme.
The brief window of rate stability near 6.1% in late winter had begun to reduce the "rate shock" hesitation that has defined buyer behavior since 2023. Some of that progress has now been undone. For buyers, the question is no longer whether rates will fall to 5% — it is whether waiting for that scenario means missing a spring window that may offer better inventory and less competition than the fall cycle.
For those buying at Manhattan price points with significant cash contributions, the rate sensitivity is meaningfully lower than for the median U.S. homebuyer. Manhattan buyers tend to be more equity-financed and less rate-dependent, which insulates the upper segments of the market from rate volatility.
INVESTOR INSIGHTS
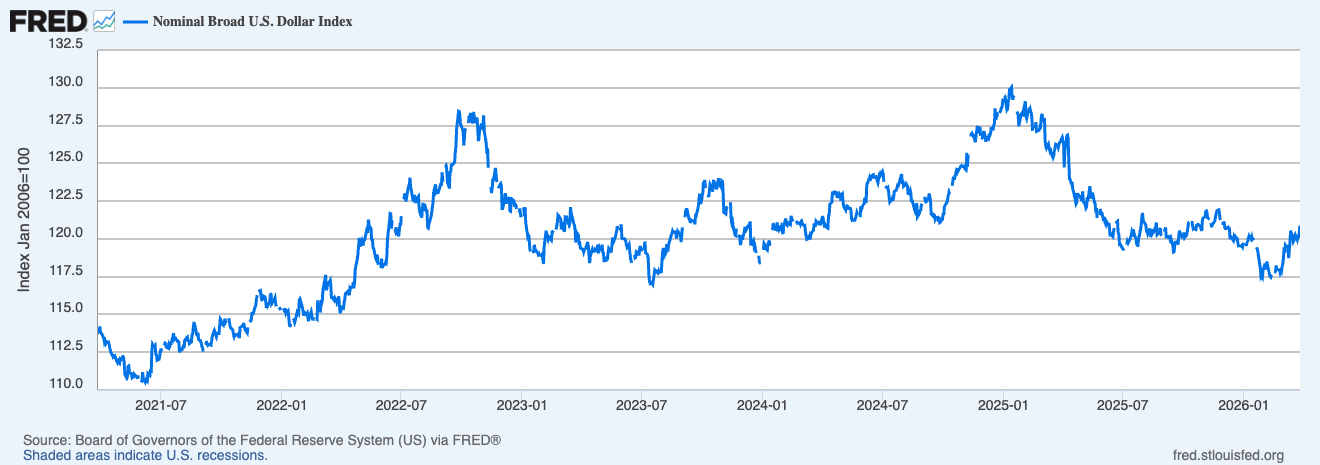
INTERNATIONAL BUYERS: A QUIET TAILWIND
A weakening U.S. dollar continues to improve the purchasing power of international buyers — particularly those from the Eurozone, the U.K., and other major economies where currencies have strengthened meaningfully against the dollar over the past 12–18 months. For a European buyer, Manhattan real estate has effectively become more affordable in local-currency terms without any change in asking prices. This is a real and under appreciated driver of demand in the luxury and ultra-luxury segments, and one that is unlikely to reverse quickly given structural dynamics in the U.S. fiscal position.
DOMESTIC INVESTORS: DISCIPLINED AND SELECTIVE
Domestic investors remain cautious but engaged. With investment mortgage rates near 6.4% and stabilized rental yields in the 3–4% range, risk-adjusted returns for traditional condo and co-op investments require careful underwriting. The era of easy leverage-driven returns is not this cycle. What it is, however, is an environment that rewards patient, value-oriented capital with a long time horizon. Well-located co-ops — particularly those with room for value-add improvement — continue to offer the most compelling entry points for domestic investors.
THE MANHATTAN PPSF STORY: WHY STABILITY IS A FEATURE, NOT A BUG
After rising from a post-financial-crisis trough near $950 per square foot to approximately $1,350 by 2015, Manhattan's median PPSF has traded in a remarkably tight range for over a decade. This is not stagnation — it is one of the defining characteristics of a mature, supply-constrained market that absorbs macro shocks without the dramatic drawdowns seen elsewhere. U.S. national home prices have seen significant appreciation and correction cycles over the same period; Manhattan has remained notably insulated.
For investors, this means Manhattan is not a market to buy for explosive upside. It is a market to buy for capital preservation, rental yield, currency diversification, and quality of asset. Those objectives have not changed — and in a world of elevated macro uncertainty, they may be more relevant than ever.
References
1. Data courtesy of UrbanDigs
2. According to the Howard Hanna NYC Manhattan Leverage Index
3. Data courtesy of StreetEasy · February 2026 NYC Market Report
4. Data courtesy of Federal Reserve Bank of St. Louis
5. JUMBO mortgage rate APR data courtesy of Bank of America, Chase, and Wells Fargo
6. Cover Photo by Rihards Gederts.